Zip Codes with the Highest Percentage of Population Employed in Health Diagnosing & Treating in Clarksville, TN
RELATED REPORTS & OPTIONS
Health Diagnosing & Treating
Clarksville
Compare Zip Codes
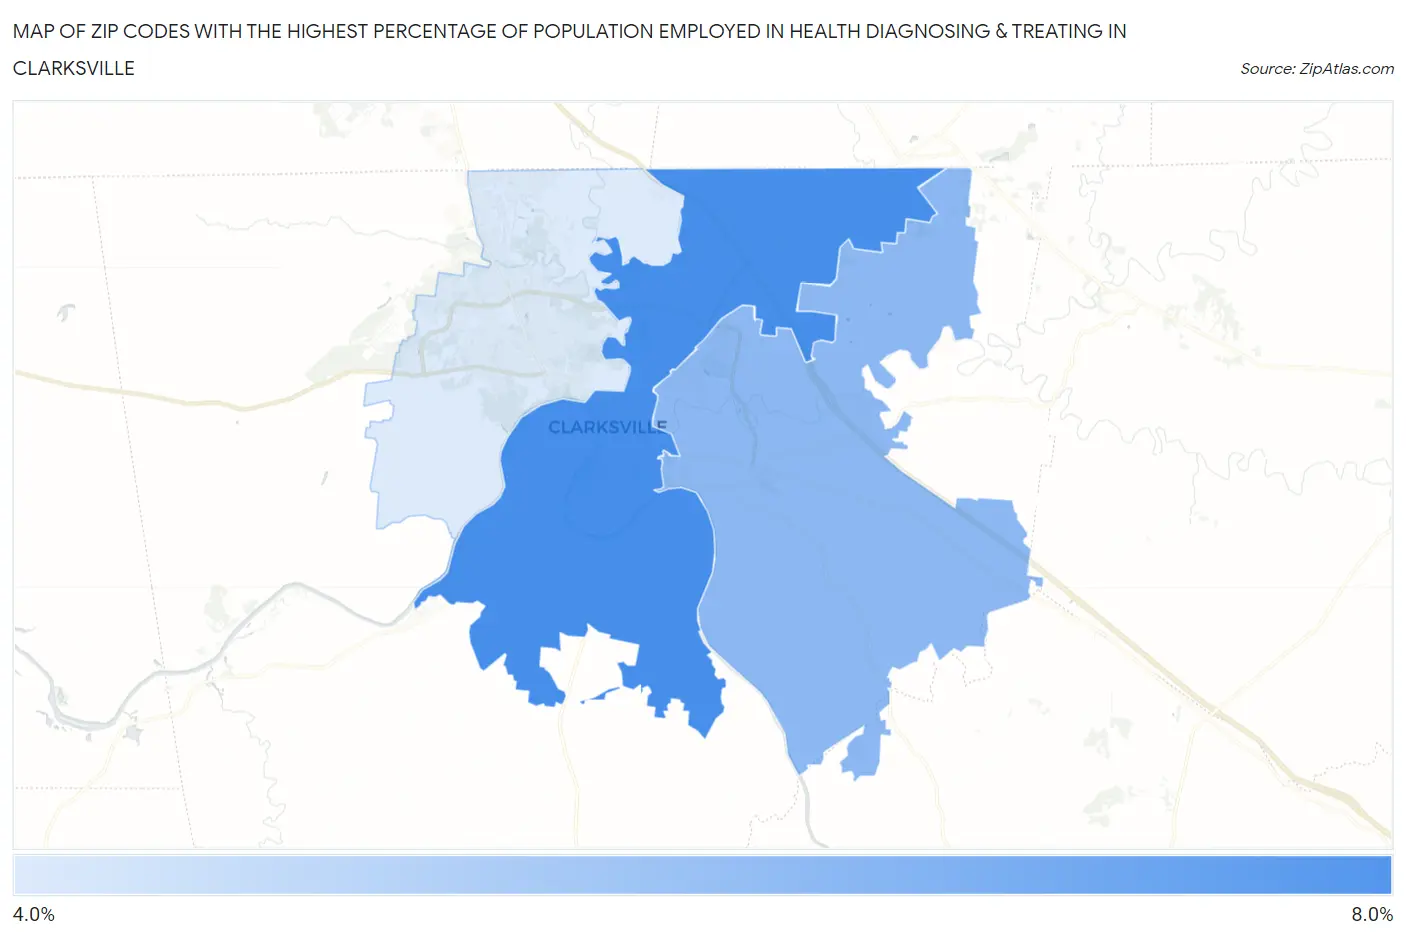
Map of Zip Codes with the Highest Percentage of Population Employed in Health Diagnosing & Treating in Clarksville
4.8%
7.8%
Zip Codes with the Highest Percentage of Population Employed in Health Diagnosing & Treating in Clarksville, TN
| Zip Code | % Employed | vs State | vs National | |
| 1. | 37040 | 7.8% | 6.9%(+0.897)#200 | 6.2%(+1.51)#8,100 |
| 2. | 37043 | 6.4% | 6.9%(-0.499)#297 | 6.2%(+0.118)#12,527 |
| 3. | 37042 | 4.8% | 6.9%(-2.09)#405 | 6.2%(-1.47)#18,596 |
1
Common Questions
What are the Top Zip Codes with the Highest Percentage of Population Employed in Health Diagnosing & Treating in Clarksville, TN?
Top Zip Codes with the Highest Percentage of Population Employed in Health Diagnosing & Treating in Clarksville, TN are:
What zip code has the Highest Percentage of Population Employed in Health Diagnosing & Treating in Clarksville, TN?
37040 has the Highest Percentage of Population Employed in Health Diagnosing & Treating in Clarksville, TN with 7.8%.
What is the Percentage of Population Employed in Health Diagnosing & Treating in Clarksville, TN?
Percentage of Population Employed in Health Diagnosing & Treating in Clarksville is 5.8%.
What is the Percentage of Population Employed in Health Diagnosing & Treating in Tennessee?
Percentage of Population Employed in Health Diagnosing & Treating in Tennessee is 6.9%.
What is the Percentage of Population Employed in Health Diagnosing & Treating in the United States?
Percentage of Population Employed in Health Diagnosing & Treating in the United States is 6.2%.