Chesterfield, TN Map & Demographics
Chesterfield Map
Chesterfield Overview
$19,163
PER CAPITA INCOME
$58,859
AVG FAMILY INCOME
$58,261
AVG HOUSEHOLD INCOME
0.34
INEQUALITY / GINI INDEX
834
TOTAL POPULATION
426
MALE POPULATION
408
FEMALE POPULATION
104.41
MALES / 100 FEMALES
95.77
FEMALES / 100 MALES
36.6
MEDIAN AGE
3.8
AVG FAMILY SIZE
3.5
AVG HOUSEHOLD SIZE
392
LABOR FORCE [ PEOPLE ]
65.3%
PERCENT IN LABOR FORCE
11.2%
UNEMPLOYMENT RATE
Income in Chesterfield
Income Overview in Chesterfield
Per Capita Income in Chesterfield is $19,163, while median incomes of families and households are $58,859 and $58,261 respectively.
| Characteristic | Number | Measure |
| Per Capita Income | 834 | $19,163 |
| Median Family Income | 214 | $58,859 |
| Mean Family Income | 214 | $68,147 |
| Median Household Income | 236 | $58,261 |
| Mean Household Income | 236 | $64,075 |
| Income Deficit | 214 | $0 |
| Wage / Income Gap (%) | 834 | 0.00% |
| Wage / Income Gap ($) | 834 | 100.00¢ per $1 |
| Gini / Inequality Index | 834 | 0.34 |
Earnings by Sex in Chesterfield
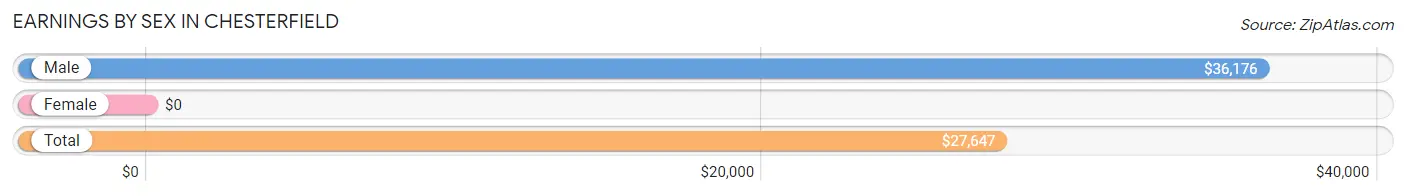
| Sex | Number | Average Earnings |
| Male | 164 (41.0%) | $36,176 |
| Female | 236 (59.0%) | $0 |
| Total | 400 (100.0%) | $27,647 |
Earnings by Sex by Income Bracket in Chesterfield
The most common earnings brackets in Chesterfield are $35,000 to $39,999 for men (34 | 20.7%) and $2,500 to $4,999 for women (55 | 23.3%).
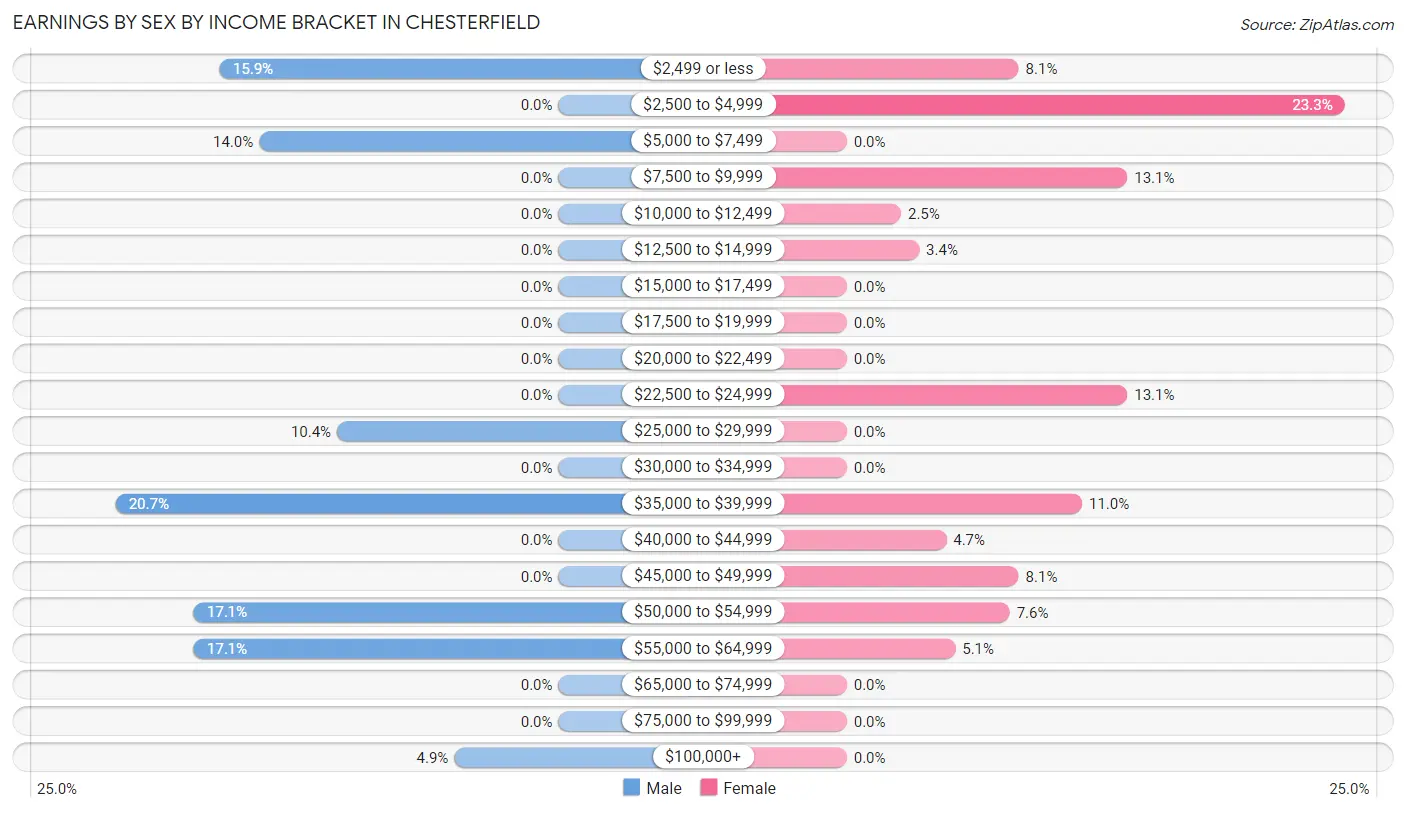
| Income | Male | Female |
| $2,499 or less | 26 (15.9%) | 19 (8.1%) |
| $2,500 to $4,999 | 0 (0.0%) | 55 (23.3%) |
| $5,000 to $7,499 | 23 (14.0%) | 0 (0.0%) |
| $7,500 to $9,999 | 0 (0.0%) | 31 (13.1%) |
| $10,000 to $12,499 | 0 (0.0%) | 6 (2.5%) |
| $12,500 to $14,999 | 0 (0.0%) | 8 (3.4%) |
| $15,000 to $17,499 | 0 (0.0%) | 0 (0.0%) |
| $17,500 to $19,999 | 0 (0.0%) | 0 (0.0%) |
| $20,000 to $22,499 | 0 (0.0%) | 0 (0.0%) |
| $22,500 to $24,999 | 0 (0.0%) | 31 (13.1%) |
| $25,000 to $29,999 | 17 (10.4%) | 0 (0.0%) |
| $30,000 to $34,999 | 0 (0.0%) | 0 (0.0%) |
| $35,000 to $39,999 | 34 (20.7%) | 26 (11.0%) |
| $40,000 to $44,999 | 0 (0.0%) | 11 (4.7%) |
| $45,000 to $49,999 | 0 (0.0%) | 19 (8.1%) |
| $50,000 to $54,999 | 28 (17.1%) | 18 (7.6%) |
| $55,000 to $64,999 | 28 (17.1%) | 12 (5.1%) |
| $65,000 to $74,999 | 0 (0.0%) | 0 (0.0%) |
| $75,000 to $99,999 | 0 (0.0%) | 0 (0.0%) |
| $100,000+ | 8 (4.9%) | 0 (0.0%) |
| Total | 164 (100.0%) | 236 (100.0%) |
Earnings by Sex by Educational Attainment in Chesterfield
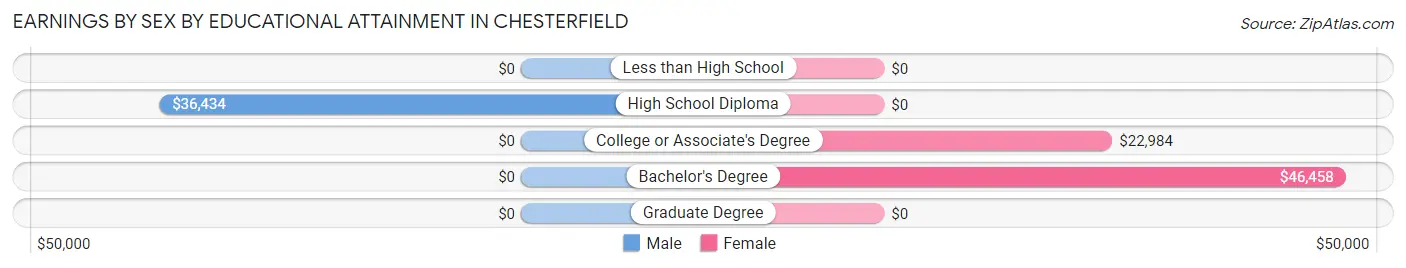
| Educational Attainment | Male Income | Female Income |
| Less than High School | - | - |
| High School Diploma | $36,434 | $0 |
| College or Associate's Degree | - | - |
| Bachelor's Degree | - | - |
| Graduate Degree | - | - |
| Total | $36,801 | $0 |
Family Income in Chesterfield
Family Income Brackets in Chesterfield
According to the Chesterfield family income data, there are 55 families falling into the $50,000 to $74,999 income range, which is the most common income bracket and makes up 25.7% of all families.
| Income Bracket | # Families | % Families |
| Less than $10,000 | 0 | 0.0% |
| $10,000 to $14,999 | 14 | 6.5% |
| $15,000 to $24,999 | 12 | 5.6% |
| $25,000 to $34,999 | 47 | 22.0% |
| $35,000 to $49,999 | 0 | 0.0% |
| $50,000 to $74,999 | 55 | 25.7% |
| $75,000 to $99,999 | 49 | 22.9% |
| $100,000 to $149,999 | 29 | 13.6% |
| $150,000 to $199,999 | 8 | 3.7% |
| $200,000+ | 0 | 0.0% |
Family Income by Famaliy Size in Chesterfield
3-person families (79 | 36.9%) account for the highest median family income in Chesterfield with $57,702 per family, while 3-person families (79 | 36.9%) have the highest median income of $19,234 per family member.
| Income Bracket | # Families | Median Income |
| 2-Person Families | 65 (30.4%) | $0 |
| 3-Person Families | 79 (36.9%) | $57,702 |
| 4-Person Families | 26 (12.1%) | $0 |
| 5-Person Families | 0 (0.0%) | $0 |
| 6-Person Families | 26 (12.1%) | $0 |
| 7+ Person Families | 18 (8.4%) | $0 |
| Total | 214 (100.0%) | $58,859 |
Family Income by Number of Earners in Chesterfield
| Number of Earners | # Families | Median Income |
| No Earners | 21 (9.8%) | $0 |
| 1 Earner | 72 (33.6%) | $32,984 |
| 2 Earners | 103 (48.1%) | $86,146 |
| 3+ Earners | 18 (8.4%) | $0 |
| Total | 214 (100.0%) | $58,859 |
Household Income in Chesterfield
Household Income Brackets in Chesterfield
With 55 households falling in the category, the $50,000 to $74,999 income range is the most frequent in Chesterfield, accounting for 23.3% of all households.
| Income Bracket | # Households | % Households |
| Less than $10,000 | 0 | 0.0% |
| $10,000 to $14,999 | 24 | 10.2% |
| $15,000 to $24,999 | 18 | 7.6% |
| $25,000 to $34,999 | 47 | 19.9% |
| $35,000 to $49,999 | 6 | 2.5% |
| $50,000 to $74,999 | 55 | 23.3% |
| $75,000 to $99,999 | 49 | 20.8% |
| $100,000 to $149,999 | 29 | 12.3% |
| $150,000 to $199,999 | 8 | 3.4% |
| $200,000+ | 0 | 0.0% |
Household Income by Householder Age in Chesterfield
The median household income in Chesterfield is $58,261, with the highest median household income of $77,500 found in the 25 to 44 years age bracket for the primary householder. A total of 74 households (31.4%) fall into this category.
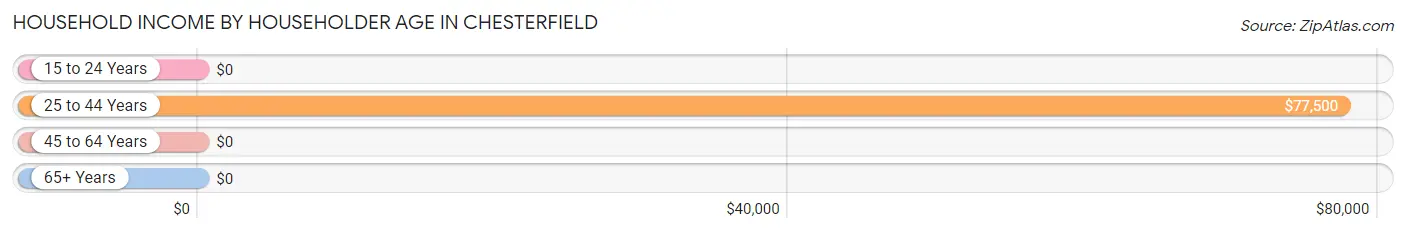
| Income Bracket | # Households | Median Income |
| 15 to 24 Years | 0 (0.0%) | $0 |
| 25 to 44 Years | 74 (31.4%) | $77,500 |
| 45 to 64 Years | 83 (35.2%) | $0 |
| 65+ Years | 79 (33.5%) | $0 |
| Total | 236 (100.0%) | $58,261 |
Poverty in Chesterfield
Income Below Poverty by Sex and Age in Chesterfield
With 9.1% poverty level for males and 3.2% for females among the residents of Chesterfield, 55 to 64 year old males and 55 to 64 year old females are the most vulnerable to poverty, with 8 males (50.0%) and 7 females (33.3%) in their respective age groups living below the poverty level.
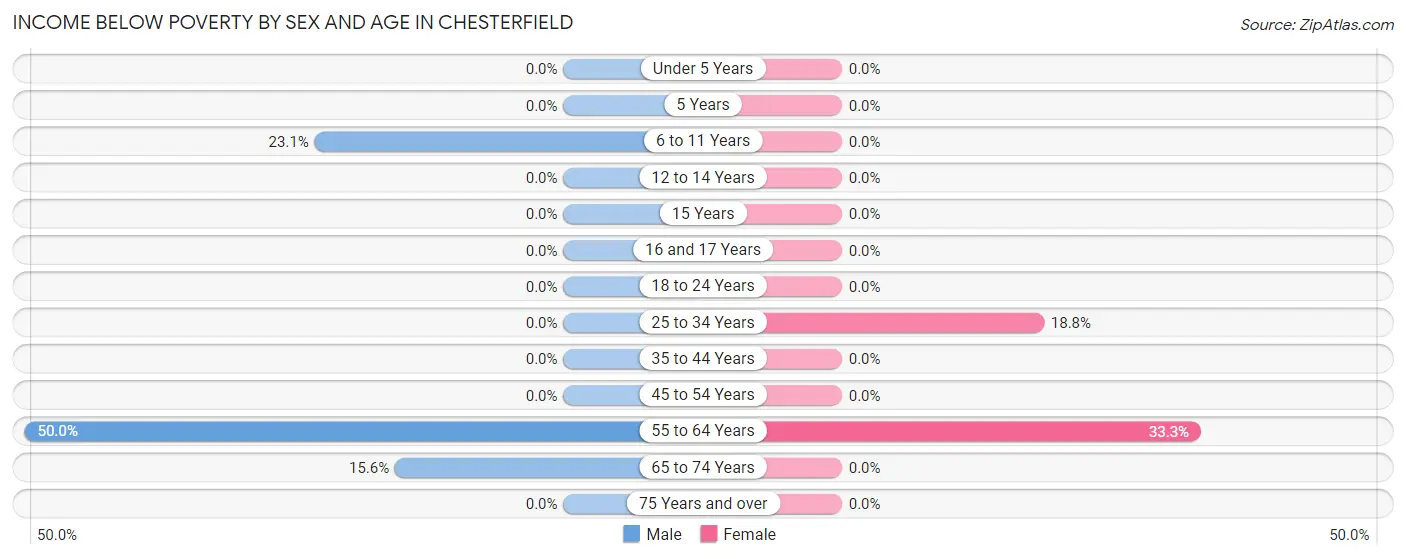
| Age Bracket | Male | Female |
| Under 5 Years | 0 (0.0%) | 0 (0.0%) |
| 5 Years | 0 (0.0%) | 0 (0.0%) |
| 6 to 11 Years | 21 (23.1%) | 0 (0.0%) |
| 12 to 14 Years | 0 (0.0%) | 0 (0.0%) |
| 15 Years | 0 (0.0%) | 0 (0.0%) |
| 16 and 17 Years | 0 (0.0%) | 0 (0.0%) |
| 18 to 24 Years | 0 (0.0%) | 0 (0.0%) |
| 25 to 34 Years | 0 (0.0%) | 6 (18.8%) |
| 35 to 44 Years | 0 (0.0%) | 0 (0.0%) |
| 45 to 54 Years | 0 (0.0%) | 0 (0.0%) |
| 55 to 64 Years | 8 (50.0%) | 7 (33.3%) |
| 65 to 74 Years | 10 (15.6%) | 0 (0.0%) |
| 75 Years and over | 0 (0.0%) | 0 (0.0%) |
| Total | 39 (9.1%) | 13 (3.2%) |
Income Above Poverty by Sex and Age in Chesterfield
According to the poverty statistics in Chesterfield, males aged 5 years and females aged 6 to 11 years are the age groups that are most secure financially, with 100.0% of males and 100.0% of females in these age groups living above the poverty line.
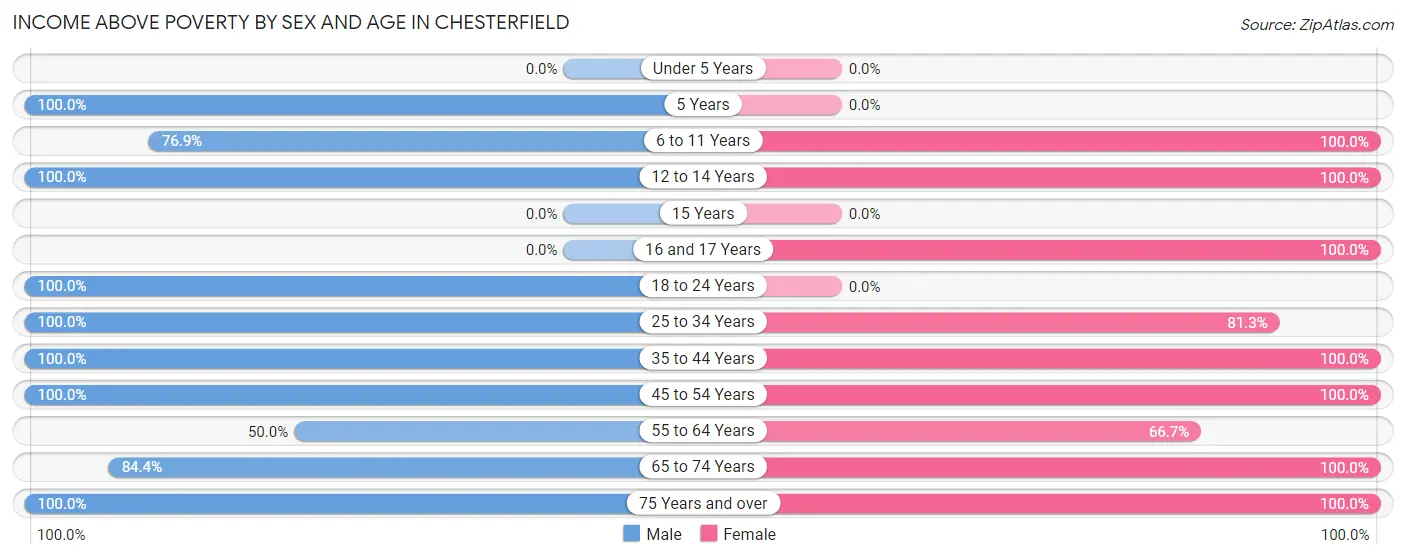
| Age Bracket | Male | Female |
| Under 5 Years | 0 (0.0%) | 0 (0.0%) |
| 5 Years | 11 (100.0%) | 0 (0.0%) |
| 6 to 11 Years | 70 (76.9%) | 74 (100.0%) |
| 12 to 14 Years | 26 (100.0%) | 32 (100.0%) |
| 15 Years | 0 (0.0%) | 0 (0.0%) |
| 16 and 17 Years | 0 (0.0%) | 23 (100.0%) |
| 18 to 24 Years | 17 (100.0%) | 0 (0.0%) |
| 25 to 34 Years | 82 (100.0%) | 26 (81.2%) |
| 35 to 44 Years | 46 (100.0%) | 55 (100.0%) |
| 45 to 54 Years | 54 (100.0%) | 105 (100.0%) |
| 55 to 64 Years | 8 (50.0%) | 14 (66.7%) |
| 65 to 74 Years | 54 (84.4%) | 45 (100.0%) |
| 75 Years and over | 19 (100.0%) | 21 (100.0%) |
| Total | 387 (90.8%) | 395 (96.8%) |
Income Below Poverty Among Married-Couple Families in Chesterfield
The poverty statistics for married-couple families in Chesterfield show that 4.1% or 8 of the total 196 families live below the poverty line. Families with no children have the highest poverty rate of 7.3%, comprising of 8 families. On the other hand, families with 1 or 2 children have the lowest poverty rate of 0.0%, which includes 0 families.
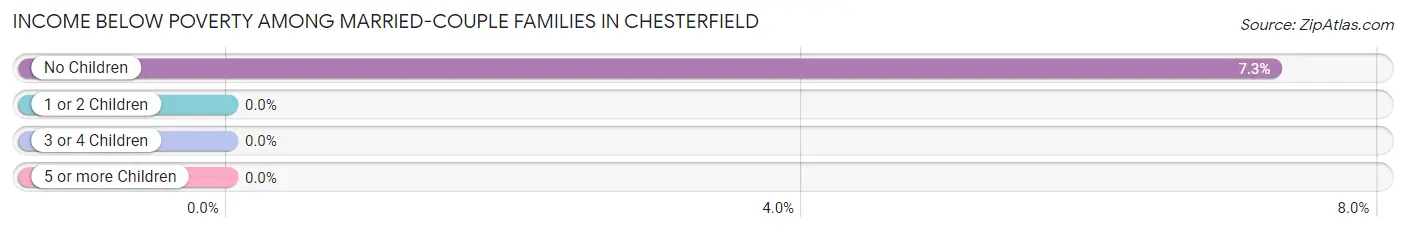
| Children | Above Poverty | Below Poverty |
| No Children | 102 (92.7%) | 8 (7.3%) |
| 1 or 2 Children | 42 (100.0%) | 0 (0.0%) |
| 3 or 4 Children | 26 (100.0%) | 0 (0.0%) |
| 5 or more Children | 18 (100.0%) | 0 (0.0%) |
| Total | 188 (95.9%) | 8 (4.1%) |
Income Below Poverty Among Single-Parent Households in Chesterfield
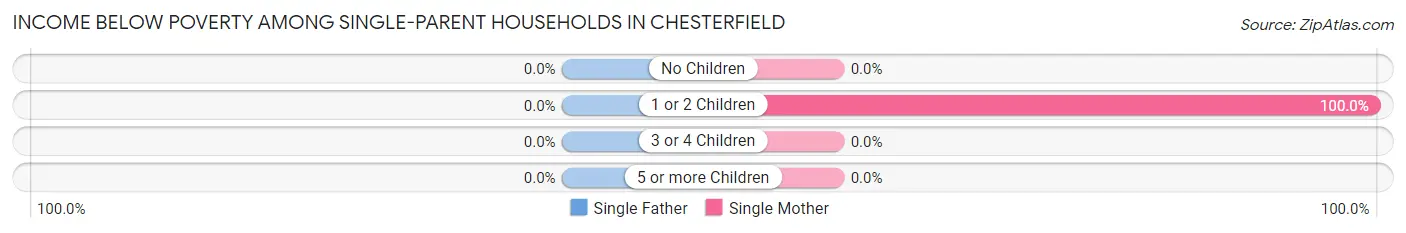
| Children | Single Father | Single Mother |
| No Children | 0 (0.0%) | 0 (0.0%) |
| 1 or 2 Children | 0 (0.0%) | 6 (100.0%) |
| 3 or 4 Children | 0 (0.0%) | 0 (0.0%) |
| 5 or more Children | 0 (0.0%) | 0 (0.0%) |
| Total | 0 (0.0%) | 6 (33.3%) |
Income Below Poverty Among Married-Couple vs Single-Parent Households in Chesterfield
The poverty data for Chesterfield shows that 8 of the married-couple family households (4.1%) and 6 of the single-parent households (33.3%) are living below the poverty level. Within the married-couple family households, those with no children have the highest poverty rate, with 8 households (7.3%) falling below the poverty line. Among the single-parent households, those with 1 or 2 children have the highest poverty rate, with 6 household (100.0%) living below poverty.
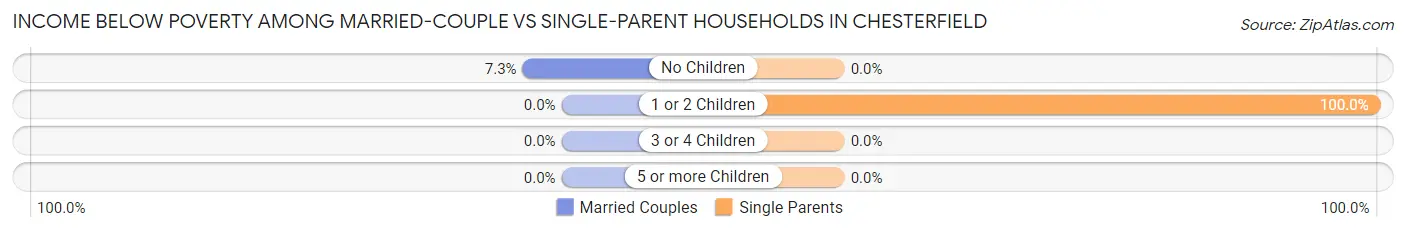
| Children | Married-Couple Families | Single-Parent Households |
| No Children | 8 (7.3%) | 0 (0.0%) |
| 1 or 2 Children | 0 (0.0%) | 6 (100.0%) |
| 3 or 4 Children | 0 (0.0%) | 0 (0.0%) |
| 5 or more Children | 0 (0.0%) | 0 (0.0%) |
| Total | 8 (4.1%) | 6 (33.3%) |
Race in Chesterfield
The most populous races in Chesterfield are White / Caucasian (834 | 100.0%), and Hispanic or Latino (27 | 3.2%).
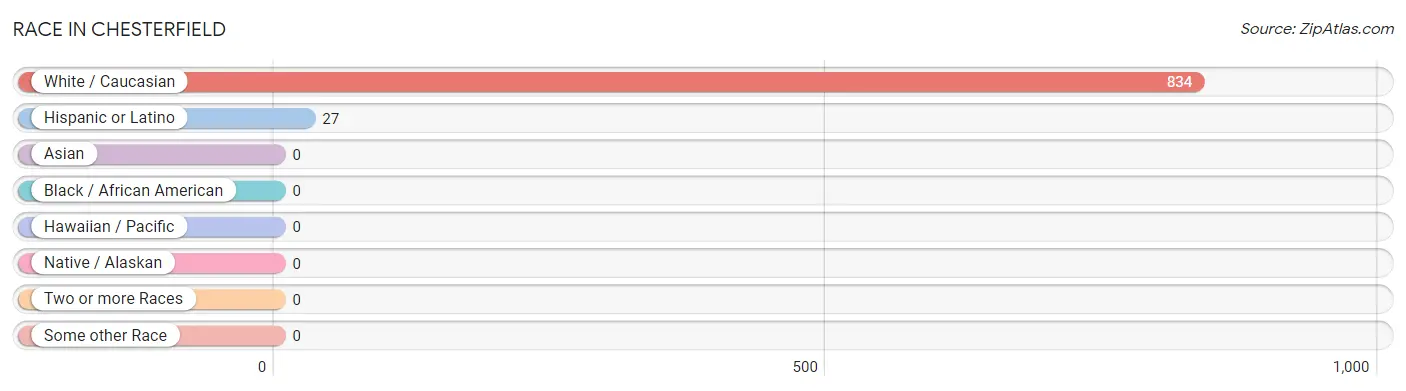
| Race | # Population | % Population |
| Asian | 0 | 0.0% |
| Black / African American | 0 | 0.0% |
| Hawaiian / Pacific | 0 | 0.0% |
| Hispanic or Latino | 27 | 3.2% |
| Native / Alaskan | 0 | 0.0% |
| White / Caucasian | 834 | 100.0% |
| Two or more Races | 0 | 0.0% |
| Some other Race | 0 | 0.0% |
| Total | 834 | 100.0% |
Ancestry in Chesterfield
The most populous ancestries reported in Chesterfield are German (131 | 15.7%), English (66 | 7.9%), Irish (37 | 4.4%), Mexican (27 | 3.2%), and American (18 | 2.2%), together accounting for 33.5% of all Chesterfield residents.
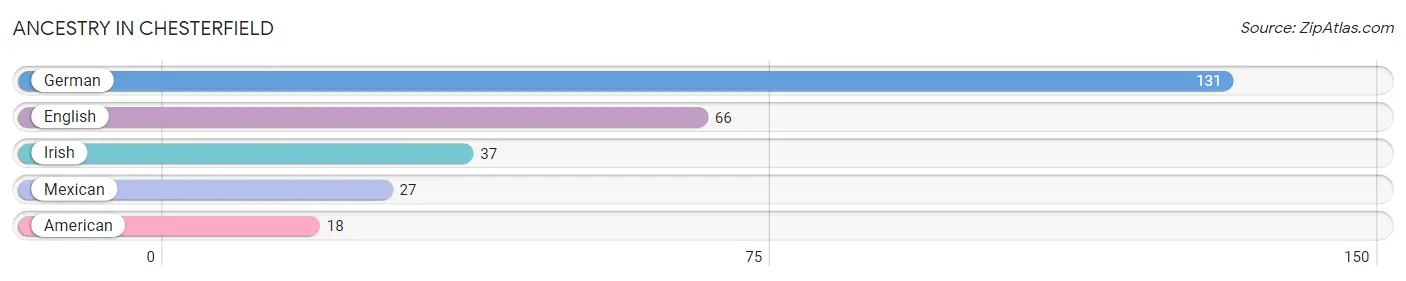
| Ancestry | # Population | % Population |
| American | 18 | 2.2% |
| English | 66 | 7.9% |
| German | 131 | 15.7% |
| Irish | 37 | 4.4% |
| Mexican | 27 | 3.2% | View All 5 Rows |
Immigrants in Chesterfield

| Immigration Origin | # Population | % Population | View All 0 Rows |
Sex and Age in Chesterfield
Sex and Age in Chesterfield
The most populous age groups in Chesterfield are 5 to 9 Years (66 | 15.5%) for men and 50 to 54 Years (87 | 21.3%) for women.
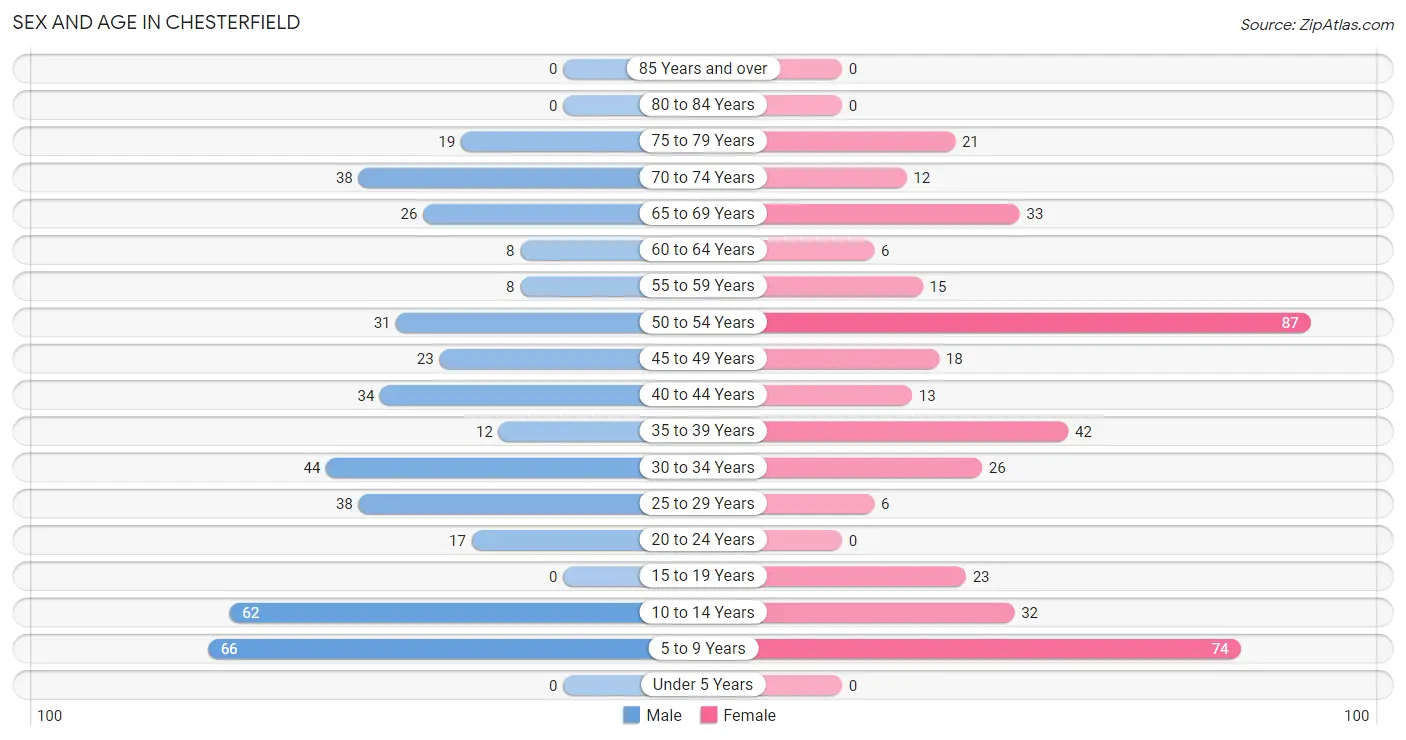
| Age Bracket | Male | Female |
| Under 5 Years | 0 (0.0%) | 0 (0.0%) |
| 5 to 9 Years | 66 (15.5%) | 74 (18.1%) |
| 10 to 14 Years | 62 (14.5%) | 32 (7.8%) |
| 15 to 19 Years | 0 (0.0%) | 23 (5.6%) |
| 20 to 24 Years | 17 (4.0%) | 0 (0.0%) |
| 25 to 29 Years | 38 (8.9%) | 6 (1.5%) |
| 30 to 34 Years | 44 (10.3%) | 26 (6.4%) |
| 35 to 39 Years | 12 (2.8%) | 42 (10.3%) |
| 40 to 44 Years | 34 (8.0%) | 13 (3.2%) |
| 45 to 49 Years | 23 (5.4%) | 18 (4.4%) |
| 50 to 54 Years | 31 (7.3%) | 87 (21.3%) |
| 55 to 59 Years | 8 (1.9%) | 15 (3.7%) |
| 60 to 64 Years | 8 (1.9%) | 6 (1.5%) |
| 65 to 69 Years | 26 (6.1%) | 33 (8.1%) |
| 70 to 74 Years | 38 (8.9%) | 12 (2.9%) |
| 75 to 79 Years | 19 (4.5%) | 21 (5.1%) |
| 80 to 84 Years | 0 (0.0%) | 0 (0.0%) |
| 85 Years and over | 0 (0.0%) | 0 (0.0%) |
| Total | 426 (100.0%) | 408 (100.0%) |
Families and Households in Chesterfield
Median Family Size in Chesterfield
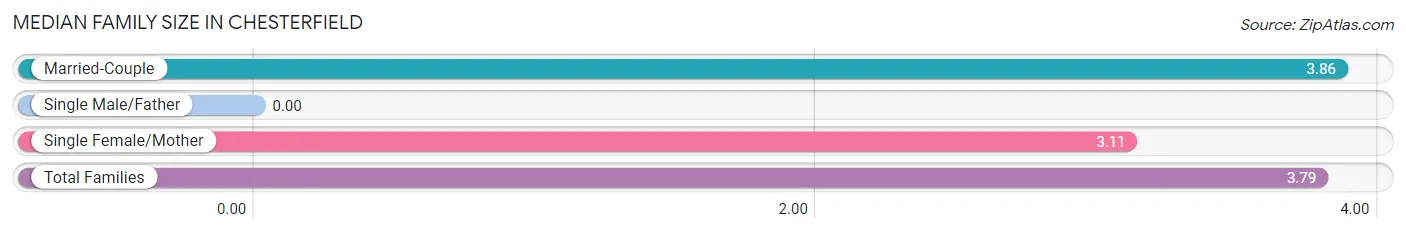
| Family Type | # Families | Family Size |
| Married-Couple | 196 (91.6%) | 3.86 |
| Single Male/Father | 0 (0.0%) | - |
| Single Female/Mother | 18 (8.4%) | 3.11 |
| Total Families | 214 (100.0%) | 3.79 |
Median Household Size in Chesterfield
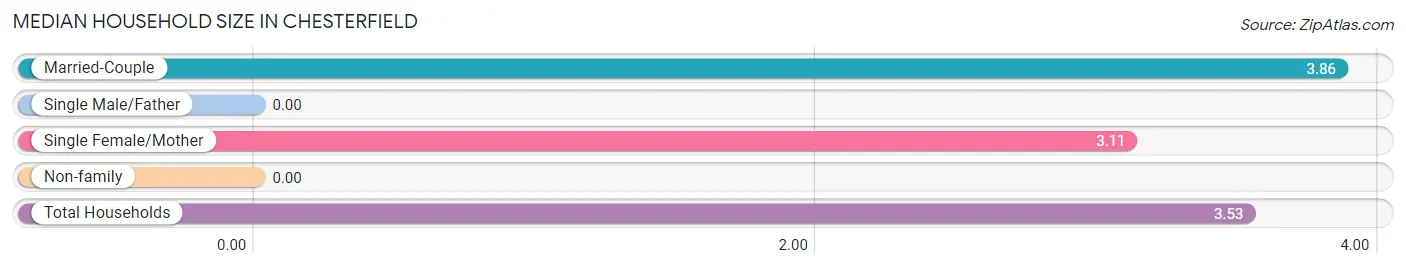
| Household Type | # Households | Household Size |
| Married-Couple | 196 (83.1%) | 3.86 |
| Single Male/Father | 0 (0.0%) | - |
| Single Female/Mother | 18 (7.6%) | 3.11 |
| Non-family | 22 (9.3%) | - |
| Total Households | 236 (100.0%) | 3.53 |
Household Size by Marriage Status in Chesterfield
Out of a total of 236 households in Chesterfield, 214 (90.7%) are family households, while 22 (9.3%) are nonfamily households. The most numerous type of family households are 3-person households, comprising 79, and the most common type of nonfamily households are 1-person households, comprising 22.
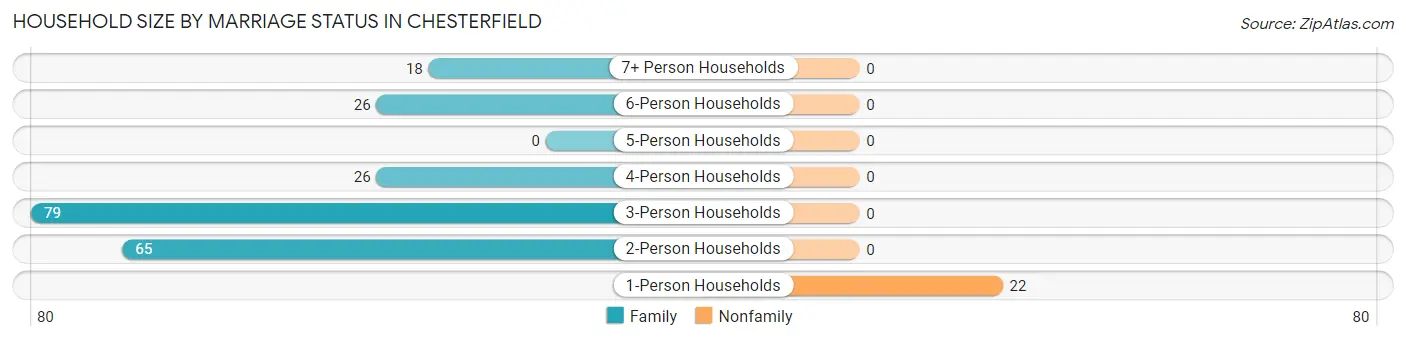
| Household Size | Family Households | Nonfamily Households |
| 1-Person Households | - | 22 (9.3%) |
| 2-Person Households | 65 (27.5%) | 0 (0.0%) |
| 3-Person Households | 79 (33.5%) | 0 (0.0%) |
| 4-Person Households | 26 (11.0%) | 0 (0.0%) |
| 5-Person Households | 0 (0.0%) | 0 (0.0%) |
| 6-Person Households | 26 (11.0%) | 0 (0.0%) |
| 7+ Person Households | 18 (7.6%) | 0 (0.0%) |
| Total | 214 (90.7%) | 22 (9.3%) |
Female Fertility in Chesterfield
Fertility by Age in Chesterfield
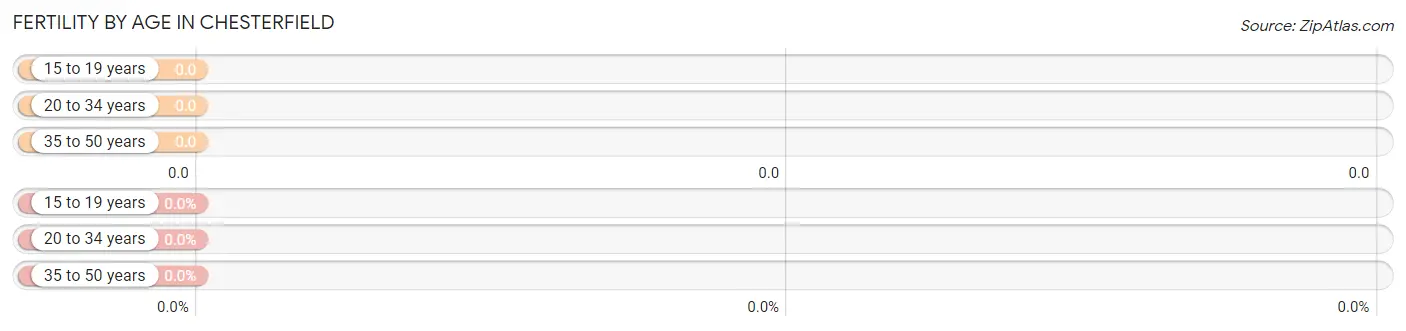
| Age Bracket | Women with Births | Births / 1,000 Women |
| 15 to 19 years | 0 (0.0%) | 0.0 |
| 20 to 34 years | 0 (0.0%) | 0.0 |
| 35 to 50 years | 0 (0.0%) | 0.0 |
| Total | 0 (0.0%) | 0.0 |
Fertility by Age by Marriage Status in Chesterfield
| Age Bracket | Married | Unmarried |
| 15 to 19 years | 0 (0.0%) | 0 (0.0%) |
| 20 to 34 years | 0 (0.0%) | 0 (0.0%) |
| 35 to 50 years | 0 (0.0%) | 0 (0.0%) |
| Total | 0 (0.0%) | 0 (0.0%) |
Fertility by Education in Chesterfield
| Educational Attainment | Women with Births | Births / 1,000 Women |
| Less than High School | 0 (0.0%) | 0.0 |
| High School Diploma | 0 (0.0%) | 0.0 |
| College or Associate's Degree | 0 (0.0%) | 0.0 |
| Bachelor's Degree | 0 (0.0%) | 0.0 |
| Graduate Degree | 0 (0.0%) | 0.0 |
| Total | 0 (0.0%) | 0.0 |
Fertility by Education by Marriage Status in Chesterfield
| Educational Attainment | Married | Unmarried |
| Less than High School | 0 (0.0%) | 0 (0.0%) |
| High School Diploma | 0 (0.0%) | 0 (0.0%) |
| College or Associate's Degree | 0 (0.0%) | 0 (0.0%) |
| Bachelor's Degree | 0 (0.0%) | 0 (0.0%) |
| Graduate Degree | 0 (0.0%) | 0 (0.0%) |
| Total | 0 (0.0%) | 0 (0.0%) |
Employment Characteristics in Chesterfield
Employment by Class of Employer in Chesterfield
Among the 348 employed individuals in Chesterfield, private company employees (208 | 59.8%), local government employees (106 | 30.5%), and self-employed (not incorporated) (23 | 6.6%) make up the most common classes of employment.
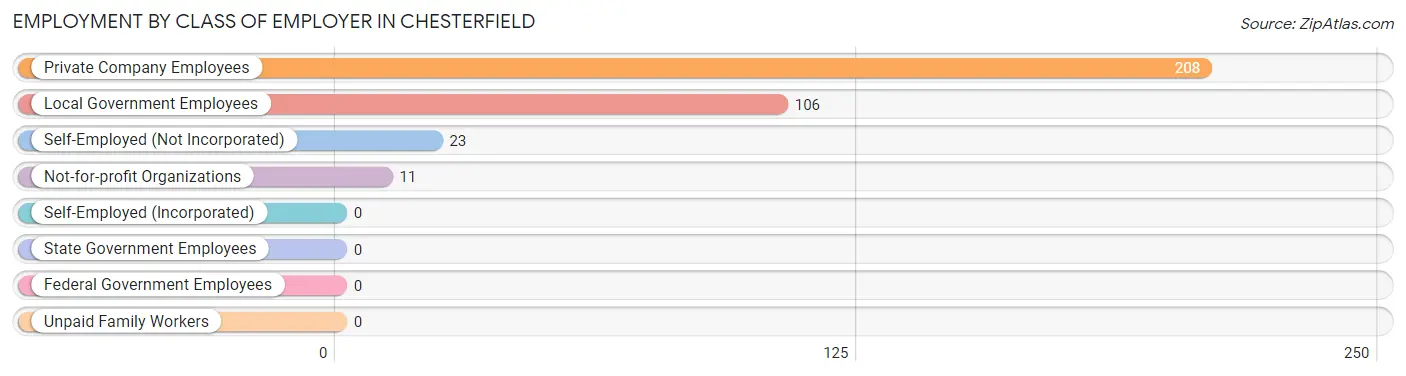
| Employer Class | # Employees | % Employees |
| Private Company Employees | 208 | 59.8% |
| Self-Employed (Incorporated) | 0 | 0.0% |
| Self-Employed (Not Incorporated) | 23 | 6.6% |
| Not-for-profit Organizations | 11 | 3.2% |
| Local Government Employees | 106 | 30.5% |
| State Government Employees | 0 | 0.0% |
| Federal Government Employees | 0 | 0.0% |
| Unpaid Family Workers | 0 | 0.0% |
| Total | 348 | 100.0% |
Employment Status by Age in Chesterfield
According to the labor force statistics for Chesterfield, out of the total population over 16 years of age (600), 65.3% or 392 individuals are in the labor force, with 11.2% or 44 of them unemployed. The age group with the highest labor force participation rate is 16 to 19 years, with 100.0% or 23 individuals in the labor force. Within the labor force, the 45 to 54 years age range has the highest percentage of unemployed individuals, with 34.4% or 44 of them being unemployed.
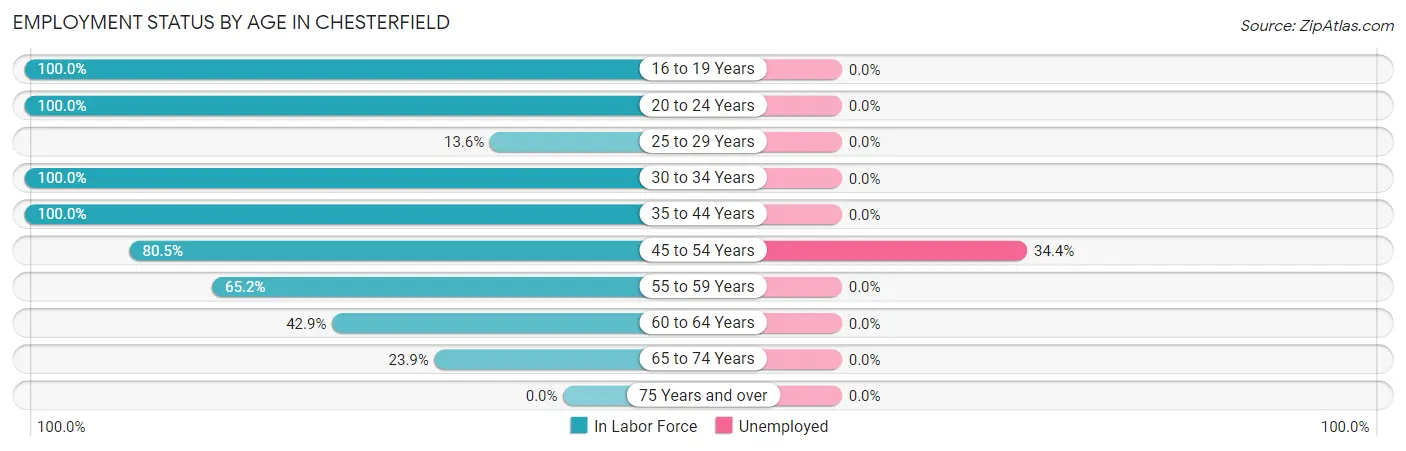
| Age Bracket | In Labor Force | Unemployed |
| 16 to 19 Years | 23 (100.0%) | 0 (0.0%) |
| 20 to 24 Years | 17 (100.0%) | 0 (0.0%) |
| 25 to 29 Years | 6 (13.6%) | 0 (0.0%) |
| 30 to 34 Years | 70 (100.0%) | 0 (0.0%) |
| 35 to 44 Years | 101 (100.0%) | 0 (0.0%) |
| 45 to 54 Years | 128 (80.5%) | 44 (34.4%) |
| 55 to 59 Years | 15 (65.2%) | 0 (0.0%) |
| 60 to 64 Years | 6 (42.9%) | 0 (0.0%) |
| 65 to 74 Years | 26 (23.9%) | 0 (0.0%) |
| 75 Years and over | 0 (0.0%) | 0 (0.0%) |
| Total | 392 (65.3%) | 44 (11.2%) |
Employment Status by Educational Attainment in Chesterfield
According to labor force statistics for Chesterfield, 79.3% of individuals (326) out of the total population between 25 and 64 years of age (411) are in the labor force, with 13.5% or 44 of them being unemployed. The group with the highest labor force participation rate are those with the educational attainment of less than high school, with 100.0% or 44 individuals in the labor force. Within the labor force, individuals with less than high school education have the highest percentage of unemployment, with 100.0% or 44 of them being unemployed.
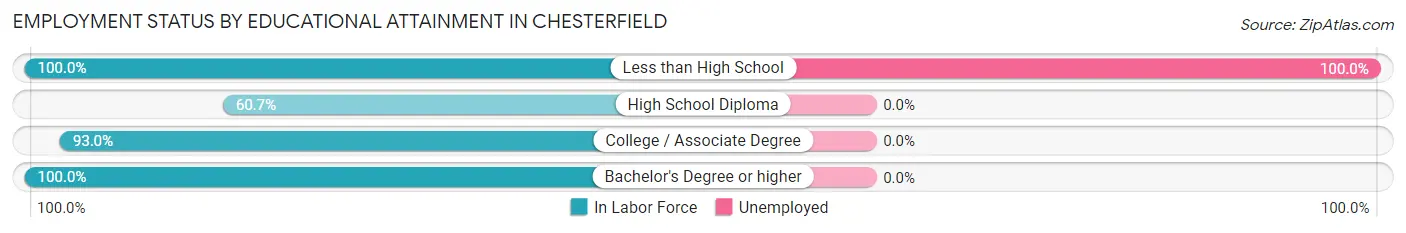
| Educational Attainment | In Labor Force | Unemployed |
| Less than High School | 44 (100.0%) | 44 (100.0%) |
| High School Diploma | 119 (60.7%) | 0 (0.0%) |
| College / Associate Degree | 106 (93.0%) | 0 (0.0%) |
| Bachelor's Degree or higher | 57 (100.0%) | 0 (0.0%) |
| Total | 326 (79.3%) | 55 (13.5%) |
Employment Occupations by Sex in Chesterfield
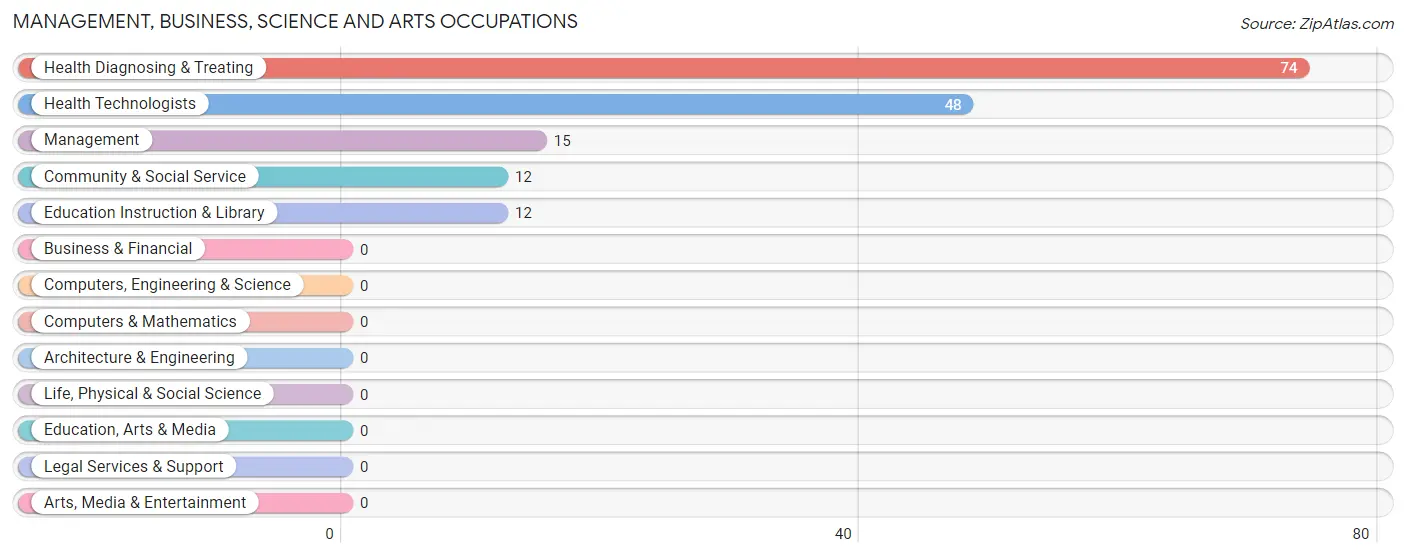
Management, Business, Science and Arts Occupations
The most common Management, Business, Science and Arts occupations in Chesterfield are Health Diagnosing & Treating (74 | 21.3%), Health Technologists (48 | 13.8%), Management (15 | 4.3%), Community & Social Service (12 | 3.5%), and Education Instruction & Library (12 | 3.5%).
Management, Business, Science and Arts Occupations by Sex
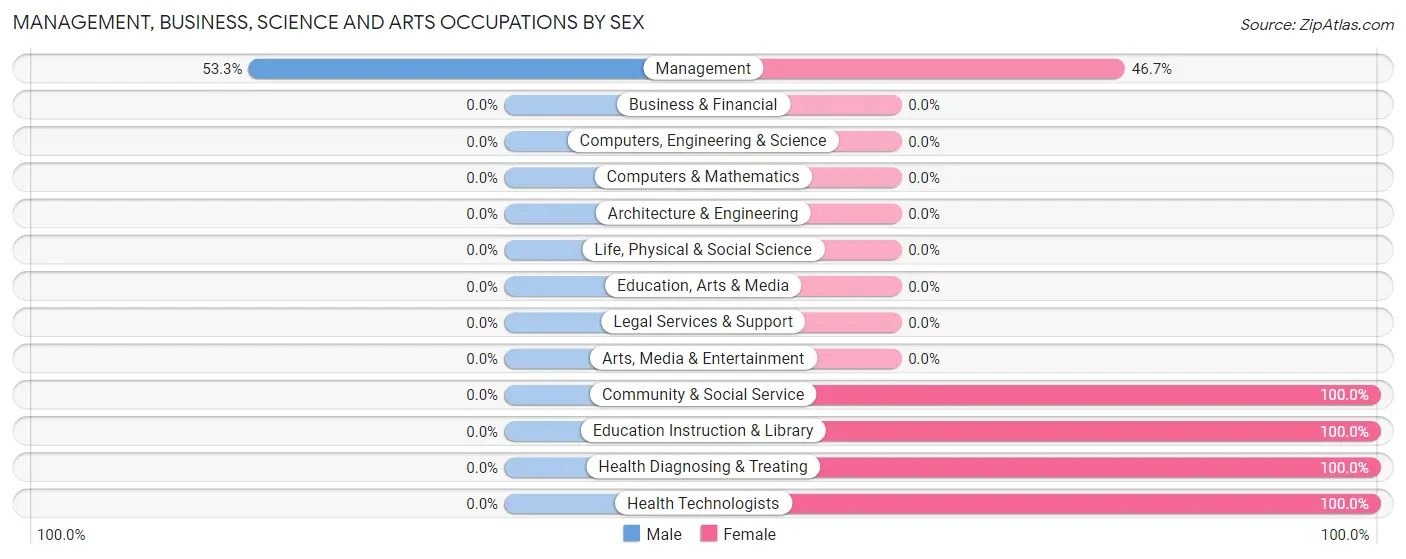
| Occupation | Male | Female |
| Management | 8 (53.3%) | 7 (46.7%) |
| Business & Financial | 0 (0.0%) | 0 (0.0%) |
| Computers, Engineering & Science | 0 (0.0%) | 0 (0.0%) |
| Computers & Mathematics | 0 (0.0%) | 0 (0.0%) |
| Architecture & Engineering | 0 (0.0%) | 0 (0.0%) |
| Life, Physical & Social Science | 0 (0.0%) | 0 (0.0%) |
| Community & Social Service | 0 (0.0%) | 12 (100.0%) |
| Education, Arts & Media | 0 (0.0%) | 0 (0.0%) |
| Legal Services & Support | 0 (0.0%) | 0 (0.0%) |
| Education Instruction & Library | 0 (0.0%) | 12 (100.0%) |
| Arts, Media & Entertainment | 0 (0.0%) | 0 (0.0%) |
| Health Diagnosing & Treating | 0 (0.0%) | 74 (100.0%) |
| Health Technologists | 0 (0.0%) | 48 (100.0%) |
| Total (Category) | 8 (7.9%) | 93 (92.1%) |
| Total (Overall) | 164 (47.1%) | 184 (52.9%) |
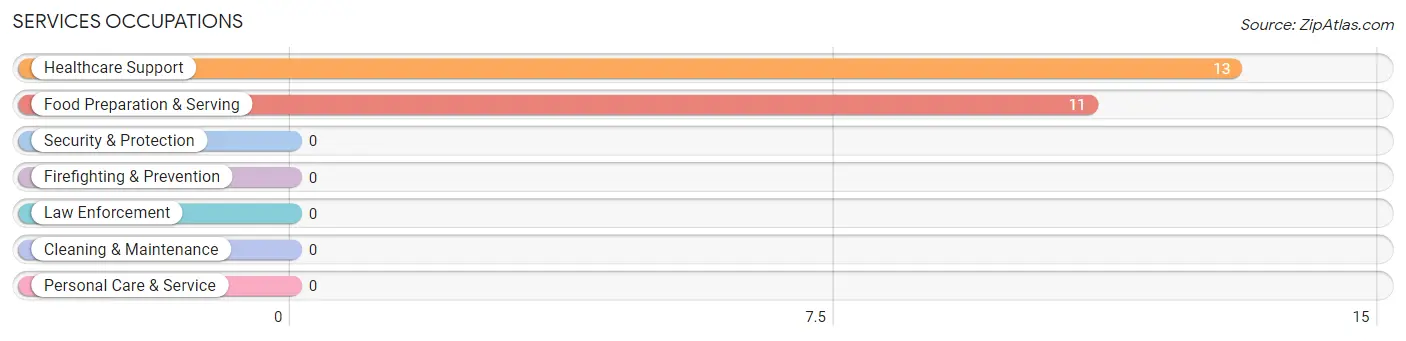
Services Occupations
The most common Services occupations in Chesterfield are Healthcare Support (13 | 3.7%), and Food Preparation & Serving (11 | 3.2%).
Services Occupations by Sex
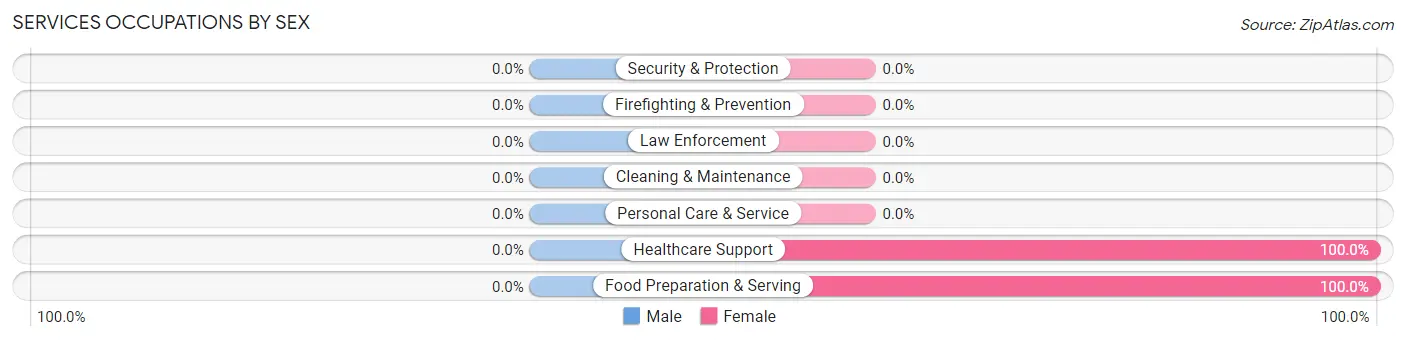
| Occupation | Male | Female |
| Healthcare Support | 0 (0.0%) | 13 (100.0%) |
| Security & Protection | 0 (0.0%) | 0 (0.0%) |
| Firefighting & Prevention | 0 (0.0%) | 0 (0.0%) |
| Law Enforcement | 0 (0.0%) | 0 (0.0%) |
| Food Preparation & Serving | 0 (0.0%) | 11 (100.0%) |
| Cleaning & Maintenance | 0 (0.0%) | 0 (0.0%) |
| Personal Care & Service | 0 (0.0%) | 0 (0.0%) |
| Total (Category) | 0 (0.0%) | 24 (100.0%) |
| Total (Overall) | 164 (47.1%) | 184 (52.9%) |
Sales and Office Occupations
The most common Sales and Office occupations in Chesterfield are Sales & Related (53 | 15.2%), and Office & Administration (12 | 3.5%).
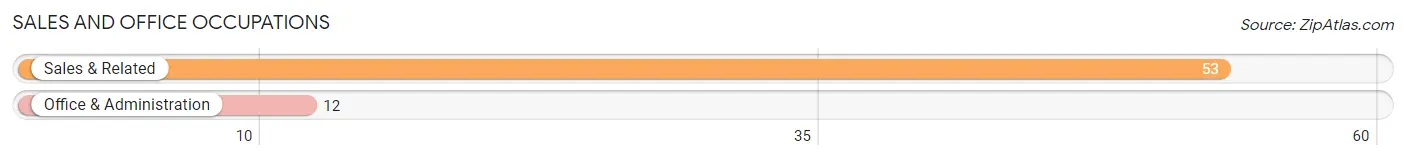
Sales and Office Occupations by Sex
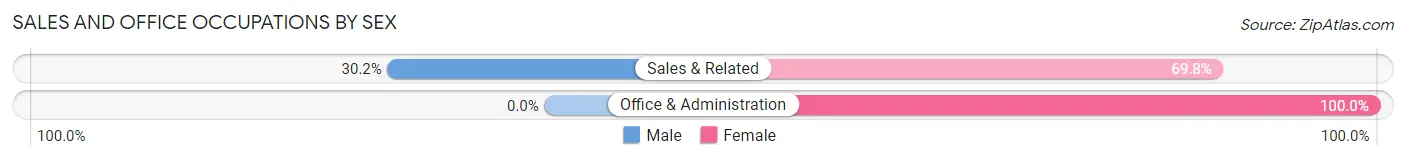
| Occupation | Male | Female |
| Sales & Related | 16 (30.2%) | 37 (69.8%) |
| Office & Administration | 0 (0.0%) | 12 (100.0%) |
| Total (Category) | 16 (24.6%) | 49 (75.4%) |
| Total (Overall) | 164 (47.1%) | 184 (52.9%) |
Natural Resources, Construction and Maintenance Occupations
The most common Natural Resources, Construction and Maintenance occupations in Chesterfield are , and Installation, Maintenance & Repair (69 | 19.8%).
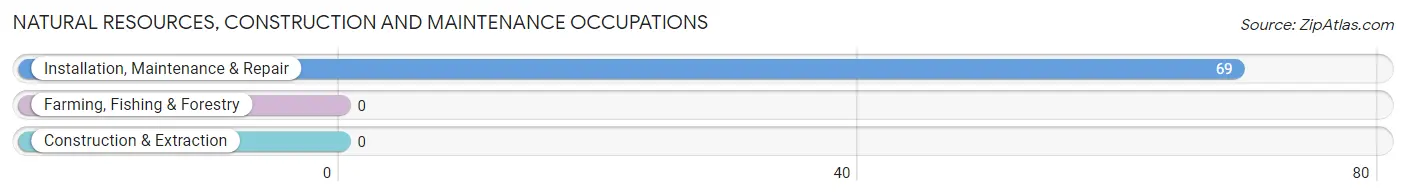
Natural Resources, Construction and Maintenance Occupations by Sex
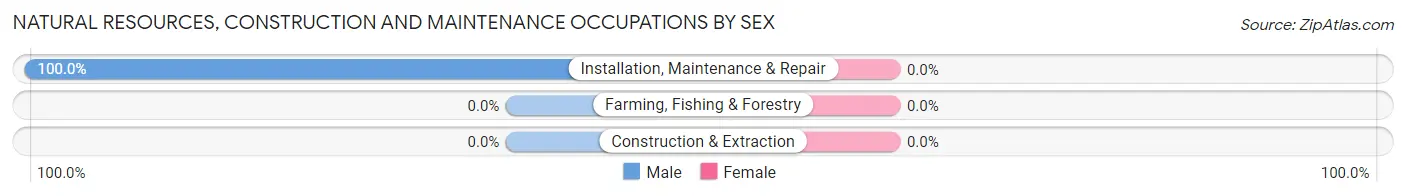
| Occupation | Male | Female |
| Farming, Fishing & Forestry | 0 (0.0%) | 0 (0.0%) |
| Construction & Extraction | 0 (0.0%) | 0 (0.0%) |
| Installation, Maintenance & Repair | 69 (100.0%) | 0 (0.0%) |
| Total (Category) | 69 (100.0%) | 0 (0.0%) |
| Total (Overall) | 164 (47.1%) | 184 (52.9%) |
Production, Transportation and Moving Occupations
The most common Production, Transportation and Moving occupations in Chesterfield are Transportation (38 | 10.9%), Production (35 | 10.1%), and Material Moving (16 | 4.6%).
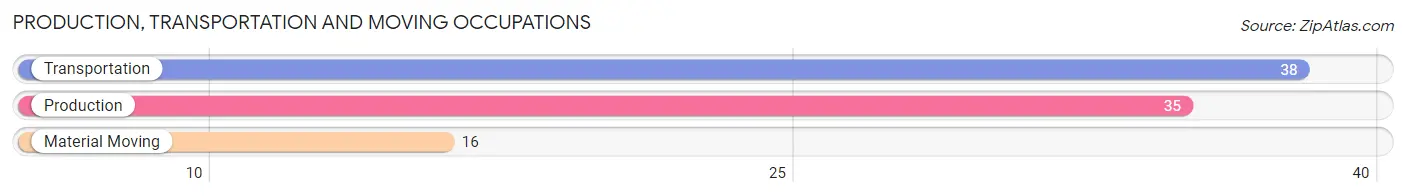
Production, Transportation and Moving Occupations by Sex
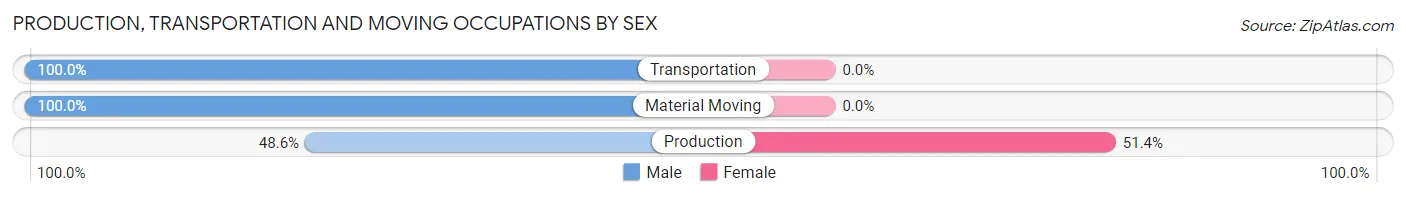
| Occupation | Male | Female |
| Production | 17 (48.6%) | 18 (51.4%) |
| Transportation | 38 (100.0%) | 0 (0.0%) |
| Material Moving | 16 (100.0%) | 0 (0.0%) |
| Total (Category) | 71 (79.8%) | 18 (20.2%) |
| Total (Overall) | 164 (47.1%) | 184 (52.9%) |
Employment Industries by Sex in Chesterfield
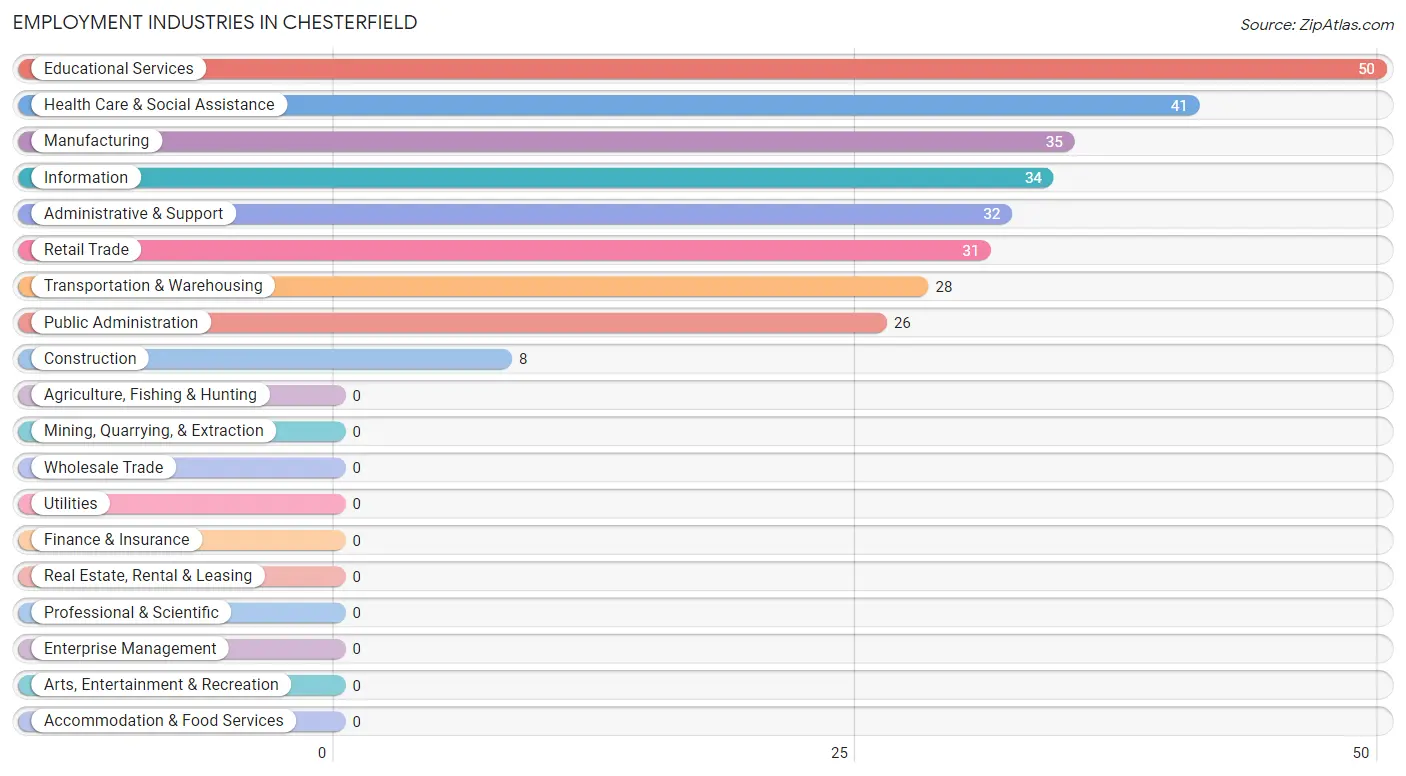
Employment Industries in Chesterfield
The major employment industries in Chesterfield include Educational Services (50 | 14.4%), Health Care & Social Assistance (41 | 11.8%), Manufacturing (35 | 10.1%), Information (34 | 9.8%), and Administrative & Support (32 | 9.2%).
Employment Industries by Sex in Chesterfield
The Chesterfield industries that see more men than women are Construction (100.0%), Transportation & Warehousing (100.0%), and Information (100.0%), whereas the industries that tend to have a higher number of women are Retail Trade (100.0%), Educational Services (100.0%), and Health Care & Social Assistance (100.0%).
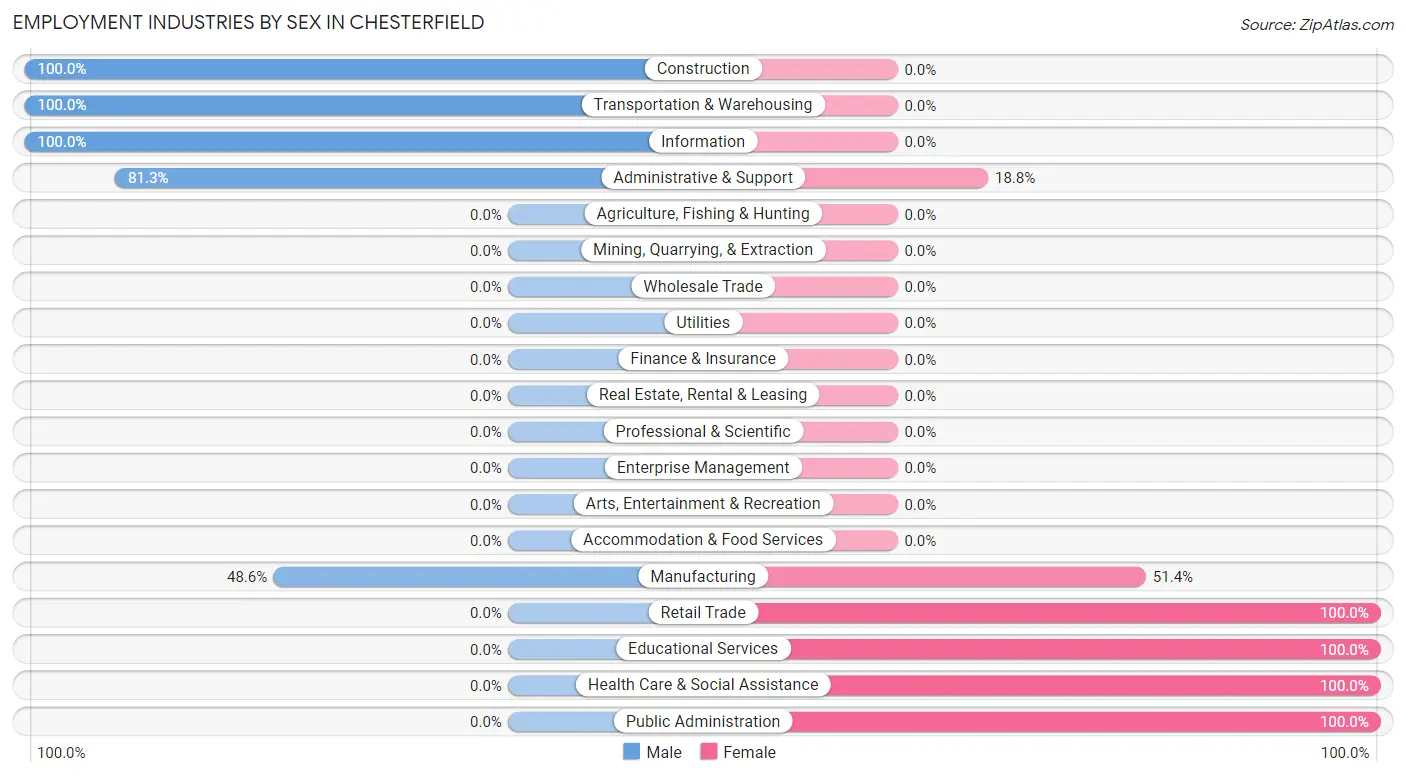
| Industry | Male | Female |
| Agriculture, Fishing & Hunting | 0 (0.0%) | 0 (0.0%) |
| Mining, Quarrying, & Extraction | 0 (0.0%) | 0 (0.0%) |
| Construction | 8 (100.0%) | 0 (0.0%) |
| Manufacturing | 17 (48.6%) | 18 (51.4%) |
| Wholesale Trade | 0 (0.0%) | 0 (0.0%) |
| Retail Trade | 0 (0.0%) | 31 (100.0%) |
| Transportation & Warehousing | 28 (100.0%) | 0 (0.0%) |
| Utilities | 0 (0.0%) | 0 (0.0%) |
| Information | 34 (100.0%) | 0 (0.0%) |
| Finance & Insurance | 0 (0.0%) | 0 (0.0%) |
| Real Estate, Rental & Leasing | 0 (0.0%) | 0 (0.0%) |
| Professional & Scientific | 0 (0.0%) | 0 (0.0%) |
| Enterprise Management | 0 (0.0%) | 0 (0.0%) |
| Administrative & Support | 26 (81.2%) | 6 (18.8%) |
| Educational Services | 0 (0.0%) | 50 (100.0%) |
| Health Care & Social Assistance | 0 (0.0%) | 41 (100.0%) |
| Arts, Entertainment & Recreation | 0 (0.0%) | 0 (0.0%) |
| Accommodation & Food Services | 0 (0.0%) | 0 (0.0%) |
| Public Administration | 0 (0.0%) | 26 (100.0%) |
| Total | 164 (47.1%) | 184 (52.9%) |
Education in Chesterfield
School Enrollment in Chesterfield
The most common levels of schooling among the 301 students in Chesterfield are elementary school (118 | 39.2%), middle school (94 | 31.2%), and college / undergraduate (26 | 8.6%).
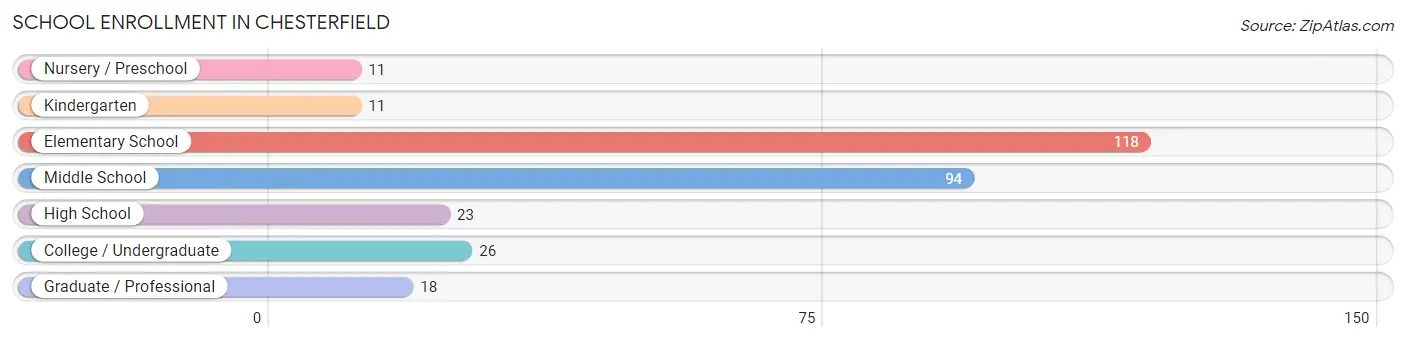
| School Level | # Students | % Students |
| Nursery / Preschool | 11 | 3.6% |
| Kindergarten | 11 | 3.6% |
| Elementary School | 118 | 39.2% |
| Middle School | 94 | 31.2% |
| High School | 23 | 7.6% |
| College / Undergraduate | 26 | 8.6% |
| Graduate / Professional | 18 | 6.0% |
| Total | 301 | 100.0% |
School Enrollment by Age by Funding Source in Chesterfield
Out of a total of 301 students who are enrolled in schools in Chesterfield, 26 (8.6%) attend a private institution, while the remaining 275 (91.4%) are enrolled in public schools. The age group of 25 to 34 year olds has the highest likelihood of being enrolled in private schools, with 26 (100.0% in the age bracket) enrolled. Conversely, the age group of 5 to 9 year old has the lowest likelihood of being enrolled in a private school, with 140 (100.0% in the age bracket) attending a public institution.
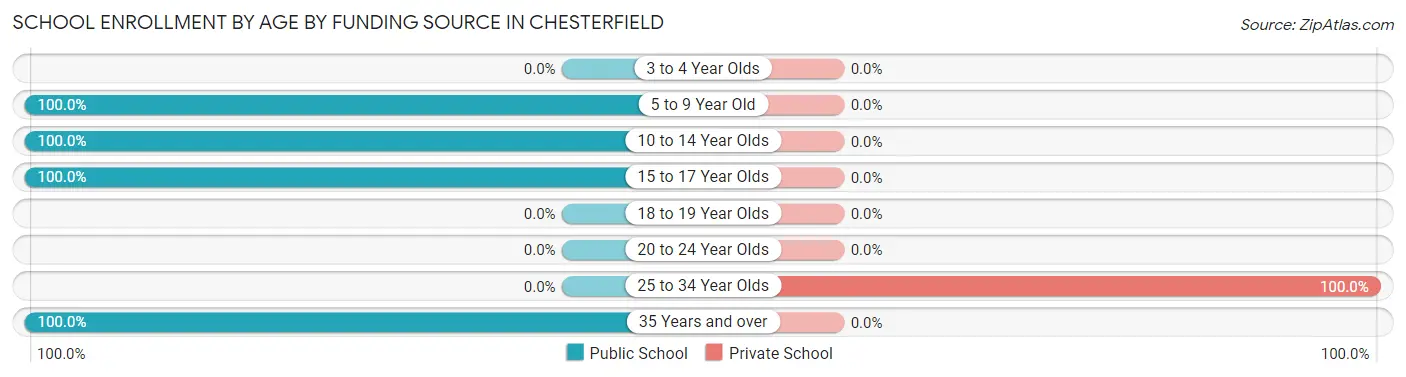
| Age Bracket | Public School | Private School |
| 3 to 4 Year Olds | 0 (0.0%) | 0 (0.0%) |
| 5 to 9 Year Old | 140 (100.0%) | 0 (0.0%) |
| 10 to 14 Year Olds | 94 (100.0%) | 0 (0.0%) |
| 15 to 17 Year Olds | 23 (100.0%) | 0 (0.0%) |
| 18 to 19 Year Olds | 0 (0.0%) | 0 (0.0%) |
| 20 to 24 Year Olds | 0 (0.0%) | 0 (0.0%) |
| 25 to 34 Year Olds | 0 (0.0%) | 26 (100.0%) |
| 35 Years and over | 18 (100.0%) | 0 (0.0%) |
| Total | 275 (91.4%) | 26 (8.6%) |
Educational Attainment by Field of Study in Chesterfield
Education (39 | 55.7%), science & technology (17 | 24.3%), business (8 | 11.4%), and bio, nature & agricultural (6 | 8.6%) are the most common fields of study among 70 individuals in Chesterfield who have obtained a bachelor's degree or higher.
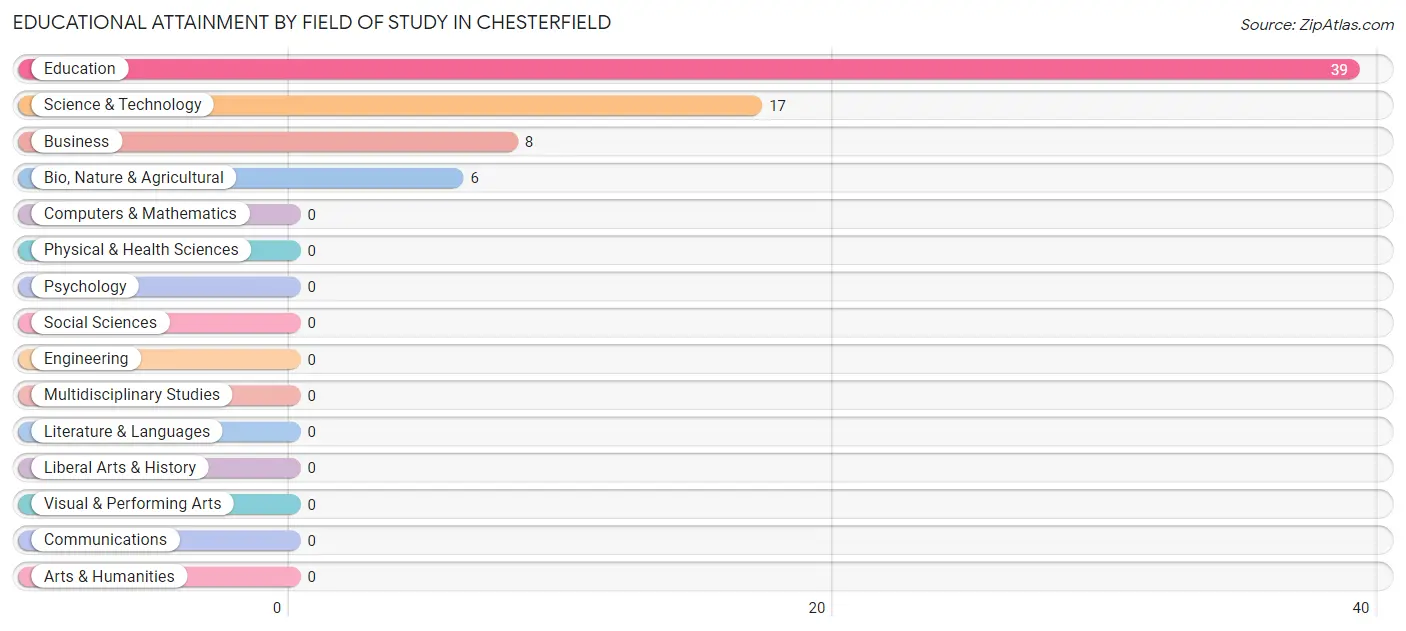
| Field of Study | # Graduates | % Graduates |
| Computers & Mathematics | 0 | 0.0% |
| Bio, Nature & Agricultural | 6 | 8.6% |
| Physical & Health Sciences | 0 | 0.0% |
| Psychology | 0 | 0.0% |
| Social Sciences | 0 | 0.0% |
| Engineering | 0 | 0.0% |
| Multidisciplinary Studies | 0 | 0.0% |
| Science & Technology | 17 | 24.3% |
| Business | 8 | 11.4% |
| Education | 39 | 55.7% |
| Literature & Languages | 0 | 0.0% |
| Liberal Arts & History | 0 | 0.0% |
| Visual & Performing Arts | 0 | 0.0% |
| Communications | 0 | 0.0% |
| Arts & Humanities | 0 | 0.0% |
| Total | 70 | 100.0% |
Transportation & Commute in Chesterfield
Vehicle Availability by Sex in Chesterfield
The most prevalent vehicle ownership categories in Chesterfield are males with 3 vehicles (63, accounting for 38.4%) and females with 3 vehicles (50, making up 34.2%).
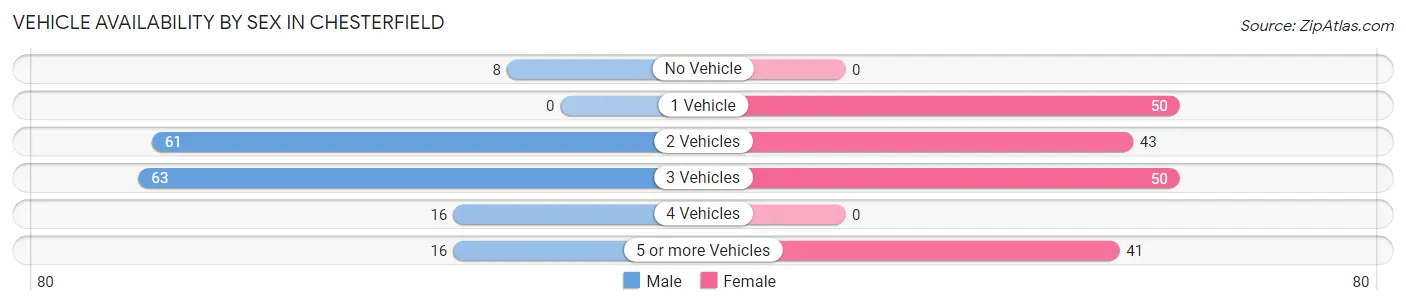
| Vehicles Available | Male | Female |
| No Vehicle | 8 (4.9%) | 0 (0.0%) |
| 1 Vehicle | 0 (0.0%) | 50 (27.2%) |
| 2 Vehicles | 61 (37.2%) | 43 (23.4%) |
| 3 Vehicles | 63 (38.4%) | 50 (27.2%) |
| 4 Vehicles | 16 (9.8%) | 0 (0.0%) |
| 5 or more Vehicles | 16 (9.8%) | 41 (22.3%) |
| Total | 164 (100.0%) | 184 (100.0%) |
Commute Time in Chesterfield
The most frequently occuring commute durations in Chesterfield are 10 to 14 minutes (67 commuters, 19.3%), 20 to 24 minutes (58 commuters, 16.7%), and 15 to 19 minutes (57 commuters, 16.4%).
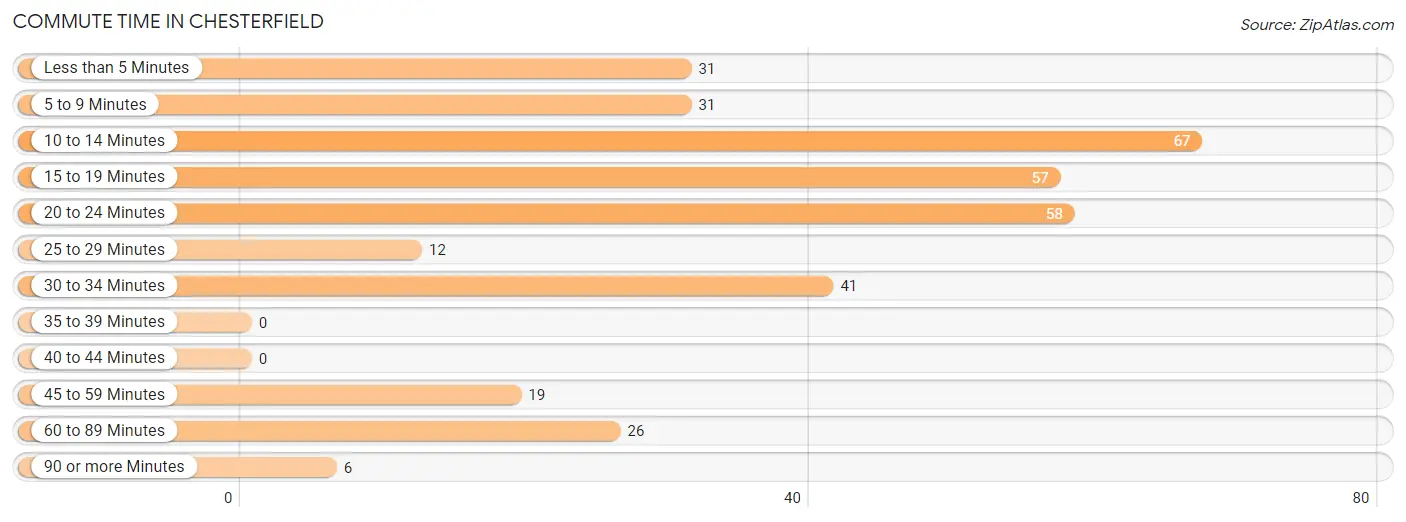
| Commute Time | # Commuters | % Commuters |
| Less than 5 Minutes | 31 | 8.9% |
| 5 to 9 Minutes | 31 | 8.9% |
| 10 to 14 Minutes | 67 | 19.3% |
| 15 to 19 Minutes | 57 | 16.4% |
| 20 to 24 Minutes | 58 | 16.7% |
| 25 to 29 Minutes | 12 | 3.5% |
| 30 to 34 Minutes | 41 | 11.8% |
| 35 to 39 Minutes | 0 | 0.0% |
| 40 to 44 Minutes | 0 | 0.0% |
| 45 to 59 Minutes | 19 | 5.5% |
| 60 to 89 Minutes | 26 | 7.5% |
| 90 or more Minutes | 6 | 1.7% |
Commute Time by Sex in Chesterfield
The most common commute times in Chesterfield are 10 to 14 minutes (67 commuters, 40.8%) for males and 20 to 24 minutes (36 commuters, 19.6%) for females.
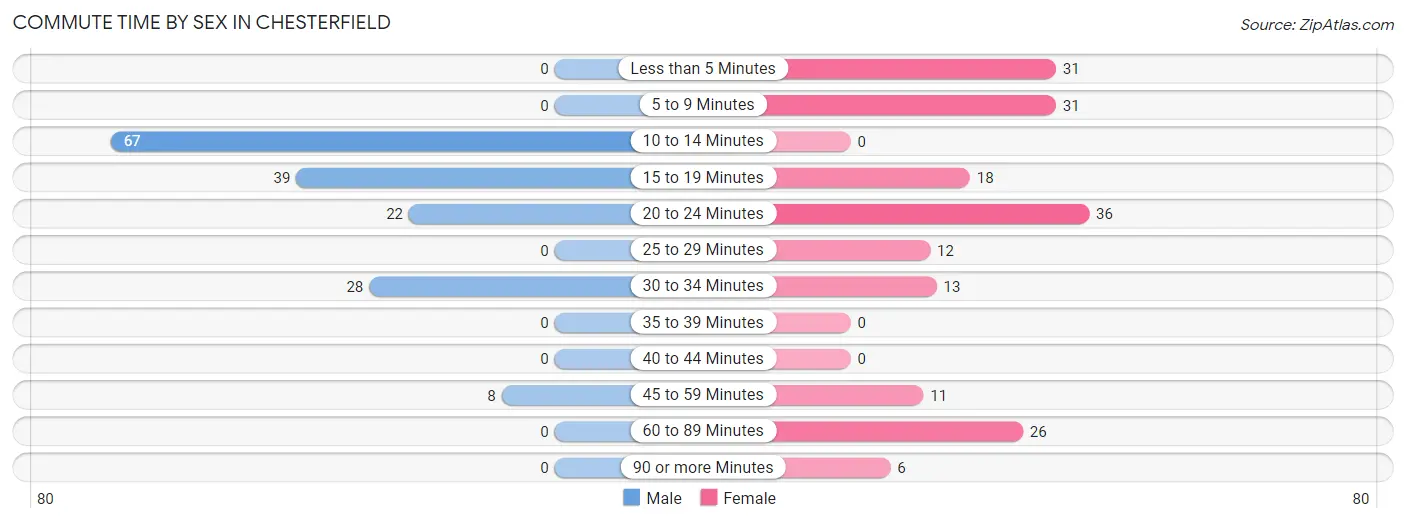
| Commute Time | Male | Female |
| Less than 5 Minutes | 0 (0.0%) | 31 (16.9%) |
| 5 to 9 Minutes | 0 (0.0%) | 31 (16.9%) |
| 10 to 14 Minutes | 67 (40.8%) | 0 (0.0%) |
| 15 to 19 Minutes | 39 (23.8%) | 18 (9.8%) |
| 20 to 24 Minutes | 22 (13.4%) | 36 (19.6%) |
| 25 to 29 Minutes | 0 (0.0%) | 12 (6.5%) |
| 30 to 34 Minutes | 28 (17.1%) | 13 (7.1%) |
| 35 to 39 Minutes | 0 (0.0%) | 0 (0.0%) |
| 40 to 44 Minutes | 0 (0.0%) | 0 (0.0%) |
| 45 to 59 Minutes | 8 (4.9%) | 11 (6.0%) |
| 60 to 89 Minutes | 0 (0.0%) | 26 (14.1%) |
| 90 or more Minutes | 0 (0.0%) | 6 (3.3%) |
Time of Departure to Work by Sex in Chesterfield
The most frequent times of departure to work in Chesterfield are 6:30 AM to 6:59 AM (80, 48.8%) for males and 12:00 AM to 4:59 AM (49, 26.6%) for females.
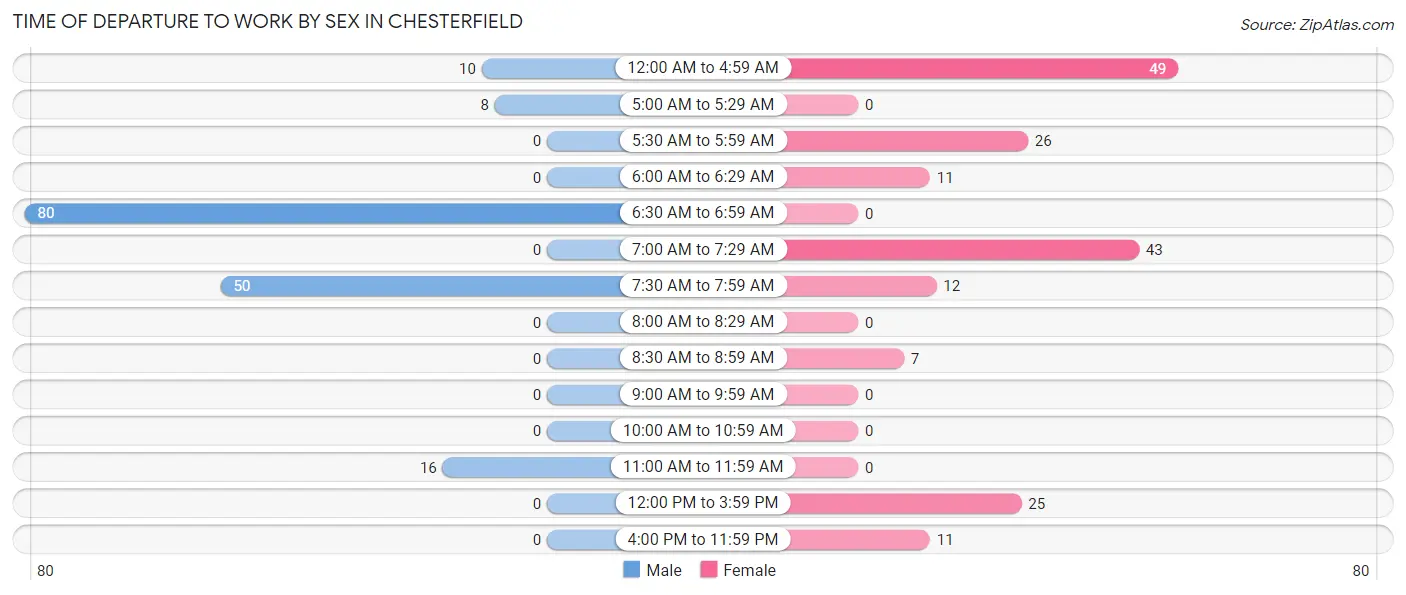
| Time of Departure | Male | Female |
| 12:00 AM to 4:59 AM | 10 (6.1%) | 49 (26.6%) |
| 5:00 AM to 5:29 AM | 8 (4.9%) | 0 (0.0%) |
| 5:30 AM to 5:59 AM | 0 (0.0%) | 26 (14.1%) |
| 6:00 AM to 6:29 AM | 0 (0.0%) | 11 (6.0%) |
| 6:30 AM to 6:59 AM | 80 (48.8%) | 0 (0.0%) |
| 7:00 AM to 7:29 AM | 0 (0.0%) | 43 (23.4%) |
| 7:30 AM to 7:59 AM | 50 (30.5%) | 12 (6.5%) |
| 8:00 AM to 8:29 AM | 0 (0.0%) | 0 (0.0%) |
| 8:30 AM to 8:59 AM | 0 (0.0%) | 7 (3.8%) |
| 9:00 AM to 9:59 AM | 0 (0.0%) | 0 (0.0%) |
| 10:00 AM to 10:59 AM | 0 (0.0%) | 0 (0.0%) |
| 11:00 AM to 11:59 AM | 16 (9.8%) | 0 (0.0%) |
| 12:00 PM to 3:59 PM | 0 (0.0%) | 25 (13.6%) |
| 4:00 PM to 11:59 PM | 0 (0.0%) | 11 (6.0%) |
| Total | 164 (100.0%) | 184 (100.0%) |
Housing Occupancy in Chesterfield
Occupancy by Ownership in Chesterfield
Of the total 236 dwellings in Chesterfield, owner-occupied units account for 182 (77.1%), while renter-occupied units make up 54 (22.9%).
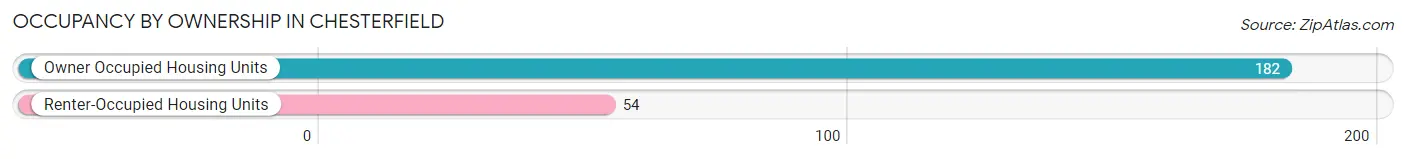
| Occupancy | # Housing Units | % Housing Units |
| Owner Occupied Housing Units | 182 | 77.1% |
| Renter-Occupied Housing Units | 54 | 22.9% |
| Total Occupied Housing Units | 236 | 100.0% |
Occupancy by Household Size in Chesterfield
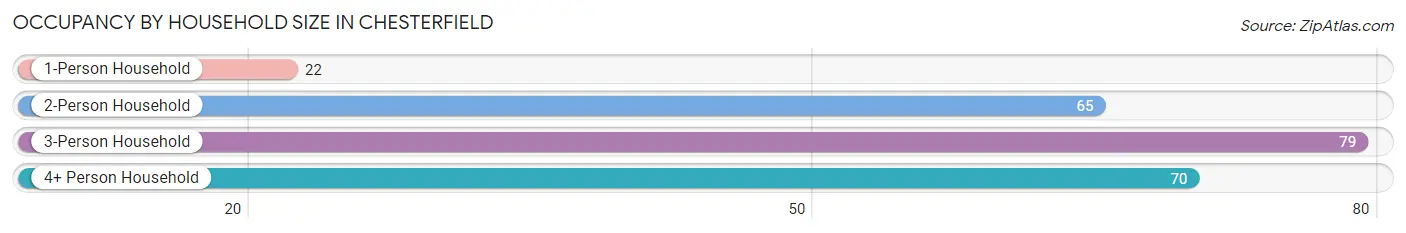
| Household Size | # Housing Units | % Housing Units |
| 1-Person Household | 22 | 9.3% |
| 2-Person Household | 65 | 27.5% |
| 3-Person Household | 79 | 33.5% |
| 4+ Person Household | 70 | 29.7% |
| Total Housing Units | 236 | 100.0% |
Occupancy by Ownership by Household Size in Chesterfield
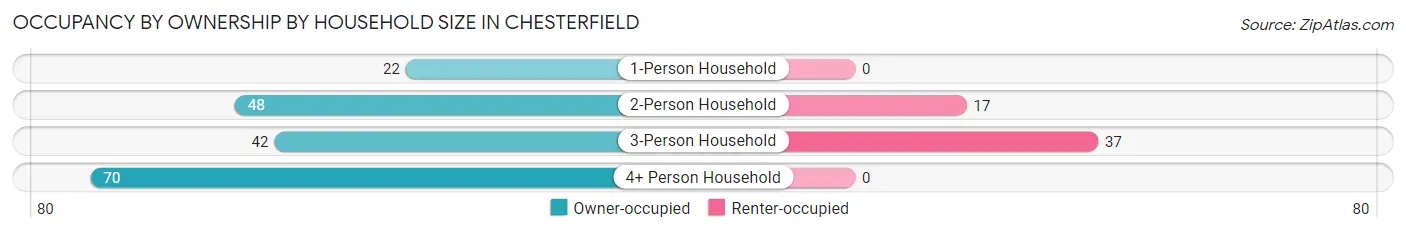
| Household Size | Owner-occupied | Renter-occupied |
| 1-Person Household | 22 (100.0%) | 0 (0.0%) |
| 2-Person Household | 48 (73.9%) | 17 (26.2%) |
| 3-Person Household | 42 (53.2%) | 37 (46.8%) |
| 4+ Person Household | 70 (100.0%) | 0 (0.0%) |
| Total Housing Units | 182 (77.1%) | 54 (22.9%) |
Occupancy by Educational Attainment in Chesterfield
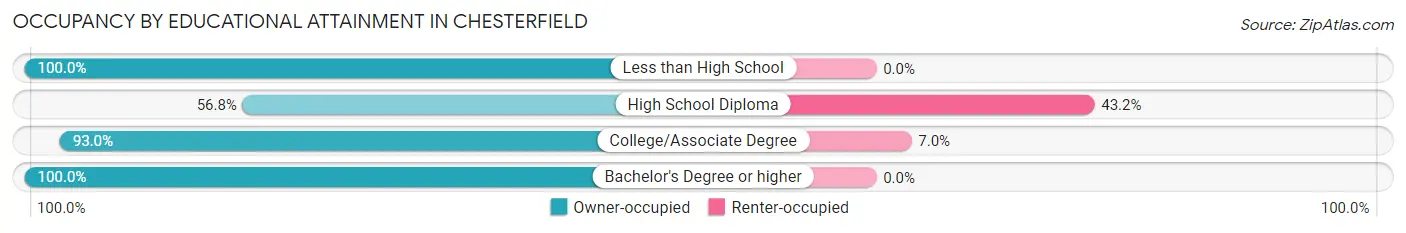
| Household Size | Owner-occupied | Renter-occupied |
| Less than High School | 10 (100.0%) | 0 (0.0%) |
| High School Diploma | 63 (56.8%) | 48 (43.2%) |
| College/Associate Degree | 80 (93.0%) | 6 (7.0%) |
| Bachelor's Degree or higher | 29 (100.0%) | 0 (0.0%) |
Occupancy by Age of Householder in Chesterfield
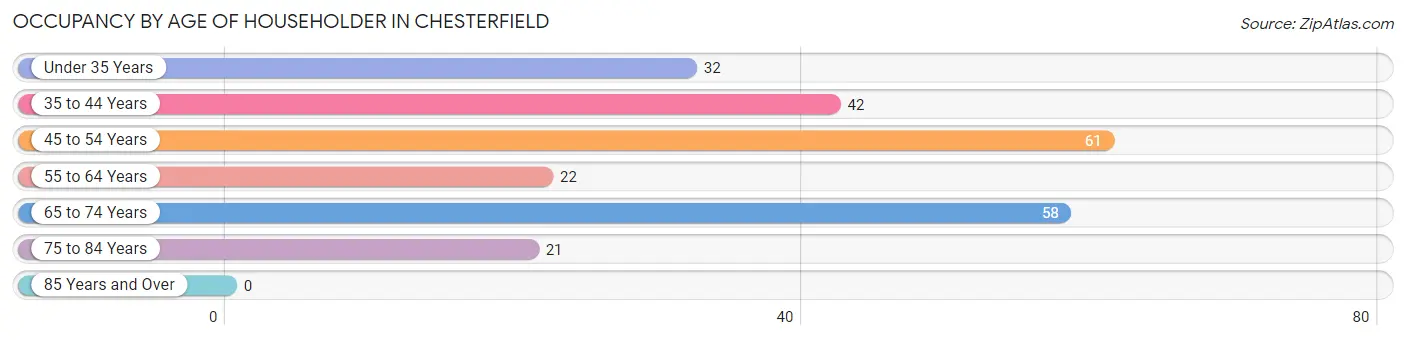
| Age Bracket | # Households | % Households |
| Under 35 Years | 32 | 13.6% |
| 35 to 44 Years | 42 | 17.8% |
| 45 to 54 Years | 61 | 25.9% |
| 55 to 64 Years | 22 | 9.3% |
| 65 to 74 Years | 58 | 24.6% |
| 75 to 84 Years | 21 | 8.9% |
| 85 Years and Over | 0 | 0.0% |
| Total | 236 | 100.0% |
Housing Finances in Chesterfield
Median Income by Occupancy in Chesterfield
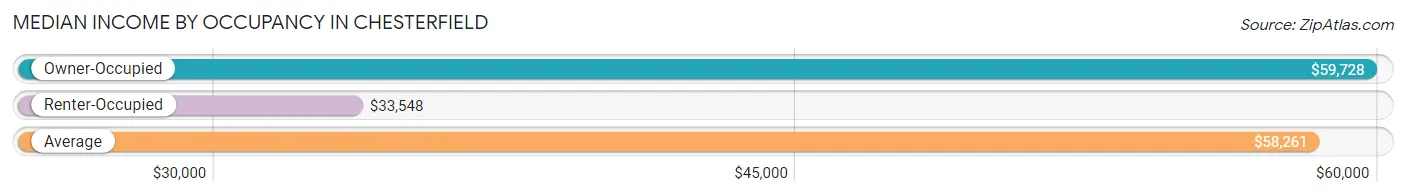
| Occupancy Type | # Households | Median Income |
| Owner-Occupied | 182 (77.1%) | $59,728 |
| Renter-Occupied | 54 (22.9%) | $33,548 |
| Average | 236 (100.0%) | $58,261 |
Occupancy by Householder Income Bracket in Chesterfield
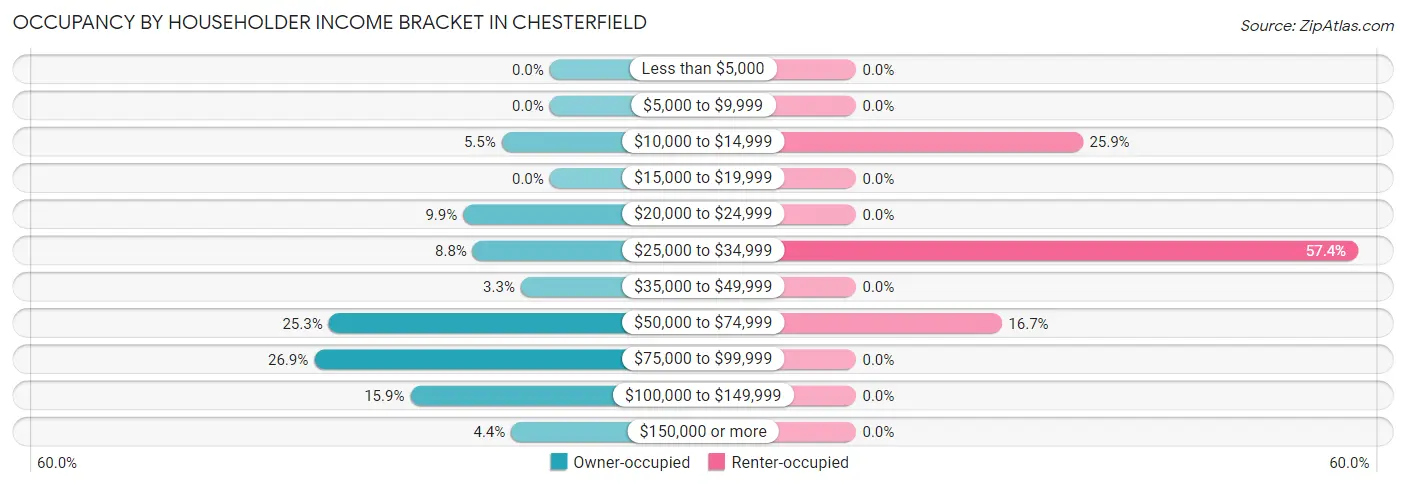
| Income Bracket | Owner-occupied | Renter-occupied |
| Less than $5,000 | 0 (0.0%) | 0 (0.0%) |
| $5,000 to $9,999 | 0 (0.0%) | 0 (0.0%) |
| $10,000 to $14,999 | 10 (5.5%) | 14 (25.9%) |
| $15,000 to $19,999 | 0 (0.0%) | 0 (0.0%) |
| $20,000 to $24,999 | 18 (9.9%) | 0 (0.0%) |
| $25,000 to $34,999 | 16 (8.8%) | 31 (57.4%) |
| $35,000 to $49,999 | 6 (3.3%) | 0 (0.0%) |
| $50,000 to $74,999 | 46 (25.3%) | 9 (16.7%) |
| $75,000 to $99,999 | 49 (26.9%) | 0 (0.0%) |
| $100,000 to $149,999 | 29 (15.9%) | 0 (0.0%) |
| $150,000 or more | 8 (4.4%) | 0 (0.0%) |
| Total | 182 (100.0%) | 54 (100.0%) |
Monthly Housing Cost Tiers in Chesterfield
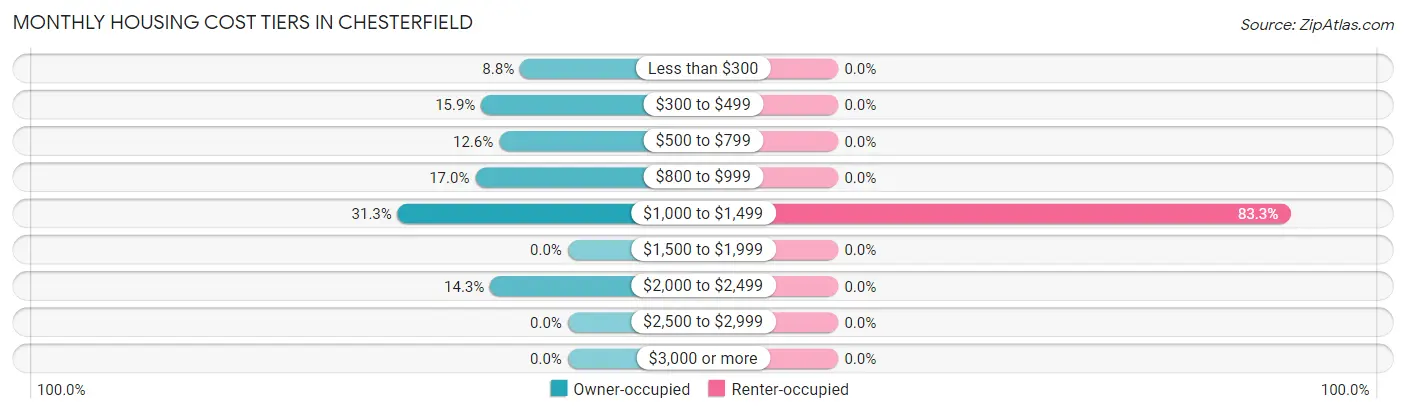
| Monthly Cost | Owner-occupied | Renter-occupied |
| Less than $300 | 16 (8.8%) | 0 (0.0%) |
| $300 to $499 | 29 (15.9%) | 0 (0.0%) |
| $500 to $799 | 23 (12.6%) | 0 (0.0%) |
| $800 to $999 | 31 (17.0%) | 0 (0.0%) |
| $1,000 to $1,499 | 57 (31.3%) | 45 (83.3%) |
| $1,500 to $1,999 | 0 (0.0%) | 0 (0.0%) |
| $2,000 to $2,499 | 26 (14.3%) | 0 (0.0%) |
| $2,500 to $2,999 | 0 (0.0%) | 0 (0.0%) |
| $3,000 or more | 0 (0.0%) | 0 (0.0%) |
| Total | 182 (100.0%) | 54 (100.0%) |
Physical Housing Characteristics in Chesterfield
Housing Structures in Chesterfield
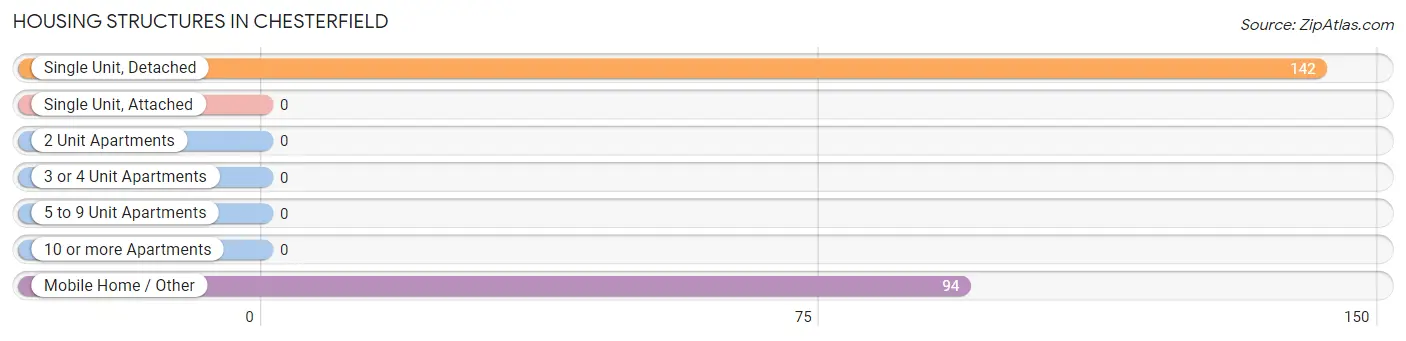
| Structure Type | # Housing Units | % Housing Units |
| Single Unit, Detached | 142 | 60.2% |
| Single Unit, Attached | 0 | 0.0% |
| 2 Unit Apartments | 0 | 0.0% |
| 3 or 4 Unit Apartments | 0 | 0.0% |
| 5 to 9 Unit Apartments | 0 | 0.0% |
| 10 or more Apartments | 0 | 0.0% |
| Mobile Home / Other | 94 | 39.8% |
| Total | 236 | 100.0% |
Housing Structures by Occupancy in Chesterfield
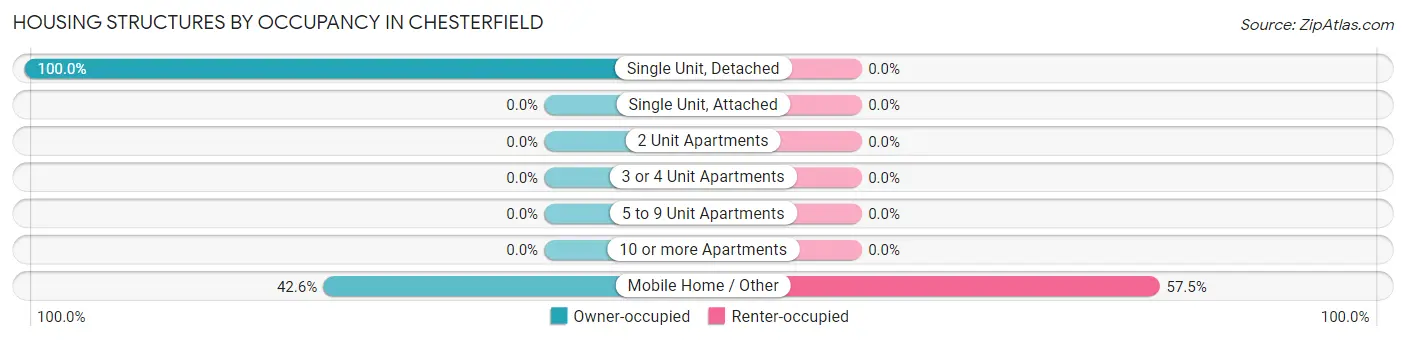
| Structure Type | Owner-occupied | Renter-occupied |
| Single Unit, Detached | 142 (100.0%) | 0 (0.0%) |
| Single Unit, Attached | 0 (0.0%) | 0 (0.0%) |
| 2 Unit Apartments | 0 (0.0%) | 0 (0.0%) |
| 3 or 4 Unit Apartments | 0 (0.0%) | 0 (0.0%) |
| 5 to 9 Unit Apartments | 0 (0.0%) | 0 (0.0%) |
| 10 or more Apartments | 0 (0.0%) | 0 (0.0%) |
| Mobile Home / Other | 40 (42.5%) | 54 (57.5%) |
| Total | 182 (77.1%) | 54 (22.9%) |
Housing Structures by Number of Rooms in Chesterfield
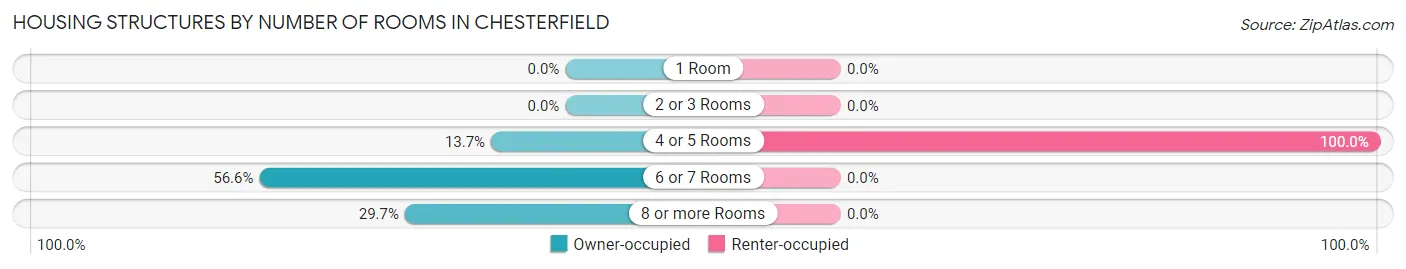
| Number of Rooms | Owner-occupied | Renter-occupied |
| 1 Room | 0 (0.0%) | 0 (0.0%) |
| 2 or 3 Rooms | 0 (0.0%) | 0 (0.0%) |
| 4 or 5 Rooms | 25 (13.7%) | 54 (100.0%) |
| 6 or 7 Rooms | 103 (56.6%) | 0 (0.0%) |
| 8 or more Rooms | 54 (29.7%) | 0 (0.0%) |
| Total | 182 (100.0%) | 54 (100.0%) |
Housing Structure by Heating Type in Chesterfield
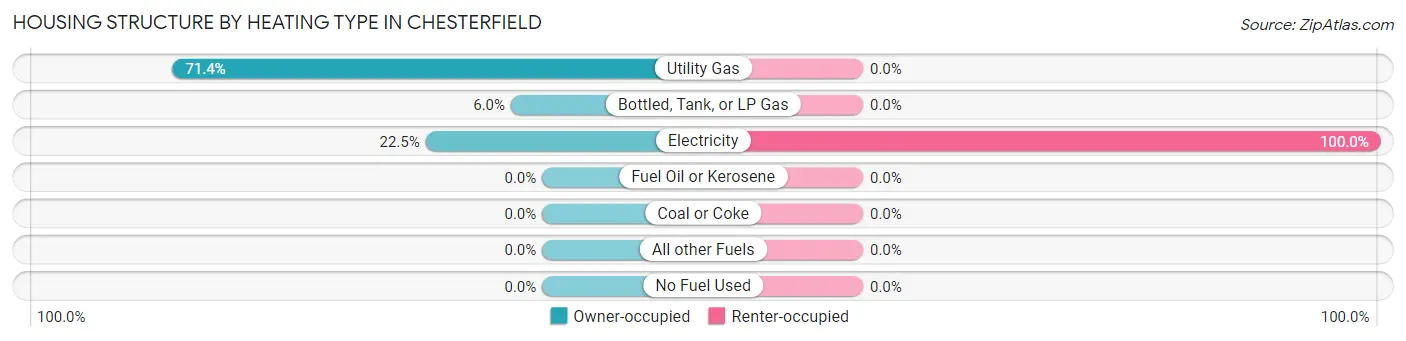
| Heating Type | Owner-occupied | Renter-occupied |
| Utility Gas | 130 (71.4%) | 0 (0.0%) |
| Bottled, Tank, or LP Gas | 11 (6.0%) | 0 (0.0%) |
| Electricity | 41 (22.5%) | 54 (100.0%) |
| Fuel Oil or Kerosene | 0 (0.0%) | 0 (0.0%) |
| Coal or Coke | 0 (0.0%) | 0 (0.0%) |
| All other Fuels | 0 (0.0%) | 0 (0.0%) |
| No Fuel Used | 0 (0.0%) | 0 (0.0%) |
| Total | 182 (100.0%) | 54 (100.0%) |
Household Vehicle Usage in Chesterfield
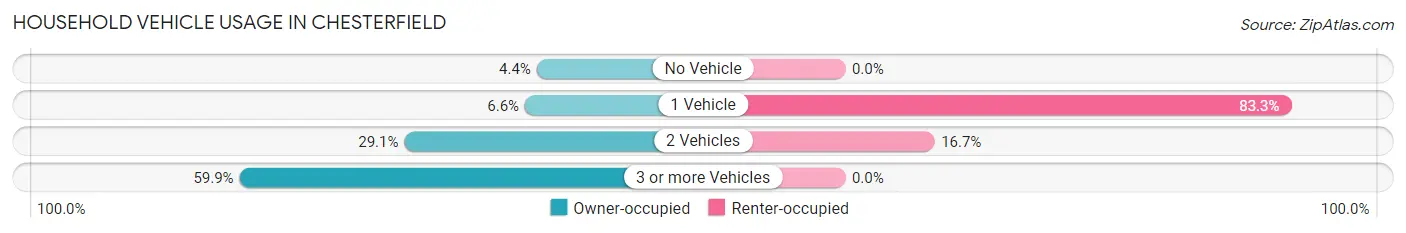
| Vehicles per Household | Owner-occupied | Renter-occupied |
| No Vehicle | 8 (4.4%) | 0 (0.0%) |
| 1 Vehicle | 12 (6.6%) | 45 (83.3%) |
| 2 Vehicles | 53 (29.1%) | 9 (16.7%) |
| 3 or more Vehicles | 109 (59.9%) | 0 (0.0%) |
| Total | 182 (100.0%) | 54 (100.0%) |
Real Estate & Mortgages in Chesterfield
Real Estate and Mortgage Overview in Chesterfield
| Characteristic | Without Mortgage | With Mortgage |
| Housing Units | 68 | 114 |
| Median Property Value | $181,500 | $186,400 |
| Median Household Income | - | - |
| Monthly Housing Costs | $435 | $0 |
| Real Estate Taxes | - | - |
Property Value by Mortgage Status in Chesterfield
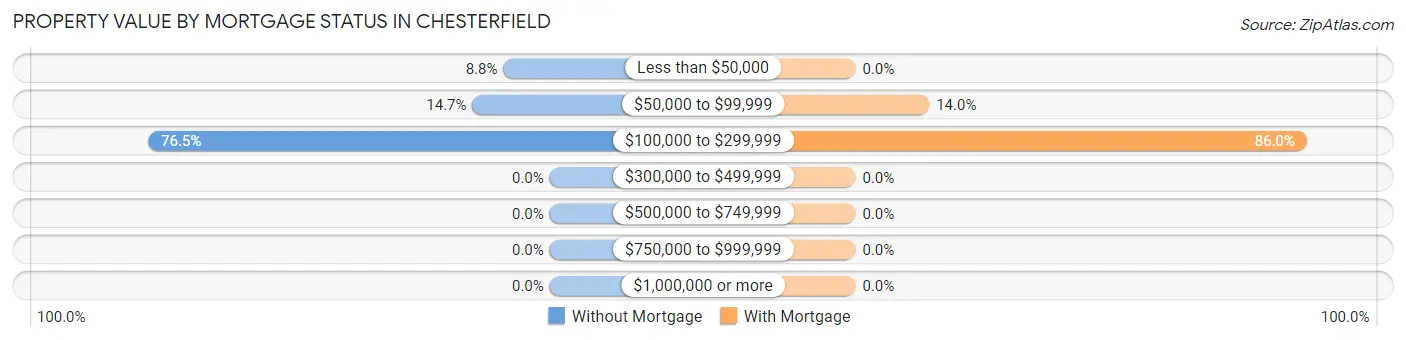
| Property Value | Without Mortgage | With Mortgage |
| Less than $50,000 | 6 (8.8%) | 0 (0.0%) |
| $50,000 to $99,999 | 10 (14.7%) | 16 (14.0%) |
| $100,000 to $299,999 | 52 (76.5%) | 98 (86.0%) |
| $300,000 to $499,999 | 0 (0.0%) | 0 (0.0%) |
| $500,000 to $749,999 | 0 (0.0%) | 0 (0.0%) |
| $750,000 to $999,999 | 0 (0.0%) | 0 (0.0%) |
| $1,000,000 or more | 0 (0.0%) | 0 (0.0%) |
| Total | 68 (100.0%) | 114 (100.0%) |
Household Income by Mortgage Status in Chesterfield
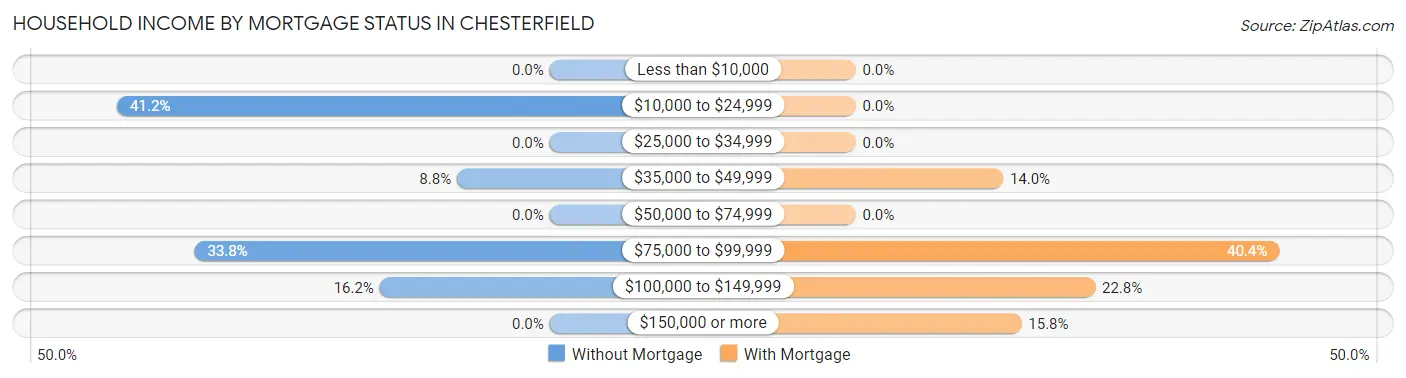
| Household Income | Without Mortgage | With Mortgage |
| Less than $10,000 | 0 (0.0%) | 0 (0.0%) |
| $10,000 to $24,999 | 28 (41.2%) | 0 (0.0%) |
| $25,000 to $34,999 | 0 (0.0%) | 0 (0.0%) |
| $35,000 to $49,999 | 6 (8.8%) | 16 (14.0%) |
| $50,000 to $74,999 | 0 (0.0%) | 0 (0.0%) |
| $75,000 to $99,999 | 23 (33.8%) | 46 (40.4%) |
| $100,000 to $149,999 | 11 (16.2%) | 26 (22.8%) |
| $150,000 or more | 0 (0.0%) | 18 (15.8%) |
| Total | 68 (100.0%) | 114 (100.0%) |
Property Value to Household Income Ratio in Chesterfield
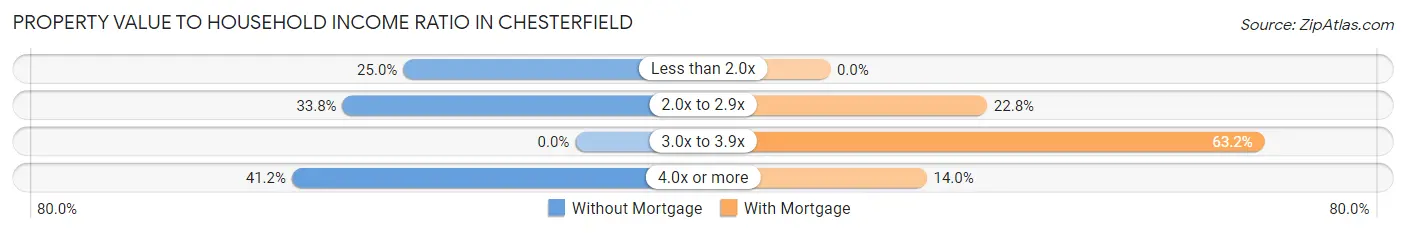
| Value-to-Income Ratio | Without Mortgage | With Mortgage |
| Less than 2.0x | 17 (25.0%) | 0 (0.0%) |
| 2.0x to 2.9x | 23 (33.8%) | 26 (22.8%) |
| 3.0x to 3.9x | 0 (0.0%) | 72 (63.2%) |
| 4.0x or more | 28 (41.2%) | 16 (14.0%) |
| Total | 68 (100.0%) | 114 (100.0%) |
Real Estate Taxes by Mortgage Status in Chesterfield
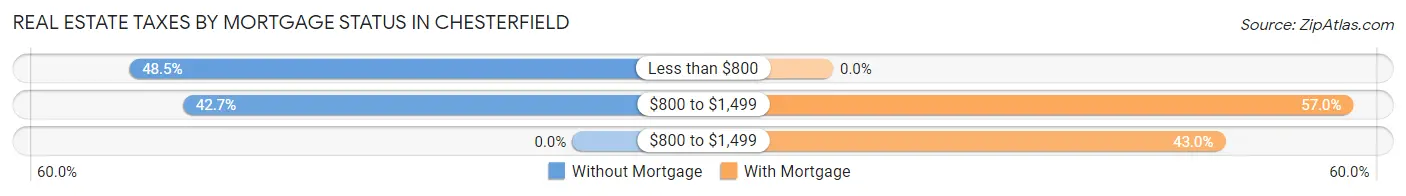
| Property Taxes | Without Mortgage | With Mortgage |
| Less than $800 | 33 (48.5%) | 0 (0.0%) |
| $800 to $1,499 | 29 (42.6%) | 65 (57.0%) |
| $800 to $1,499 | 0 (0.0%) | 49 (43.0%) |
| Total | 68 (100.0%) | 114 (100.0%) |
Health & Disability in Chesterfield
Health Insurance Coverage by Age in Chesterfield
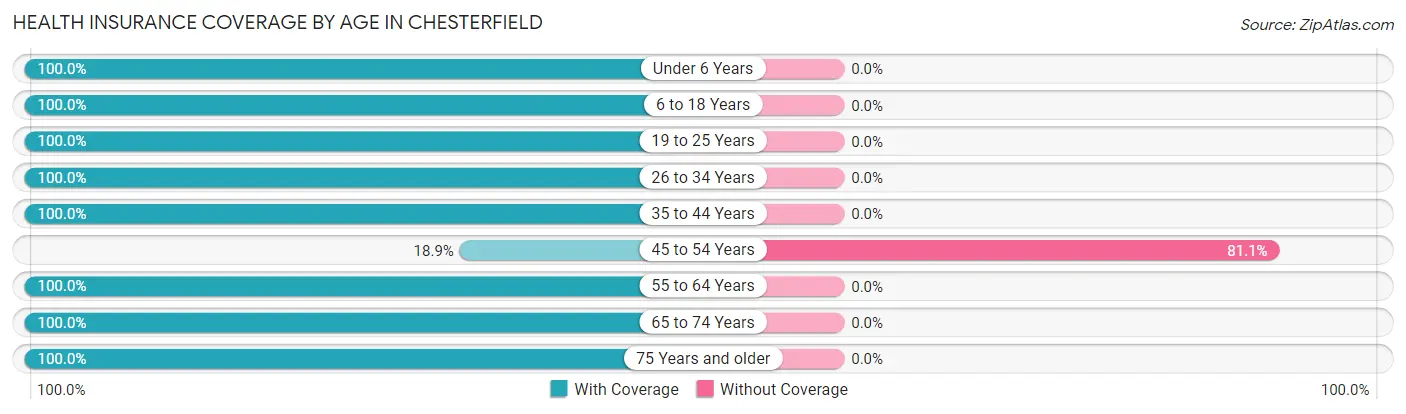
| Age Bracket | With Coverage | Without Coverage |
| Under 6 Years | 11 (100.0%) | 0 (0.0%) |
| 6 to 18 Years | 246 (100.0%) | 0 (0.0%) |
| 19 to 25 Years | 17 (100.0%) | 0 (0.0%) |
| 26 to 34 Years | 114 (100.0%) | 0 (0.0%) |
| 35 to 44 Years | 101 (100.0%) | 0 (0.0%) |
| 45 to 54 Years | 30 (18.9%) | 129 (81.1%) |
| 55 to 64 Years | 37 (100.0%) | 0 (0.0%) |
| 65 to 74 Years | 109 (100.0%) | 0 (0.0%) |
| 75 Years and older | 40 (100.0%) | 0 (0.0%) |
| Total | 705 (84.5%) | 129 (15.5%) |
Health Insurance Coverage by Citizenship Status in Chesterfield
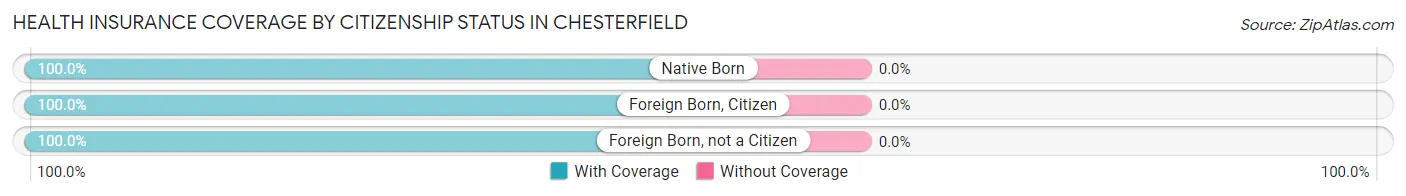
| Citizenship Status | With Coverage | Without Coverage |
| Native Born | 11 (100.0%) | 0 (0.0%) |
| Foreign Born, Citizen | 246 (100.0%) | 0 (0.0%) |
| Foreign Born, not a Citizen | 17 (100.0%) | 0 (0.0%) |
Health Insurance Coverage by Household Income in Chesterfield
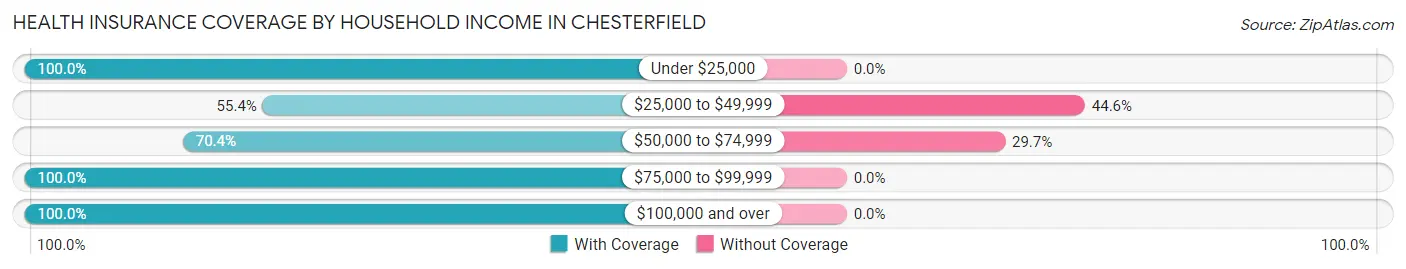
| Household Income | With Coverage | Without Coverage |
| Under $25,000 | 89 (100.0%) | 0 (0.0%) |
| $25,000 to $49,999 | 77 (55.4%) | 62 (44.6%) |
| $50,000 to $74,999 | 159 (70.4%) | 67 (29.6%) |
| $75,000 to $99,999 | 237 (100.0%) | 0 (0.0%) |
| $100,000 and over | 143 (100.0%) | 0 (0.0%) |
Public vs Private Health Insurance Coverage by Age in Chesterfield
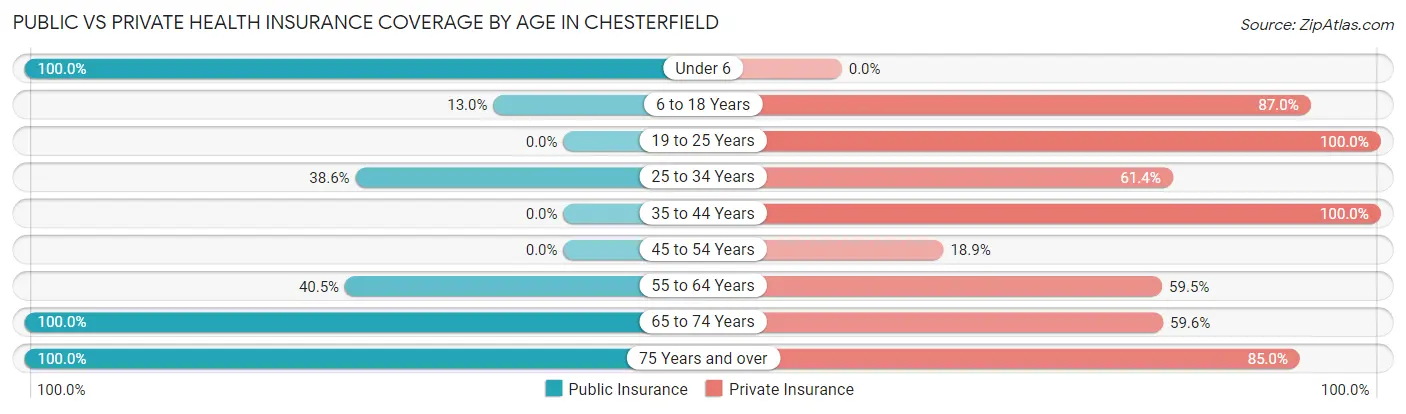
| Age Bracket | Public Insurance | Private Insurance |
| Under 6 | 11 (100.0%) | 0 (0.0%) |
| 6 to 18 Years | 32 (13.0%) | 214 (87.0%) |
| 19 to 25 Years | 0 (0.0%) | 17 (100.0%) |
| 25 to 34 Years | 44 (38.6%) | 70 (61.4%) |
| 35 to 44 Years | 0 (0.0%) | 101 (100.0%) |
| 45 to 54 Years | 0 (0.0%) | 30 (18.9%) |
| 55 to 64 Years | 15 (40.5%) | 22 (59.5%) |
| 65 to 74 Years | 109 (100.0%) | 65 (59.6%) |
| 75 Years and over | 40 (100.0%) | 34 (85.0%) |
| Total | 251 (30.1%) | 553 (66.3%) |
Disability Status by Sex by Age in Chesterfield
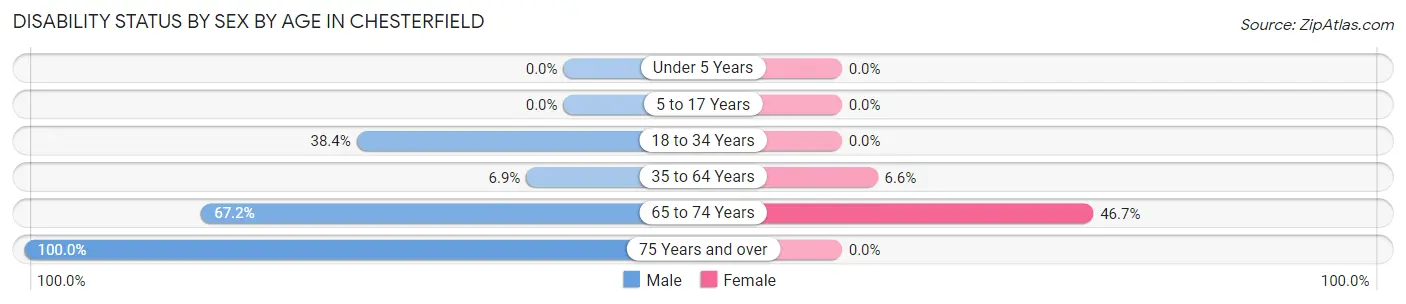
| Age Bracket | Male | Female |
| Under 5 Years | 0 (0.0%) | 0 (0.0%) |
| 5 to 17 Years | 0 (0.0%) | 0 (0.0%) |
| 18 to 34 Years | 38 (38.4%) | 0 (0.0%) |
| 35 to 64 Years | 8 (6.9%) | 12 (6.6%) |
| 65 to 74 Years | 43 (67.2%) | 21 (46.7%) |
| 75 Years and over | 19 (100.0%) | 0 (0.0%) |
Disability Class by Sex by Age in Chesterfield
Disability Class: Hearing Difficulty
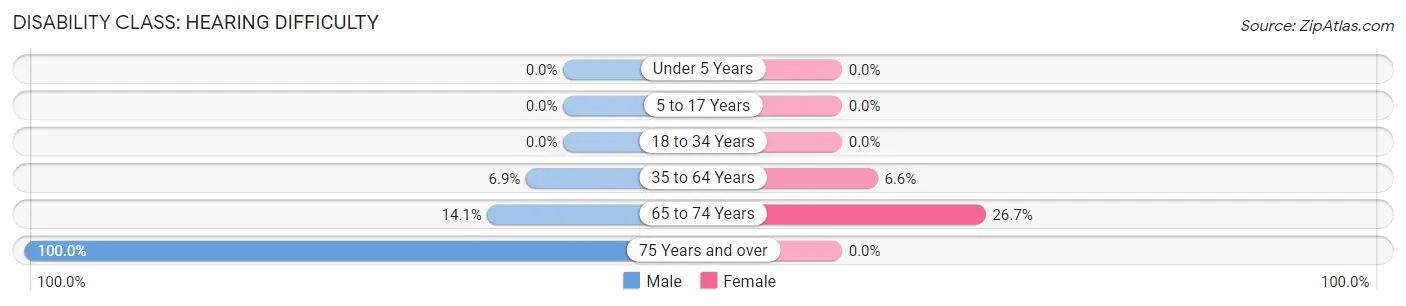
| Age Bracket | Male | Female |
| Under 5 Years | 0 (0.0%) | 0 (0.0%) |
| 5 to 17 Years | 0 (0.0%) | 0 (0.0%) |
| 18 to 34 Years | 0 (0.0%) | 0 (0.0%) |
| 35 to 64 Years | 8 (6.9%) | 12 (6.6%) |
| 65 to 74 Years | 9 (14.1%) | 12 (26.7%) |
| 75 Years and over | 19 (100.0%) | 0 (0.0%) |
Disability Class: Vision Difficulty
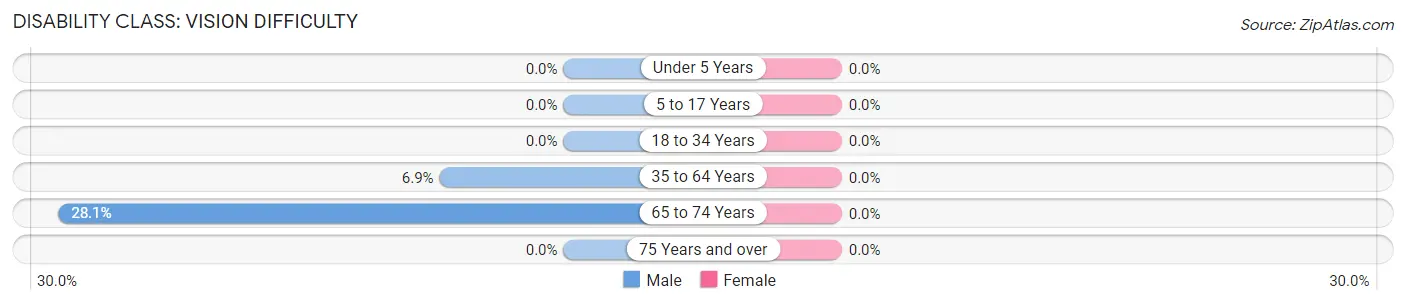
| Age Bracket | Male | Female |
| Under 5 Years | 0 (0.0%) | 0 (0.0%) |
| 5 to 17 Years | 0 (0.0%) | 0 (0.0%) |
| 18 to 34 Years | 0 (0.0%) | 0 (0.0%) |
| 35 to 64 Years | 8 (6.9%) | 0 (0.0%) |
| 65 to 74 Years | 18 (28.1%) | 0 (0.0%) |
| 75 Years and over | 0 (0.0%) | 0 (0.0%) |
Disability Class: Cognitive Difficulty
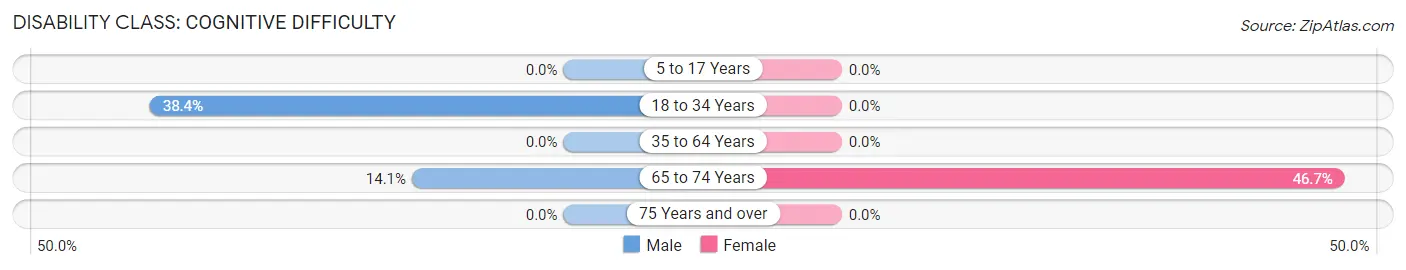
| Age Bracket | Male | Female |
| 5 to 17 Years | 0 (0.0%) | 0 (0.0%) |
| 18 to 34 Years | 38 (38.4%) | 0 (0.0%) |
| 35 to 64 Years | 0 (0.0%) | 0 (0.0%) |
| 65 to 74 Years | 9 (14.1%) | 21 (46.7%) |
| 75 Years and over | 0 (0.0%) | 0 (0.0%) |
Disability Class: Ambulatory Difficulty
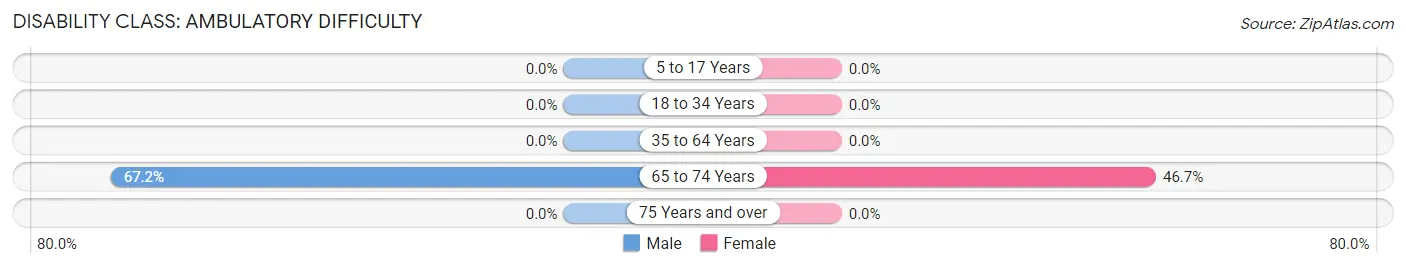
| Age Bracket | Male | Female |
| 5 to 17 Years | 0 (0.0%) | 0 (0.0%) |
| 18 to 34 Years | 0 (0.0%) | 0 (0.0%) |
| 35 to 64 Years | 0 (0.0%) | 0 (0.0%) |
| 65 to 74 Years | 43 (67.2%) | 21 (46.7%) |
| 75 Years and over | 0 (0.0%) | 0 (0.0%) |
Disability Class: Self-Care Difficulty
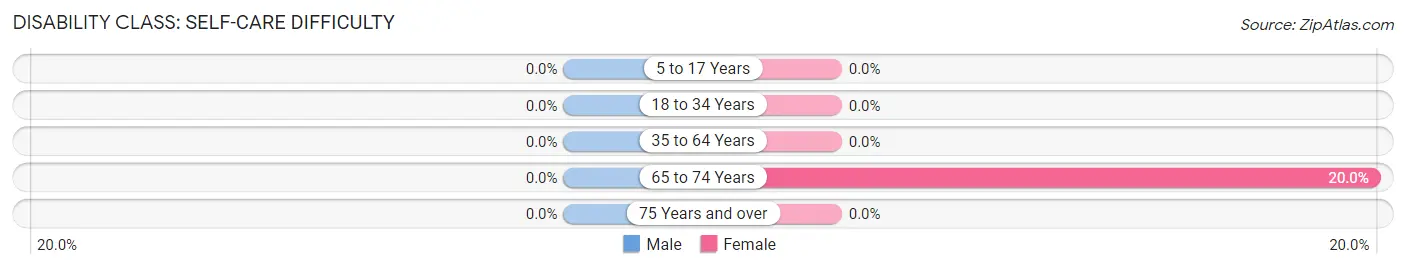
| Age Bracket | Male | Female |
| 5 to 17 Years | 0 (0.0%) | 0 (0.0%) |
| 18 to 34 Years | 0 (0.0%) | 0 (0.0%) |
| 35 to 64 Years | 0 (0.0%) | 0 (0.0%) |
| 65 to 74 Years | 0 (0.0%) | 9 (20.0%) |
| 75 Years and over | 0 (0.0%) | 0 (0.0%) |
Technology Access in Chesterfield
Computing Device Access in Chesterfield
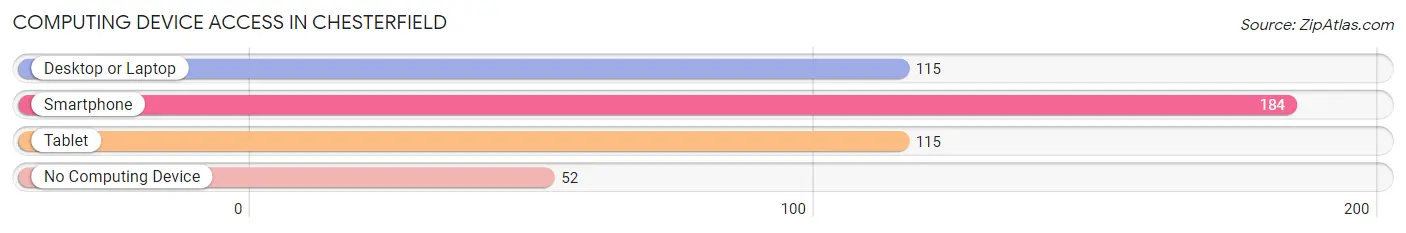
| Device Type | # Households | % Households |
| Desktop or Laptop | 115 | 48.7% |
| Smartphone | 184 | 78.0% |
| Tablet | 115 | 48.7% |
| No Computing Device | 52 | 22.0% |
| Total | 236 | 100.0% |
Internet Access in Chesterfield
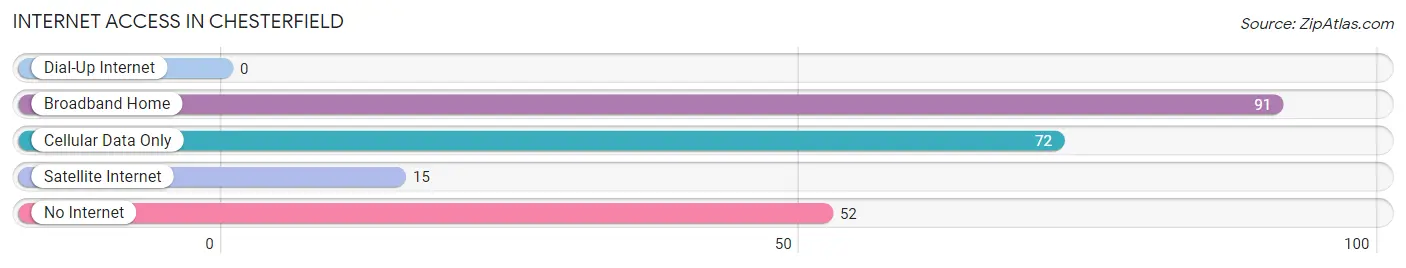
| Internet Type | # Households | % Households |
| Dial-Up Internet | 0 | 0.0% |
| Broadband Home | 91 | 38.6% |
| Cellular Data Only | 72 | 30.5% |
| Satellite Internet | 15 | 6.4% |
| No Internet | 52 | 22.0% |
| Total | 236 | 100.0% |
Chesterfield Summary
Chesterfield is a small town located in the state of Tennessee, in the United States. It is situated in the western part of the state, in the foothills of the Appalachian Mountains. The town is located in the county of Chesterfield, which is part of the Chattanooga metropolitan area. The town has a population of approximately 1,500 people, and is known for its rural charm and small-town atmosphere.
Geography
Chesterfield is located in the western part of Tennessee, in the foothills of the Appalachian Mountains. The town is situated in the county of Chesterfield, which is part of the Chattanooga metropolitan area. The town is located at an elevation of approximately 1,000 feet above sea level. The town is surrounded by rolling hills and lush forests, and is located near the Tennessee River. The town is located approximately 30 miles from Chattanooga, and is accessible by car or bus.
Climate
Chesterfield has a humid subtropical climate, with hot and humid summers and mild winters. The average temperature in the summer months is around 80 degrees Fahrenheit, while the average temperature in the winter months is around 40 degrees Fahrenheit. The town receives an average of 48 inches of precipitation per year, with most of the precipitation occurring in the spring and summer months.
Demographics
As of the 2010 census, the population of Chesterfield was 1,500 people. The racial makeup of the town was 95.3% White, 0.7% African American, 0.3% Native American, 0.7% Asian, 0.3% from other races, and 2.7% from two or more races. The median household income in the town was $37,500, and the median family income was $45,000.
Economy
Chesterfield is a small town with a largely rural economy. The town is home to several small businesses, including a grocery store, a hardware store, and a few restaurants. The town is also home to a few small manufacturing companies, which produce a variety of products, including furniture and clothing. The town is also home to a few farms, which produce a variety of crops, including corn, soybeans, and hay.
History
Chesterfield was founded in 1820, and was named after the county of Chesterfield, which was named after the Earl of Chesterfield in England. The town was originally a small farming community, and was home to a few small businesses. In the late 19th century, the town began to grow, and several new businesses were established. In the early 20th century, the town was home to several small manufacturing companies, which produced a variety of products, including furniture and clothing. The town continued to grow throughout the 20th century, and today it is a small, rural town with a population of approximately 1,500 people.
Common Questions
What is Per Capita Income in Chesterfield?
Per Capita income in Chesterfield is $19,163.
What is the Median Family Income in Chesterfield?
Median Family Income in Chesterfield is $58,859.
What is the Median Household income in Chesterfield?
Median Household Income in Chesterfield is $58,261.
What is Inequality or Gini Index in Chesterfield?
Inequality or Gini Index in Chesterfield is 0.34.
What is the Total Population of Chesterfield?
Total Population of Chesterfield is 834.
What is the Total Male Population of Chesterfield?
Total Male Population of Chesterfield is 426.
What is the Total Female Population of Chesterfield?
Total Female Population of Chesterfield is 408.
What is the Ratio of Males per 100 Females in Chesterfield?
There are 104.41 Males per 100 Females in Chesterfield.
What is the Ratio of Females per 100 Males in Chesterfield?
There are 95.77 Females per 100 Males in Chesterfield.
What is the Median Population Age in Chesterfield?
Median Population Age in Chesterfield is 36.6 Years.
What is the Average Family Size in Chesterfield
Average Family Size in Chesterfield is 3.8 People.
What is the Average Household Size in Chesterfield
Average Household Size in Chesterfield is 3.5 People.
How Large is the Labor Force in Chesterfield?
There are 392 People in the Labor Forcein in Chesterfield.
What is the Percentage of People in the Labor Force in Chesterfield?
65.3% of People are in the Labor Force in Chesterfield.
What is the Unemployment Rate in Chesterfield?
Unemployment Rate in Chesterfield is 11.2%.