Carthage, TN Map & Demographics
Carthage Map
Carthage Overview
$27,044
PER CAPITA INCOME
$63,913
AVG FAMILY INCOME
$53,526
AVG HOUSEHOLD INCOME
42.6%
WAGE / INCOME GAP [ % ]
57.4¢/ $1
WAGE / INCOME GAP [ $ ]
$14,531
FAMILY INCOME DEFICIT
0.41
INEQUALITY / GINI INDEX
2,454
TOTAL POPULATION
1,157
MALE POPULATION
1,297
FEMALE POPULATION
89.21
MALES / 100 FEMALES
112.10
FEMALES / 100 MALES
39.5
MEDIAN AGE
2.9
AVG FAMILY SIZE
2.4
AVG HOUSEHOLD SIZE
1,261
LABOR FORCE [ PEOPLE ]
59.7%
PERCENT IN LABOR FORCE
1.4%
UNEMPLOYMENT RATE
Carthage Zip Codes
Carthage Area Codes
Income in Carthage
Income Overview in Carthage
Per Capita Income in Carthage is $27,044, while median incomes of families and households are $63,913 and $53,526 respectively.
| Characteristic | Number | Measure |
| Per Capita Income | 2,454 | $27,044 |
| Median Family Income | 638 | $63,913 |
| Mean Family Income | 638 | $77,768 |
| Median Household Income | 970 | $53,526 |
| Mean Household Income | 970 | $65,237 |
| Income Deficit | 638 | $14,531 |
| Wage / Income Gap (%) | 2,454 | 42.64% |
| Wage / Income Gap ($) | 2,454 | 57.36¢ per $1 |
| Gini / Inequality Index | 2,454 | 0.41 |
Earnings by Sex in Carthage
Average Earnings in Carthage are $31,693, $43,632 for men and $25,028 for women, a difference of 42.6%.
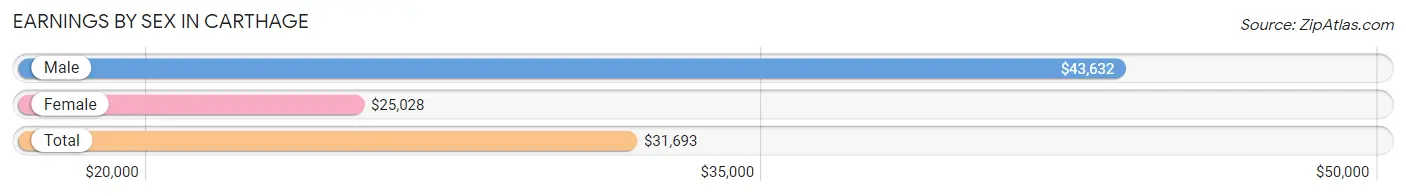
| Sex | Number | Average Earnings |
| Male | 678 (51.6%) | $43,632 |
| Female | 635 (48.4%) | $25,028 |
| Total | 1,313 (100.0%) | $31,693 |
Earnings by Sex by Income Bracket in Carthage
The most common earnings brackets in Carthage are $40,000 to $44,999 for men (74 | 10.9%) and $17,500 to $19,999 for women (130 | 20.5%).
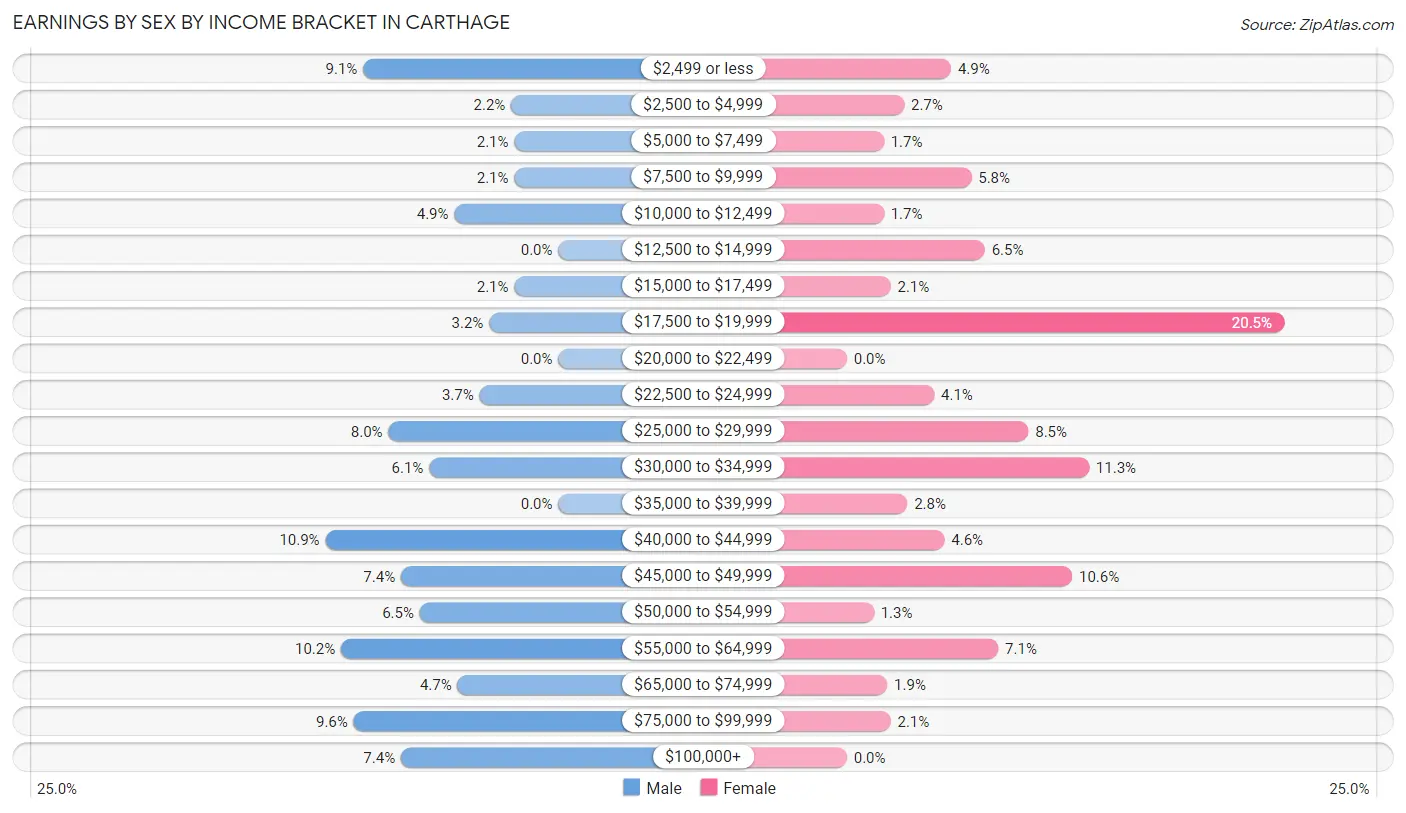
| Income | Male | Female |
| $2,499 or less | 62 (9.1%) | 31 (4.9%) |
| $2,500 to $4,999 | 15 (2.2%) | 17 (2.7%) |
| $5,000 to $7,499 | 14 (2.1%) | 11 (1.7%) |
| $7,500 to $9,999 | 14 (2.1%) | 37 (5.8%) |
| $10,000 to $12,499 | 33 (4.9%) | 11 (1.7%) |
| $12,500 to $14,999 | 0 (0.0%) | 41 (6.5%) |
| $15,000 to $17,499 | 14 (2.1%) | 13 (2.1%) |
| $17,500 to $19,999 | 22 (3.2%) | 130 (20.5%) |
| $20,000 to $22,499 | 0 (0.0%) | 0 (0.0%) |
| $22,500 to $24,999 | 25 (3.7%) | 26 (4.1%) |
| $25,000 to $29,999 | 54 (8.0%) | 54 (8.5%) |
| $30,000 to $34,999 | 41 (6.0%) | 72 (11.3%) |
| $35,000 to $39,999 | 0 (0.0%) | 18 (2.8%) |
| $40,000 to $44,999 | 74 (10.9%) | 29 (4.6%) |
| $45,000 to $49,999 | 50 (7.4%) | 67 (10.5%) |
| $50,000 to $54,999 | 44 (6.5%) | 8 (1.3%) |
| $55,000 to $64,999 | 69 (10.2%) | 45 (7.1%) |
| $65,000 to $74,999 | 32 (4.7%) | 12 (1.9%) |
| $75,000 to $99,999 | 65 (9.6%) | 13 (2.1%) |
| $100,000+ | 50 (7.4%) | 0 (0.0%) |
| Total | 678 (100.0%) | 635 (100.0%) |
Earnings by Sex by Educational Attainment in Carthage
Average earnings in Carthage are $46,615 for men and $26,611 for women, a difference of 42.9%. Men with an educational attainment of graduate degree enjoy the highest average annual earnings of $80,357, while those with high school diploma education earn the least with $31,641. Women with an educational attainment of bachelor's degree earn the most with the average annual earnings of $49,167, while those with less than high school education have the smallest earnings of $13,889.
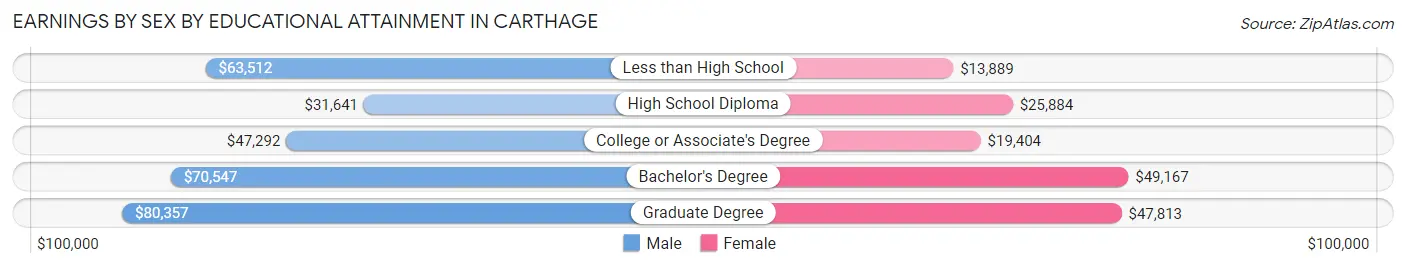
| Educational Attainment | Male Income | Female Income |
| Less than High School | $63,512 | $13,889 |
| High School Diploma | $31,641 | $25,884 |
| College or Associate's Degree | $47,292 | $19,404 |
| Bachelor's Degree | $70,547 | $49,167 |
| Graduate Degree | $80,357 | $47,813 |
| Total | $46,615 | $26,611 |
Family Income in Carthage
Family Income Brackets in Carthage
According to the Carthage family income data, there are 152 families falling into the $35,000 to $49,999 income range, which is the most common income bracket and makes up 23.8% of all families.
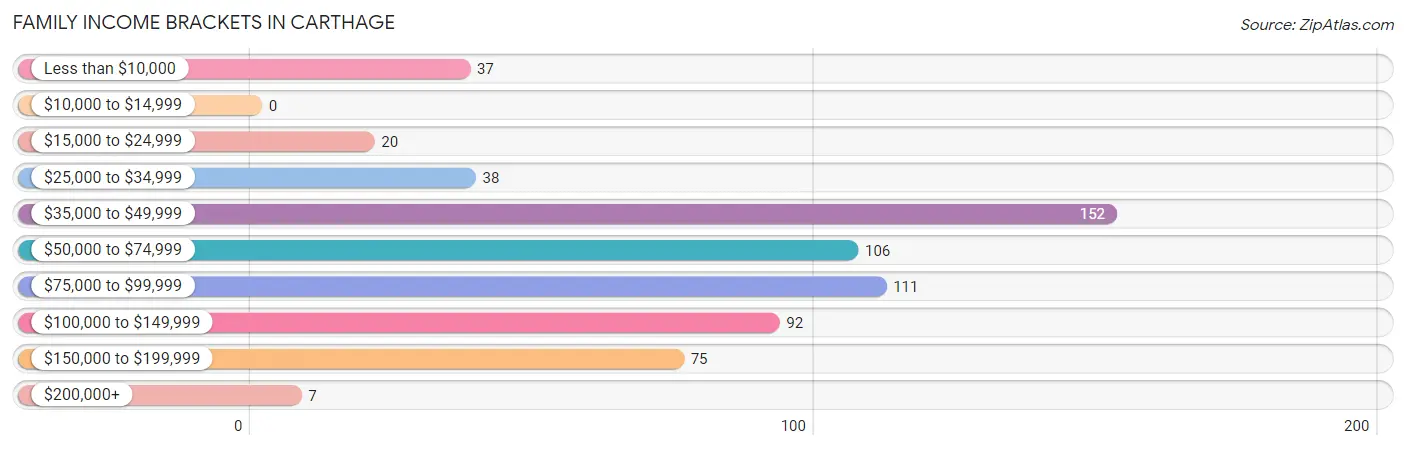
| Income Bracket | # Families | % Families |
| Less than $10,000 | 37 | 5.8% |
| $10,000 to $14,999 | 0 | 0.0% |
| $15,000 to $24,999 | 20 | 3.1% |
| $25,000 to $34,999 | 38 | 6.0% |
| $35,000 to $49,999 | 152 | 23.8% |
| $50,000 to $74,999 | 106 | 16.6% |
| $75,000 to $99,999 | 111 | 17.4% |
| $100,000 to $149,999 | 92 | 14.4% |
| $150,000 to $199,999 | 75 | 11.8% |
| $200,000+ | 7 | 1.1% |
Family Income by Famaliy Size in Carthage
2-person families (296 | 46.4%) account for the highest median family income in Carthage with $80,313 per family, while 2-person families (296 | 46.4%) have the highest median income of $40,156 per family member.
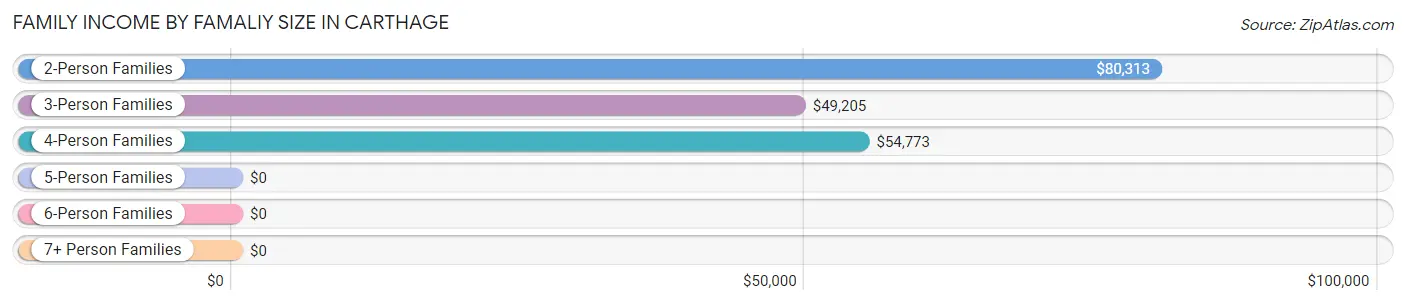
| Income Bracket | # Families | Median Income |
| 2-Person Families | 296 (46.4%) | $80,313 |
| 3-Person Families | 232 (36.4%) | $49,205 |
| 4-Person Families | 90 (14.1%) | $54,773 |
| 5-Person Families | 6 (0.9%) | $0 |
| 6-Person Families | 10 (1.6%) | $0 |
| 7+ Person Families | 4 (0.6%) | $0 |
| Total | 638 (100.0%) | $63,913 |
Family Income by Number of Earners in Carthage
The median family income in Carthage is $63,913, with families comprising 3+ earners (31) having the highest median family income of $170,583, while families with no earners (44) have the lowest median family income of $40,000, accounting for 4.9% and 6.9% of families, respectively.
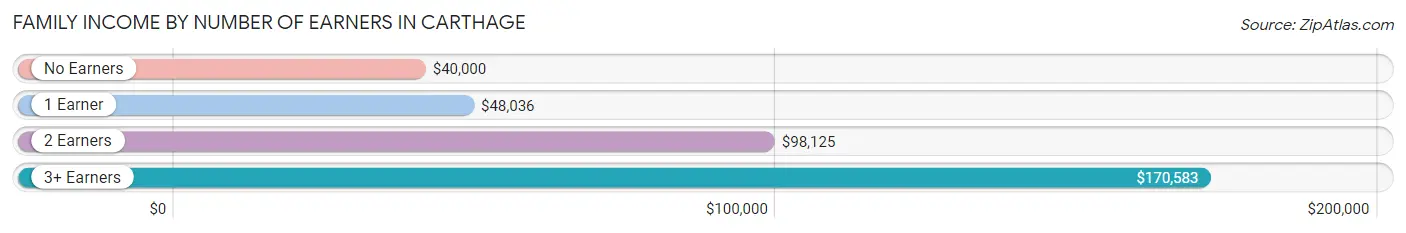
| Number of Earners | # Families | Median Income |
| No Earners | 44 (6.9%) | $40,000 |
| 1 Earner | 279 (43.7%) | $48,036 |
| 2 Earners | 284 (44.5%) | $98,125 |
| 3+ Earners | 31 (4.9%) | $170,583 |
| Total | 638 (100.0%) | $63,913 |
Household Income in Carthage
Household Income Brackets in Carthage
With 176 households falling in the category, the $50,000 to $74,999 income range is the most frequent in Carthage, accounting for 18.1% of all households. In contrast, only 7 households (0.7%) fall into the $200,000+ income bracket, making it the least populous group.
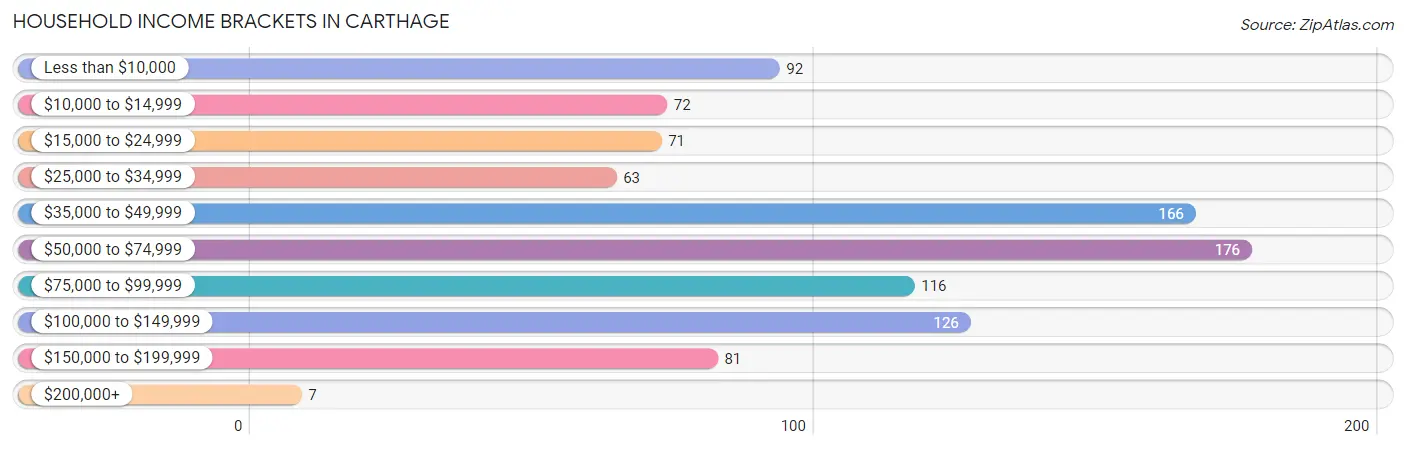
| Income Bracket | # Households | % Households |
| Less than $10,000 | 92 | 9.5% |
| $10,000 to $14,999 | 72 | 7.4% |
| $15,000 to $24,999 | 71 | 7.3% |
| $25,000 to $34,999 | 63 | 6.5% |
| $35,000 to $49,999 | 166 | 17.1% |
| $50,000 to $74,999 | 176 | 18.1% |
| $75,000 to $99,999 | 116 | 12.0% |
| $100,000 to $149,999 | 126 | 13.0% |
| $150,000 to $199,999 | 81 | 8.4% |
| $200,000+ | 7 | 0.7% |
Household Income by Householder Age in Carthage
The median household income in Carthage is $53,526, with the highest median household income of $65,568 found in the 25 to 44 years age bracket for the primary householder. A total of 245 households (25.3%) fall into this category. Meanwhile, the 15 to 24 years age bracket for the primary householder has the lowest median household income of $0, with 69 households (7.1%) in this group.
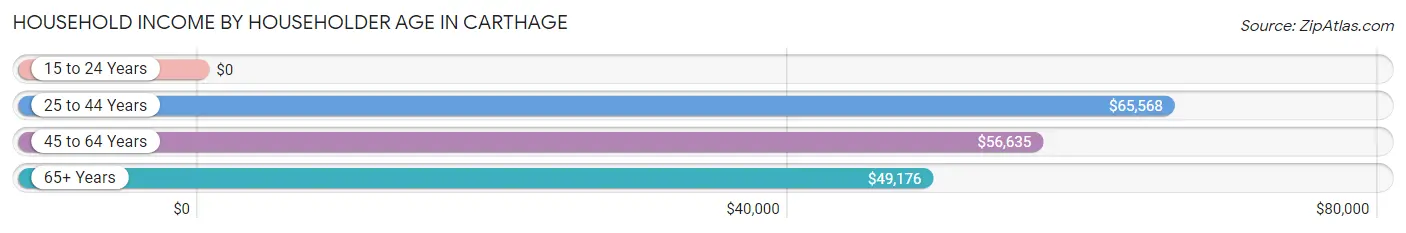
| Income Bracket | # Households | Median Income |
| 15 to 24 Years | 69 (7.1%) | $0 |
| 25 to 44 Years | 245 (25.3%) | $65,568 |
| 45 to 64 Years | 397 (40.9%) | $56,635 |
| 65+ Years | 259 (26.7%) | $49,176 |
| Total | 970 (100.0%) | $53,526 |
Poverty in Carthage
Income Below Poverty by Sex and Age in Carthage
With 11.6% poverty level for males and 17.7% for females among the residents of Carthage, 18 to 24 year old males and 15 year old females are the most vulnerable to poverty, with 40 males (36.7%) and 6 females (100.0%) in their respective age groups living below the poverty level.
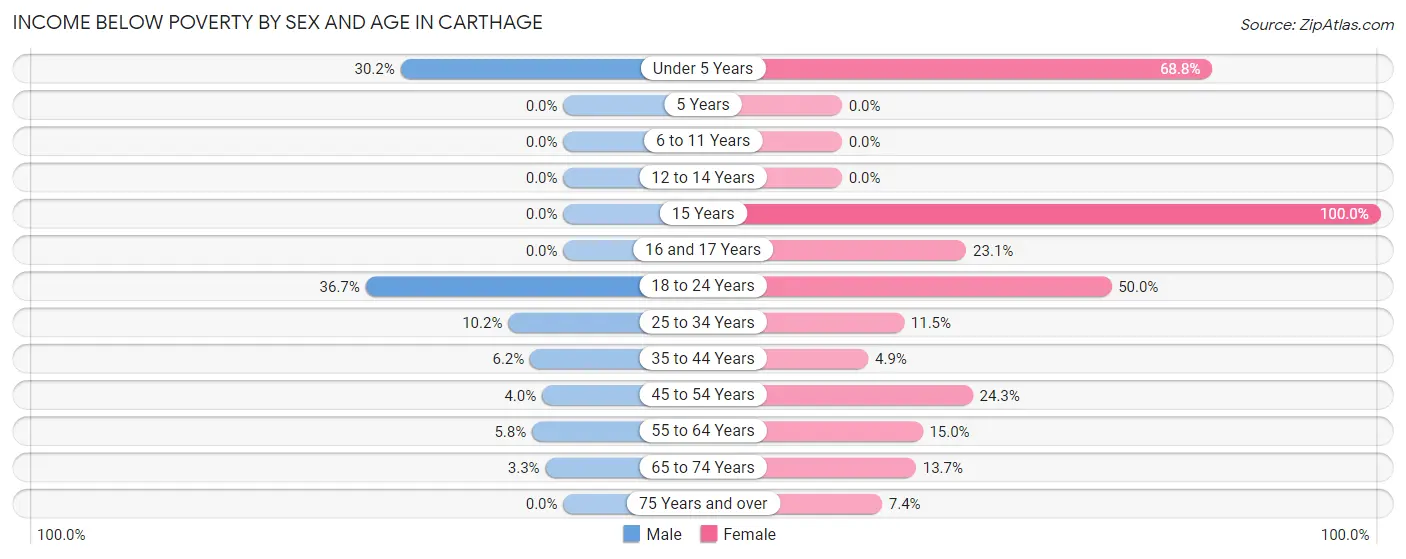
| Age Bracket | Male | Female |
| Under 5 Years | 42 (30.2%) | 22 (68.8%) |
| 5 Years | 0 (0.0%) | 0 (0.0%) |
| 6 to 11 Years | 0 (0.0%) | 0 (0.0%) |
| 12 to 14 Years | 0 (0.0%) | 0 (0.0%) |
| 15 Years | 0 (0.0%) | 6 (100.0%) |
| 16 and 17 Years | 0 (0.0%) | 6 (23.1%) |
| 18 to 24 Years | 40 (36.7%) | 59 (50.0%) |
| 25 to 34 Years | 18 (10.2%) | 19 (11.5%) |
| 35 to 44 Years | 5 (6.2%) | 11 (4.9%) |
| 45 to 54 Years | 4 (4.0%) | 42 (24.3%) |
| 55 to 64 Years | 10 (5.8%) | 22 (15.0%) |
| 65 to 74 Years | 4 (3.3%) | 21 (13.7%) |
| 75 Years and over | 0 (0.0%) | 9 (7.4%) |
| Total | 123 (11.6%) | 217 (17.7%) |
Income Above Poverty by Sex and Age in Carthage
According to the poverty statistics in Carthage, males aged 5 years and females aged 6 to 11 years are the age groups that are most secure financially, with 100.0% of males and 100.0% of females in these age groups living above the poverty line.
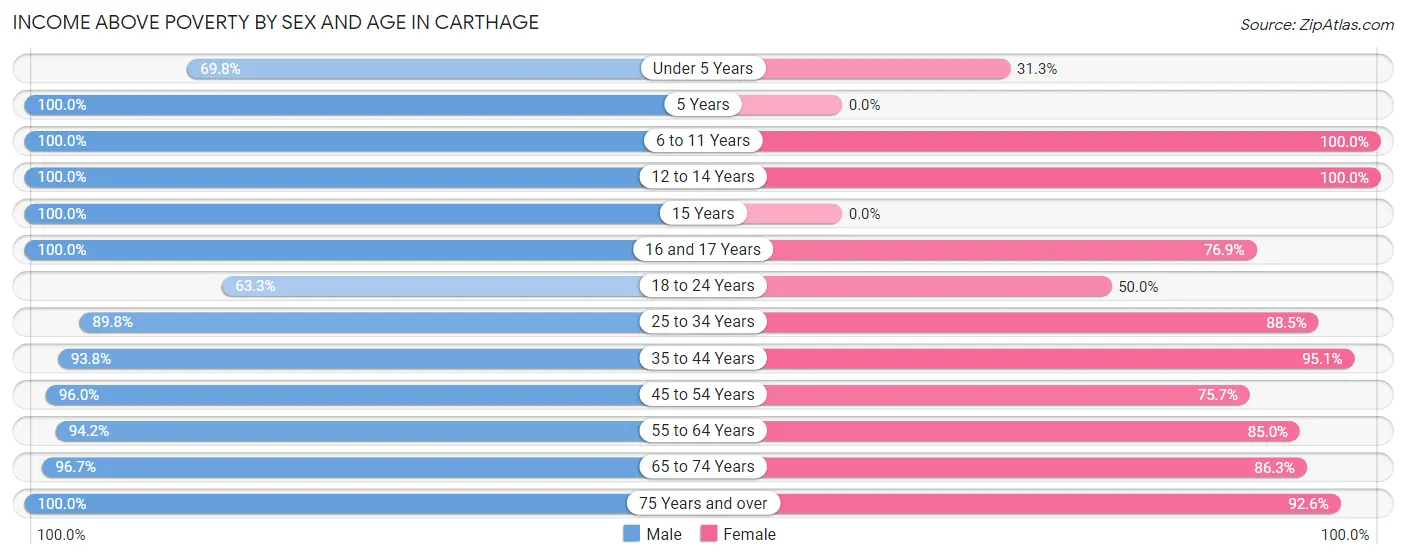
| Age Bracket | Male | Female |
| Under 5 Years | 97 (69.8%) | 10 (31.2%) |
| 5 Years | 39 (100.0%) | 0 (0.0%) |
| 6 to 11 Years | 36 (100.0%) | 45 (100.0%) |
| 12 to 14 Years | 16 (100.0%) | 14 (100.0%) |
| 15 Years | 14 (100.0%) | 0 (0.0%) |
| 16 and 17 Years | 38 (100.0%) | 20 (76.9%) |
| 18 to 24 Years | 69 (63.3%) | 59 (50.0%) |
| 25 to 34 Years | 158 (89.8%) | 146 (88.5%) |
| 35 to 44 Years | 76 (93.8%) | 214 (95.1%) |
| 45 to 54 Years | 97 (96.0%) | 131 (75.7%) |
| 55 to 64 Years | 162 (94.2%) | 125 (85.0%) |
| 65 to 74 Years | 116 (96.7%) | 132 (86.3%) |
| 75 Years and over | 18 (100.0%) | 112 (92.6%) |
| Total | 936 (88.4%) | 1,008 (82.3%) |
Income Below Poverty Among Married-Couple Families in Carthage
The poverty statistics for married-couple families in Carthage show that 4.4% or 17 of the total 390 families live below the poverty line. Families with 3 or 4 children have the highest poverty rate of 60.0%, comprising of 6 families. On the other hand, families with 1 or 2 children have the lowest poverty rate of 0.0%, which includes 0 families.
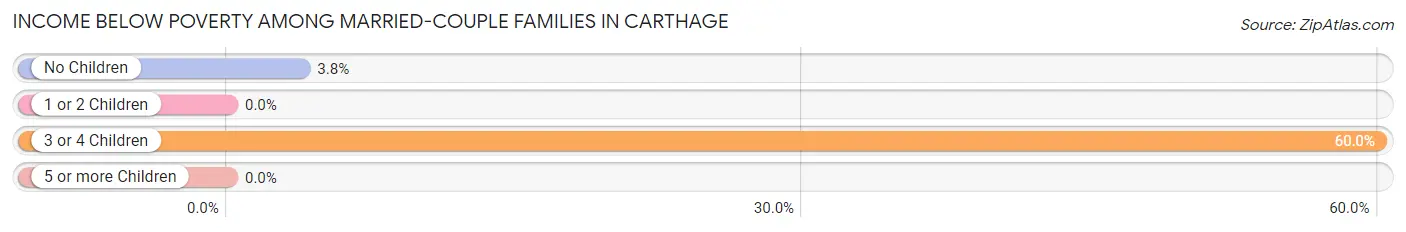
| Children | Above Poverty | Below Poverty |
| No Children | 280 (96.2%) | 11 (3.8%) |
| 1 or 2 Children | 89 (100.0%) | 0 (0.0%) |
| 3 or 4 Children | 4 (40.0%) | 6 (60.0%) |
| 5 or more Children | 0 (0.0%) | 0 (0.0%) |
| Total | 373 (95.6%) | 17 (4.4%) |
Income Below Poverty Among Single-Parent Households in Carthage
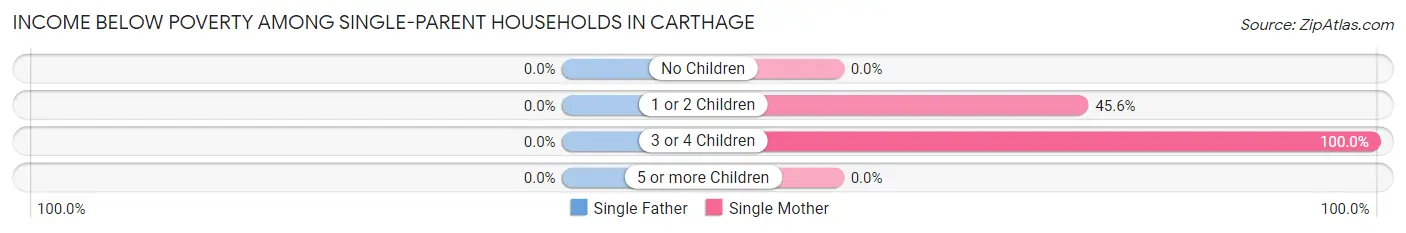
| Children | Single Father | Single Mother |
| No Children | 0 (0.0%) | 0 (0.0%) |
| 1 or 2 Children | 0 (0.0%) | 31 (45.6%) |
| 3 or 4 Children | 0 (0.0%) | 6 (100.0%) |
| 5 or more Children | 0 (0.0%) | 0 (0.0%) |
| Total | 0 (0.0%) | 37 (30.3%) |
Income Below Poverty Among Married-Couple vs Single-Parent Households in Carthage
The poverty data for Carthage shows that 17 of the married-couple family households (4.4%) and 37 of the single-parent households (14.9%) are living below the poverty level. Within the married-couple family households, those with 3 or 4 children have the highest poverty rate, with 6 households (60.0%) falling below the poverty line. Among the single-parent households, those with 3 or 4 children have the highest poverty rate, with 6 household (100.0%) living below poverty.
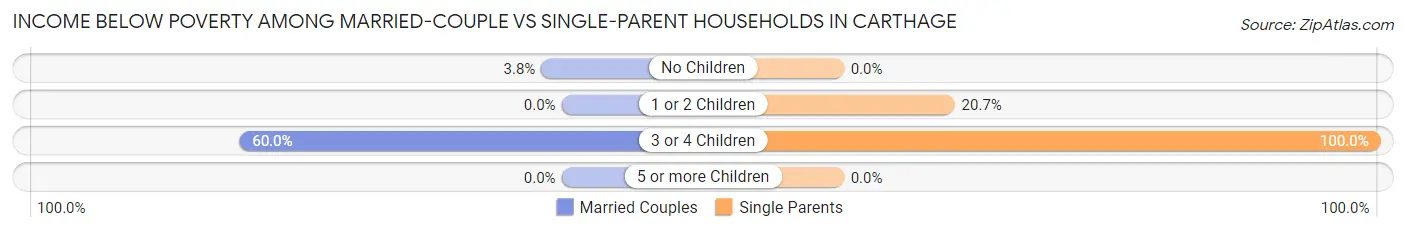
| Children | Married-Couple Families | Single-Parent Households |
| No Children | 11 (3.8%) | 0 (0.0%) |
| 1 or 2 Children | 0 (0.0%) | 31 (20.7%) |
| 3 or 4 Children | 6 (60.0%) | 6 (100.0%) |
| 5 or more Children | 0 (0.0%) | 0 (0.0%) |
| Total | 17 (4.4%) | 37 (14.9%) |
Race in Carthage
The most populous races in Carthage are White / Caucasian (2,104 | 85.7%), Two or more Races (169 | 6.9%), and Black / African American (128 | 5.2%).
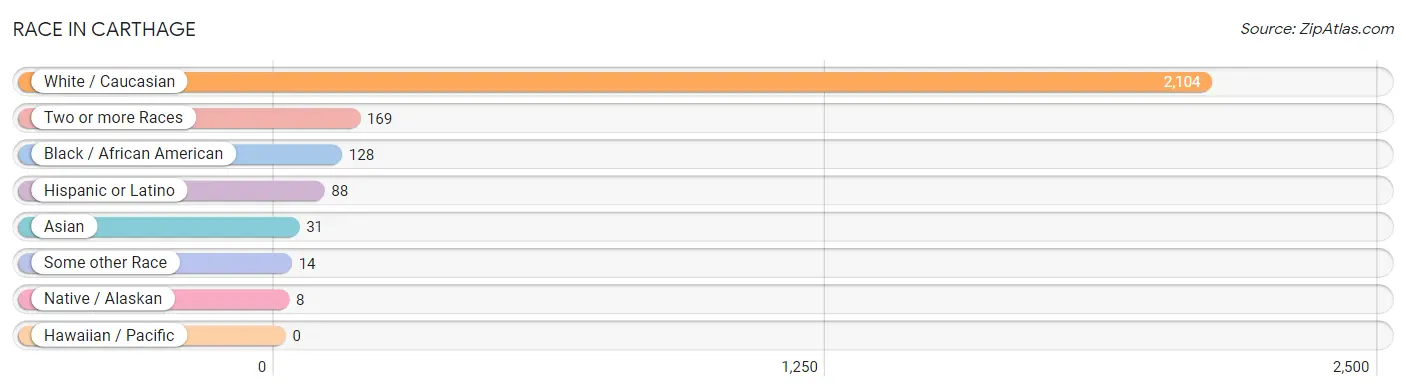
| Race | # Population | % Population |
| Asian | 31 | 1.3% |
| Black / African American | 128 | 5.2% |
| Hawaiian / Pacific | 0 | 0.0% |
| Hispanic or Latino | 88 | 3.6% |
| Native / Alaskan | 8 | 0.3% |
| White / Caucasian | 2,104 | 85.7% |
| Two or more Races | 169 | 6.9% |
| Some other Race | 14 | 0.6% |
| Total | 2,454 | 100.0% |
Ancestry in Carthage
The most populous ancestries reported in Carthage are Irish (378 | 15.4%), American (364 | 14.8%), English (331 | 13.5%), German (182 | 7.4%), and Scottish (114 | 4.6%), together accounting for 55.8% of all Carthage residents.
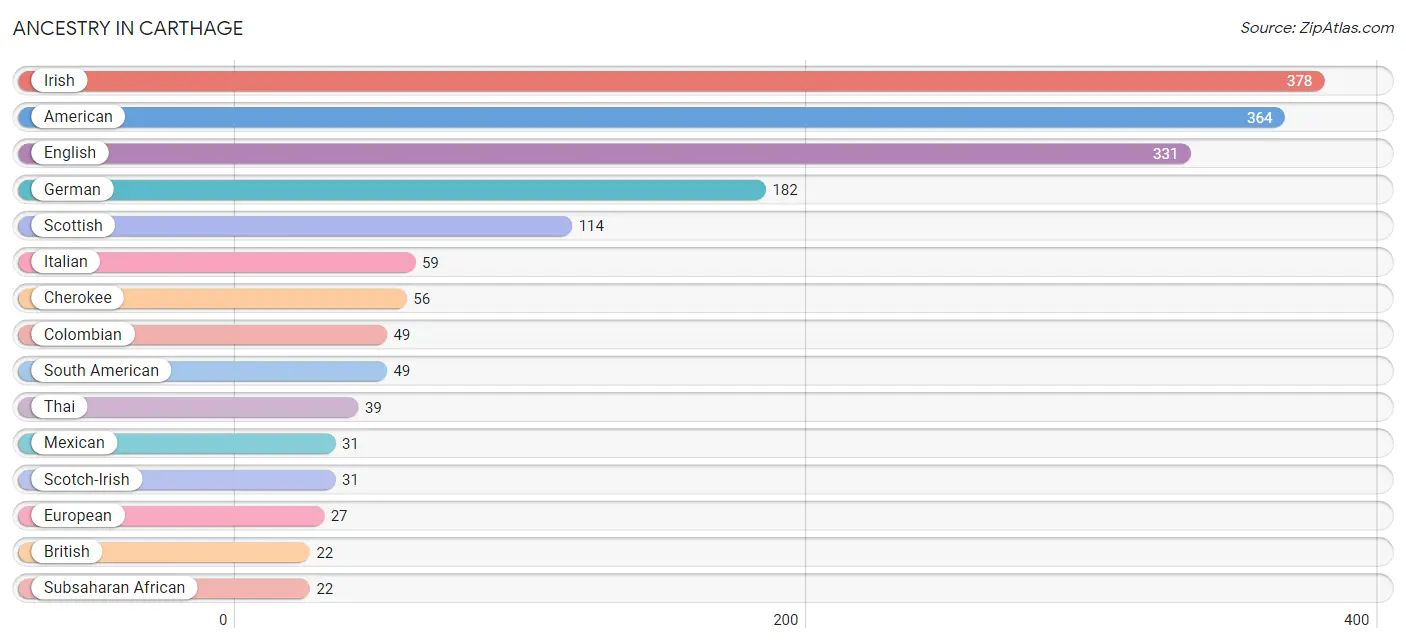
| Ancestry | # Population | % Population |
| African | 15 | 0.6% |
| American | 364 | 14.8% |
| British | 22 | 0.9% |
| Cherokee | 56 | 2.3% |
| Chickasaw | 5 | 0.2% |
| Colombian | 49 | 2.0% |
| Cuban | 8 | 0.3% |
| Dutch | 15 | 0.6% |
| English | 331 | 13.5% |
| European | 27 | 1.1% |
| French | 21 | 0.9% |
| German | 182 | 7.4% |
| Indian (Asian) | 8 | 0.3% |
| Irish | 378 | 15.4% |
| Italian | 59 | 2.4% |
| Korean | 8 | 0.3% |
| Mexican | 31 | 1.3% |
| Norwegian | 12 | 0.5% |
| Polish | 14 | 0.6% |
| Scandinavian | 18 | 0.7% |
| Scotch-Irish | 31 | 1.3% |
| Scottish | 114 | 4.6% |
| Somali | 7 | 0.3% |
| South American | 49 | 2.0% |
| Subsaharan African | 22 | 0.9% |
| Thai | 39 | 1.6% |
| Welsh | 4 | 0.2% | View All 27 Rows |
Immigrants in Carthage
The most numerous immigrant groups reported in Carthage came from Asia (31 | 1.3%), India (31 | 1.3%), South Central Asia (31 | 1.3%), Central America (8 | 0.3%), and Latin America (8 | 0.3%), together accounting for 4.4% of all Carthage residents.
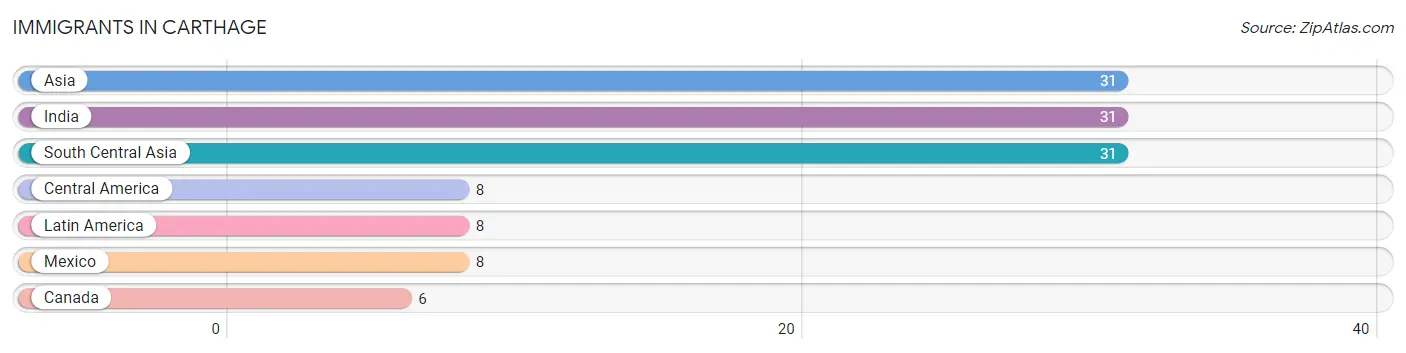
| Immigration Origin | # Population | % Population |
| Asia | 31 | 1.3% |
| Canada | 6 | 0.2% |
| Central America | 8 | 0.3% |
| India | 31 | 1.3% |
| Latin America | 8 | 0.3% |
| Mexico | 8 | 0.3% |
| South Central Asia | 31 | 1.3% | View All 7 Rows |
Sex and Age in Carthage
Sex and Age in Carthage
The most populous age groups in Carthage are Under 5 Years (139 | 12.0%) for men and 35 to 39 Years (176 | 13.6%) for women.
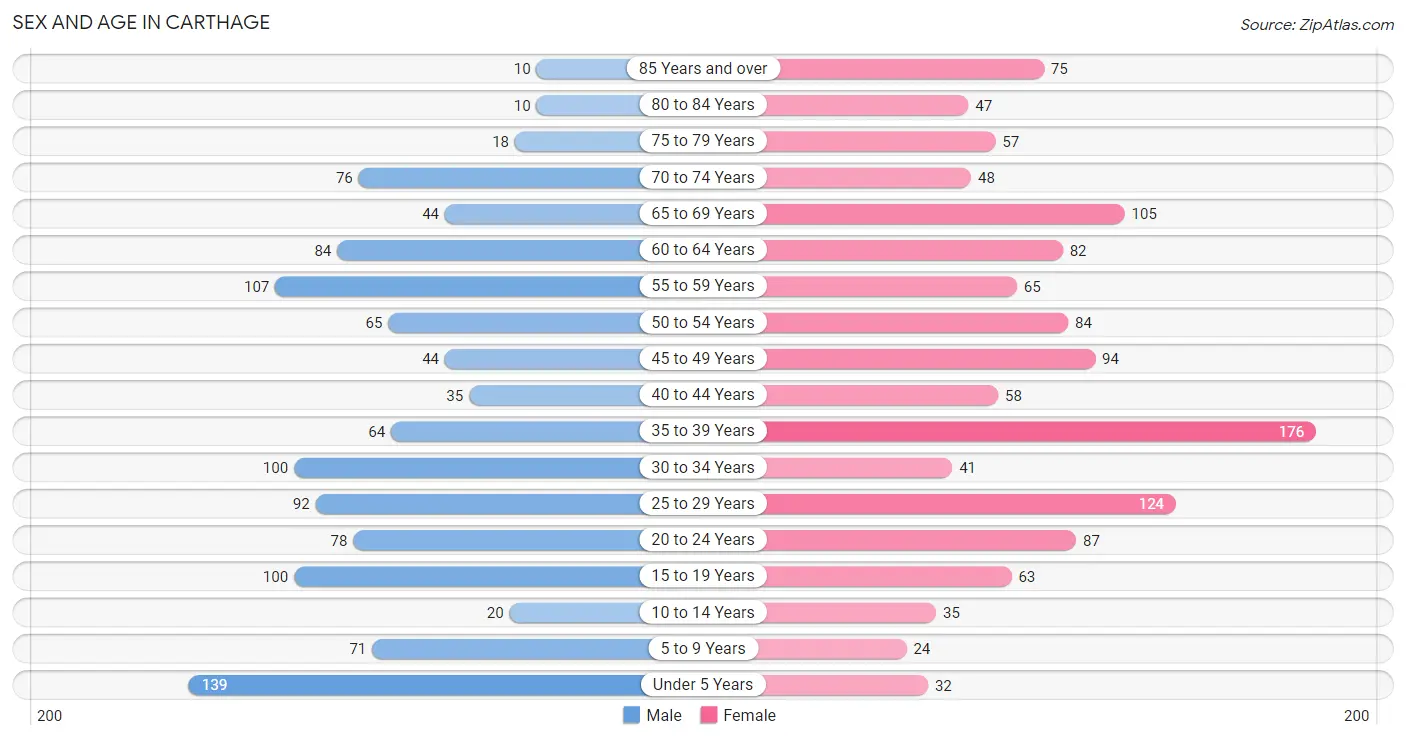
| Age Bracket | Male | Female |
| Under 5 Years | 139 (12.0%) | 32 (2.5%) |
| 5 to 9 Years | 71 (6.1%) | 24 (1.8%) |
| 10 to 14 Years | 20 (1.7%) | 35 (2.7%) |
| 15 to 19 Years | 100 (8.6%) | 63 (4.9%) |
| 20 to 24 Years | 78 (6.7%) | 87 (6.7%) |
| 25 to 29 Years | 92 (8.0%) | 124 (9.6%) |
| 30 to 34 Years | 100 (8.6%) | 41 (3.2%) |
| 35 to 39 Years | 64 (5.5%) | 176 (13.6%) |
| 40 to 44 Years | 35 (3.0%) | 58 (4.5%) |
| 45 to 49 Years | 44 (3.8%) | 94 (7.2%) |
| 50 to 54 Years | 65 (5.6%) | 84 (6.5%) |
| 55 to 59 Years | 107 (9.2%) | 65 (5.0%) |
| 60 to 64 Years | 84 (7.3%) | 82 (6.3%) |
| 65 to 69 Years | 44 (3.8%) | 105 (8.1%) |
| 70 to 74 Years | 76 (6.6%) | 48 (3.7%) |
| 75 to 79 Years | 18 (1.6%) | 57 (4.4%) |
| 80 to 84 Years | 10 (0.9%) | 47 (3.6%) |
| 85 Years and over | 10 (0.9%) | 75 (5.8%) |
| Total | 1,157 (100.0%) | 1,297 (100.0%) |
Families and Households in Carthage
Median Family Size in Carthage
The median family size in Carthage is 2.85 persons per family, with married-couple families (390 | 61.1%) accounting for the largest median family size of 2.91 persons per family. On the other hand, single male/father families (126 | 19.8%) represent the smallest median family size with 2.67 persons per family.
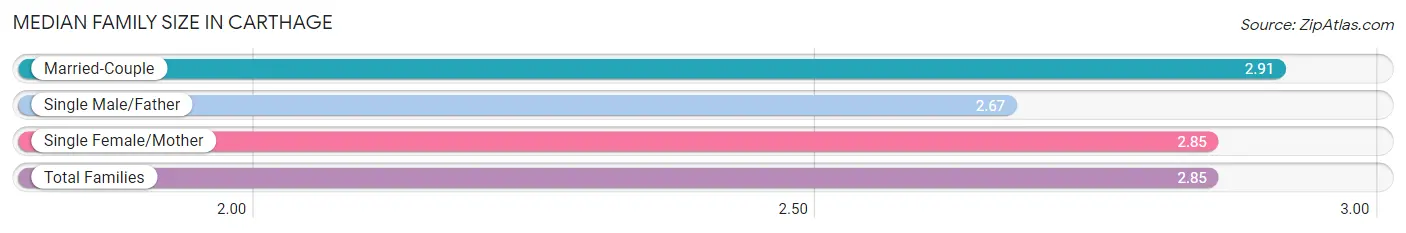
| Family Type | # Families | Family Size |
| Married-Couple | 390 (61.1%) | 2.91 |
| Single Male/Father | 126 (19.8%) | 2.67 |
| Single Female/Mother | 122 (19.1%) | 2.85 |
| Total Families | 638 (100.0%) | 2.85 |
Median Household Size in Carthage
The median household size in Carthage is 2.35 persons per household, with single male/father households (126 | 13.0%) accounting for the largest median household size of 3.28 persons per household. non-family households (332 | 34.2%) represent the smallest median household size with 1.15 persons per household.
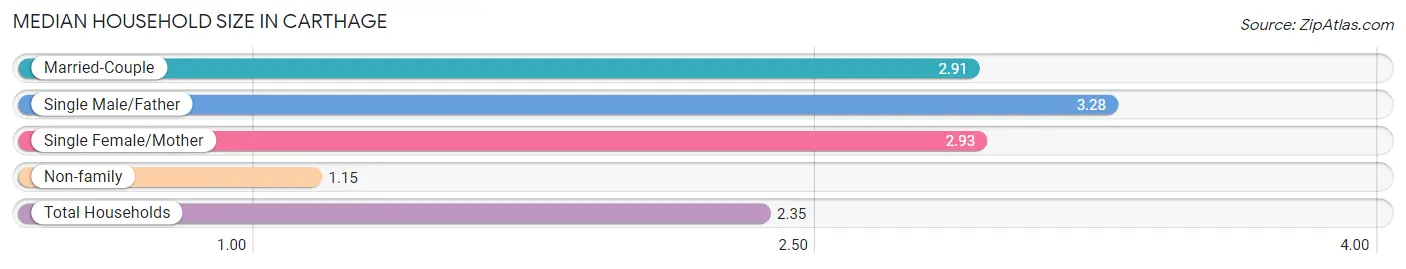
| Household Type | # Households | Household Size |
| Married-Couple | 390 (40.2%) | 2.91 |
| Single Male/Father | 126 (13.0%) | 3.28 |
| Single Female/Mother | 122 (12.6%) | 2.93 |
| Non-family | 332 (34.2%) | 1.15 |
| Total Households | 970 (100.0%) | 2.35 |
Household Size by Marriage Status in Carthage
Out of a total of 970 households in Carthage, 638 (65.8%) are family households, while 332 (34.2%) are nonfamily households. The most numerous type of family households are 2-person households, comprising 276, and the most common type of nonfamily households are 1-person households, comprising 285.
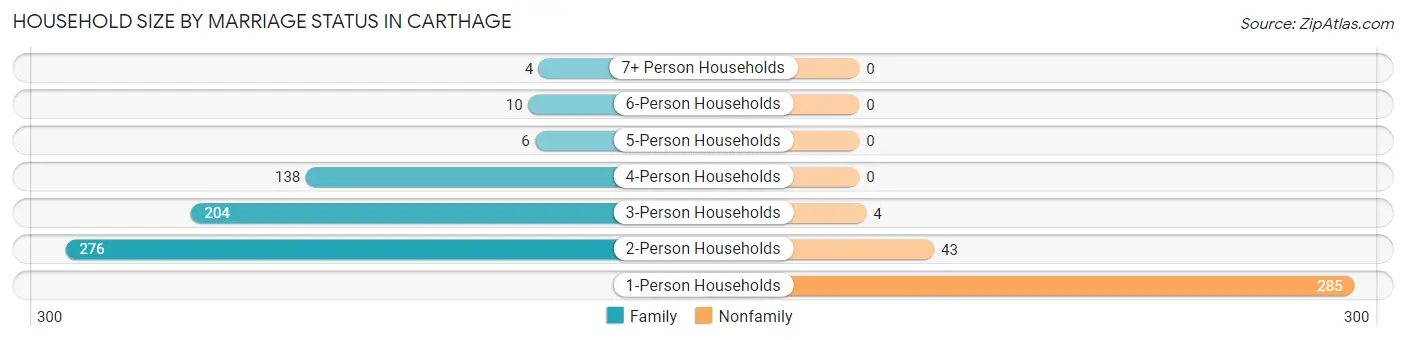
| Household Size | Family Households | Nonfamily Households |
| 1-Person Households | - | 285 (29.4%) |
| 2-Person Households | 276 (28.4%) | 43 (4.4%) |
| 3-Person Households | 204 (21.0%) | 4 (0.4%) |
| 4-Person Households | 138 (14.2%) | 0 (0.0%) |
| 5-Person Households | 6 (0.6%) | 0 (0.0%) |
| 6-Person Households | 10 (1.0%) | 0 (0.0%) |
| 7+ Person Households | 4 (0.4%) | 0 (0.0%) |
| Total | 638 (65.8%) | 332 (34.2%) |
Female Fertility in Carthage
Fertility by Age in Carthage
Average fertility rate in Carthage is 143.0 births per 1,000 women. Women in the age bracket of 20 to 34 years have the highest fertility rate with 302.0 births per 1,000 women. Women in the age bracket of 20 to 34 years acount for 81.7% of all women with births.
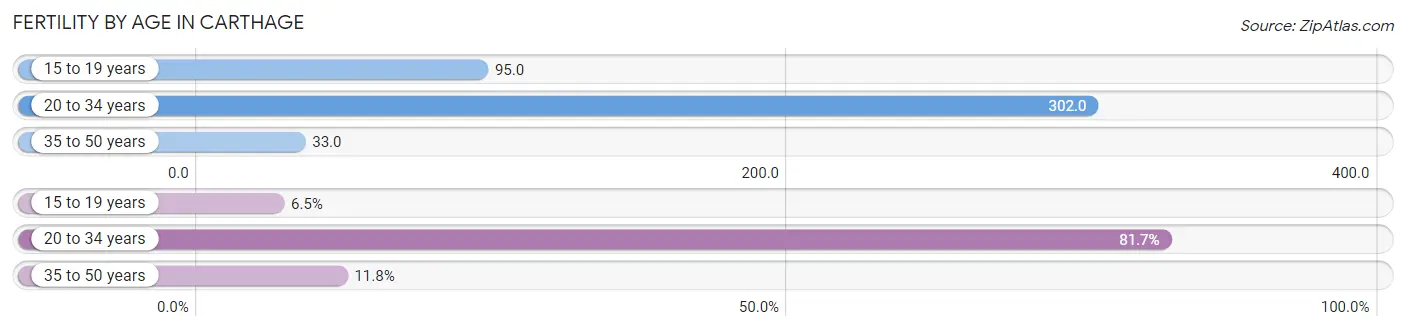
| Age Bracket | Women with Births | Births / 1,000 Women |
| 15 to 19 years | 6 (6.5%) | 95.0 |
| 20 to 34 years | 76 (81.7%) | 302.0 |
| 35 to 50 years | 11 (11.8%) | 33.0 |
| Total | 93 (100.0%) | 143.0 |
Fertility by Age by Marriage Status in Carthage
21.5% of women with births (93) in Carthage are married. The highest percentage of unmarried women with births falls into 15 to 19 years age bracket with 100.0% of them unmarried at the time of birth, while the lowest percentage of unmarried women with births belong to 35 to 50 years age bracket with 45.5% of them unmarried.
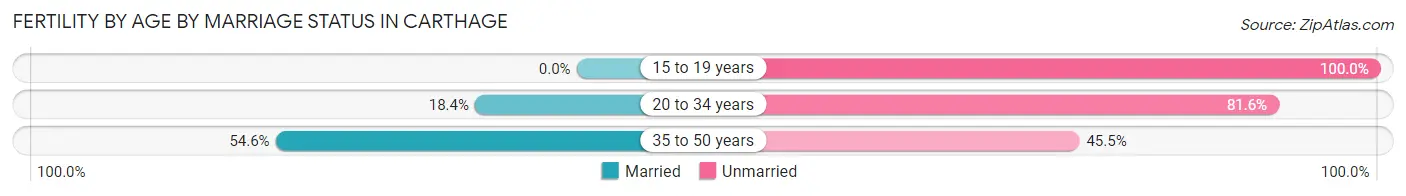
| Age Bracket | Married | Unmarried |
| 15 to 19 years | 0 (0.0%) | 6 (100.0%) |
| 20 to 34 years | 14 (18.4%) | 62 (81.6%) |
| 35 to 50 years | 6 (54.5%) | 5 (45.5%) |
| Total | 20 (21.5%) | 73 (78.5%) |
Fertility by Education in Carthage
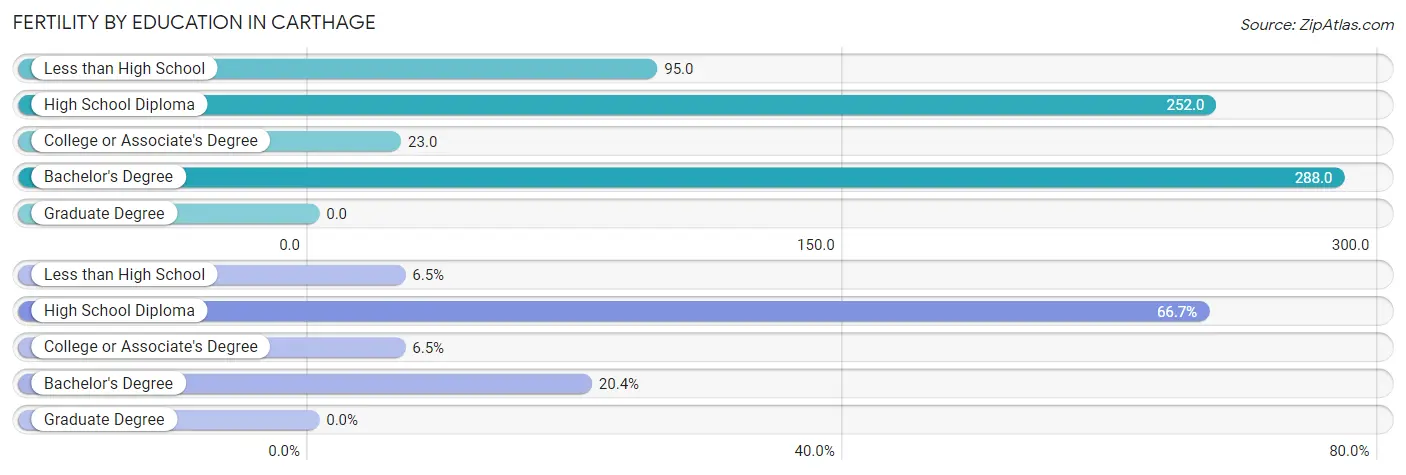
| Educational Attainment | Women with Births | Births / 1,000 Women |
| Less than High School | 6 (6.5%) | 95.0 |
| High School Diploma | 62 (66.7%) | 252.0 |
| College or Associate's Degree | 6 (6.5%) | 23.0 |
| Bachelor's Degree | 19 (20.4%) | 288.0 |
| Graduate Degree | 0 (0.0%) | 0.0 |
| Total | 93 (100.0%) | 143.0 |
Fertility by Education by Marriage Status in Carthage
78.5% of women with births in Carthage are unmarried. Women with the educational attainment of college or associate's degree are most likely to be married with 100.0% of them married at childbirth, while women with the educational attainment of less than high school are least likely to be married with 100.0% of them unmarried at childbirth.
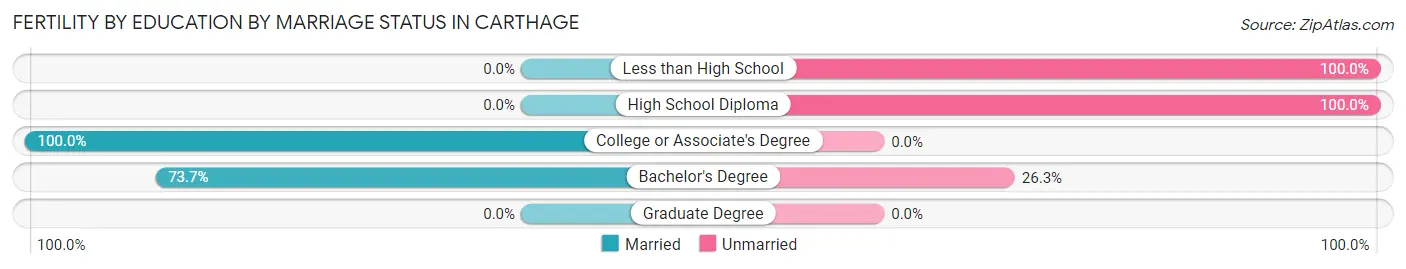
| Educational Attainment | Married | Unmarried |
| Less than High School | 0 (0.0%) | 6 (100.0%) |
| High School Diploma | 0 (0.0%) | 62 (100.0%) |
| College or Associate's Degree | 6 (100.0%) | 0 (0.0%) |
| Bachelor's Degree | 14 (73.7%) | 5 (26.3%) |
| Graduate Degree | 0 (0.0%) | 0 (0.0%) |
| Total | 20 (21.5%) | 73 (78.5%) |
Employment Characteristics in Carthage
Employment by Class of Employer in Carthage
Among the 1,240 employed individuals in Carthage, private company employees (964 | 77.7%), local government employees (102 | 8.2%), and state government employees (63 | 5.1%) make up the most common classes of employment.
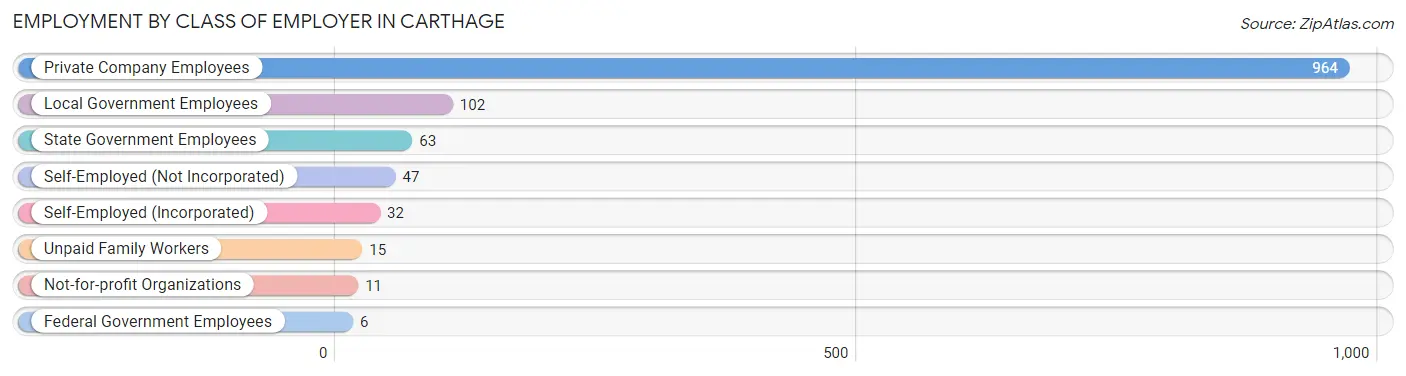
| Employer Class | # Employees | % Employees |
| Private Company Employees | 964 | 77.7% |
| Self-Employed (Incorporated) | 32 | 2.6% |
| Self-Employed (Not Incorporated) | 47 | 3.8% |
| Not-for-profit Organizations | 11 | 0.9% |
| Local Government Employees | 102 | 8.2% |
| State Government Employees | 63 | 5.1% |
| Federal Government Employees | 6 | 0.5% |
| Unpaid Family Workers | 15 | 1.2% |
| Total | 1,240 | 100.0% |
Employment Status by Age in Carthage
According to the labor force statistics for Carthage, out of the total population over 16 years of age (2,113), 59.7% or 1,261 individuals are in the labor force, with 1.4% or 18 of them unemployed. The age group with the highest labor force participation rate is 35 to 44 years, with 82.0% or 273 individuals in the labor force. Within the labor force, the 35 to 44 years age range has the highest percentage of unemployed individuals, with 5.1% or 14 of them being unemployed.
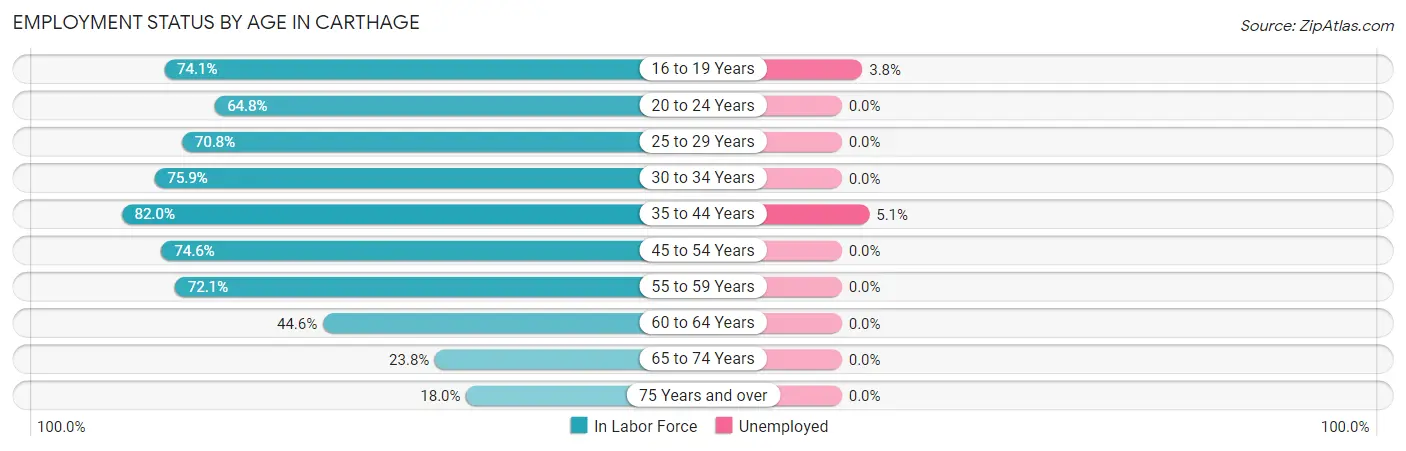
| Age Bracket | In Labor Force | Unemployed |
| 16 to 19 Years | 106 (74.1%) | 4 (3.8%) |
| 20 to 24 Years | 107 (64.8%) | 0 (0.0%) |
| 25 to 29 Years | 153 (70.8%) | 0 (0.0%) |
| 30 to 34 Years | 107 (75.9%) | 0 (0.0%) |
| 35 to 44 Years | 273 (82.0%) | 14 (5.1%) |
| 45 to 54 Years | 214 (74.6%) | 0 (0.0%) |
| 55 to 59 Years | 124 (72.1%) | 0 (0.0%) |
| 60 to 64 Years | 74 (44.6%) | 0 (0.0%) |
| 65 to 74 Years | 65 (23.8%) | 0 (0.0%) |
| 75 Years and over | 39 (18.0%) | 0 (0.0%) |
| Total | 1,261 (59.7%) | 18 (1.4%) |
Employment Status by Educational Attainment in Carthage
According to labor force statistics for Carthage, 71.9% of individuals (945) out of the total population between 25 and 64 years of age (1,315) are in the labor force, with 1.5% or 14 of them being unemployed. The group with the highest labor force participation rate are those with the educational attainment of bachelor's degree or higher, with 94.9% or 278 individuals in the labor force. Within the labor force, individuals with less than high school education have the highest percentage of unemployment, with 6.3% or 4 of them being unemployed.
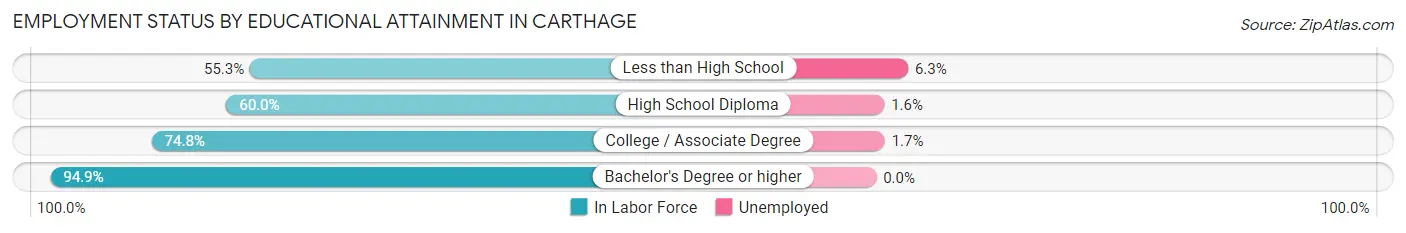
| Educational Attainment | In Labor Force | Unemployed |
| Less than High School | 63 (55.3%) | 7 (6.3%) |
| High School Diploma | 305 (60.0%) | 8 (1.6%) |
| College / Associate Degree | 299 (74.8%) | 7 (1.7%) |
| Bachelor's Degree or higher | 278 (94.9%) | 0 (0.0%) |
| Total | 945 (71.9%) | 20 (1.5%) |
Employment Occupations by Sex in Carthage
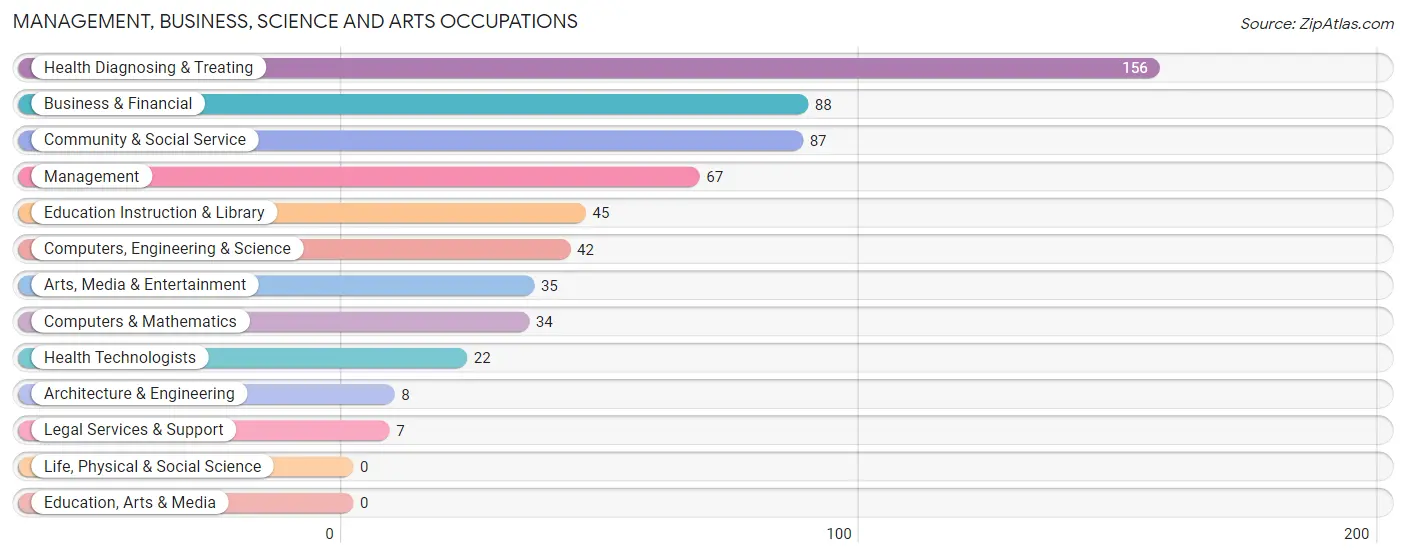
Management, Business, Science and Arts Occupations
The most common Management, Business, Science and Arts occupations in Carthage are Health Diagnosing & Treating (156 | 12.5%), Business & Financial (88 | 7.1%), Community & Social Service (87 | 7.0%), Management (67 | 5.4%), and Education Instruction & Library (45 | 3.6%).
Management, Business, Science and Arts Occupations by Sex
Within the Management, Business, Science and Arts occupations in Carthage, the most male-oriented occupations are Computers & Mathematics (100.0%), Arts, Media & Entertainment (100.0%), and Community & Social Service (82.8%), while the most female-oriented occupations are Architecture & Engineering (100.0%), Legal Services & Support (100.0%), and Health Diagnosing & Treating (92.3%).
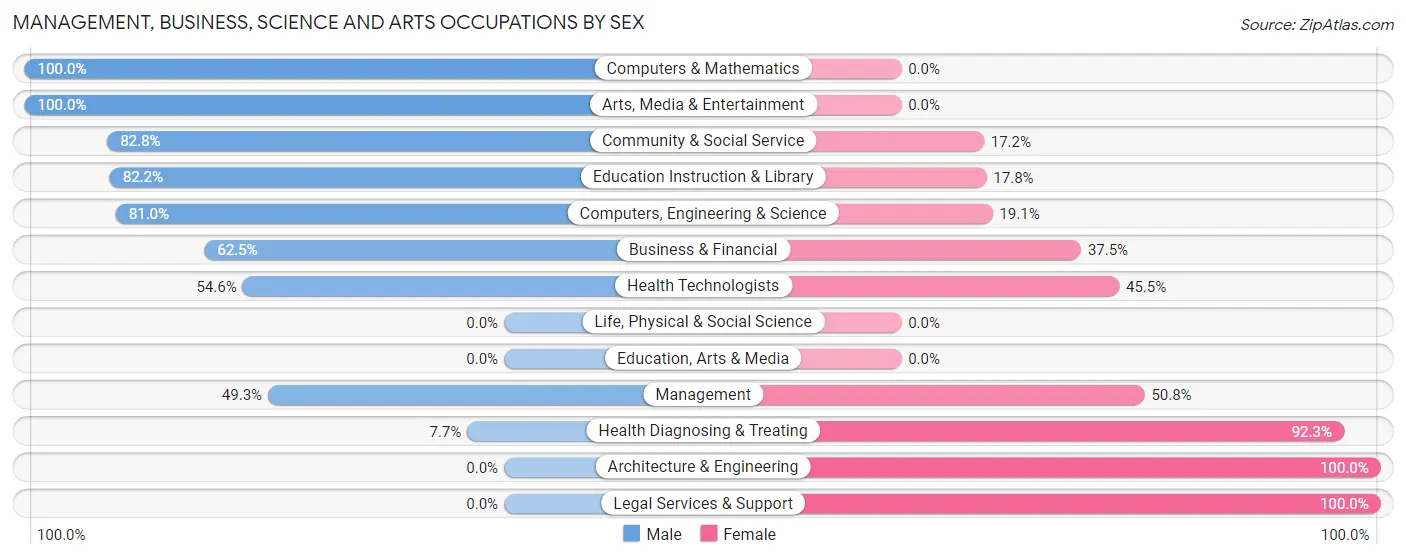
| Occupation | Male | Female |
| Management | 33 (49.2%) | 34 (50.7%) |
| Business & Financial | 55 (62.5%) | 33 (37.5%) |
| Computers, Engineering & Science | 34 (80.9%) | 8 (19.1%) |
| Computers & Mathematics | 34 (100.0%) | 0 (0.0%) |
| Architecture & Engineering | 0 (0.0%) | 8 (100.0%) |
| Life, Physical & Social Science | 0 (0.0%) | 0 (0.0%) |
| Community & Social Service | 72 (82.8%) | 15 (17.2%) |
| Education, Arts & Media | 0 (0.0%) | 0 (0.0%) |
| Legal Services & Support | 0 (0.0%) | 7 (100.0%) |
| Education Instruction & Library | 37 (82.2%) | 8 (17.8%) |
| Arts, Media & Entertainment | 35 (100.0%) | 0 (0.0%) |
| Health Diagnosing & Treating | 12 (7.7%) | 144 (92.3%) |
| Health Technologists | 12 (54.5%) | 10 (45.5%) |
| Total (Category) | 206 (46.8%) | 234 (53.2%) |
| Total (Overall) | 633 (50.9%) | 611 (49.1%) |
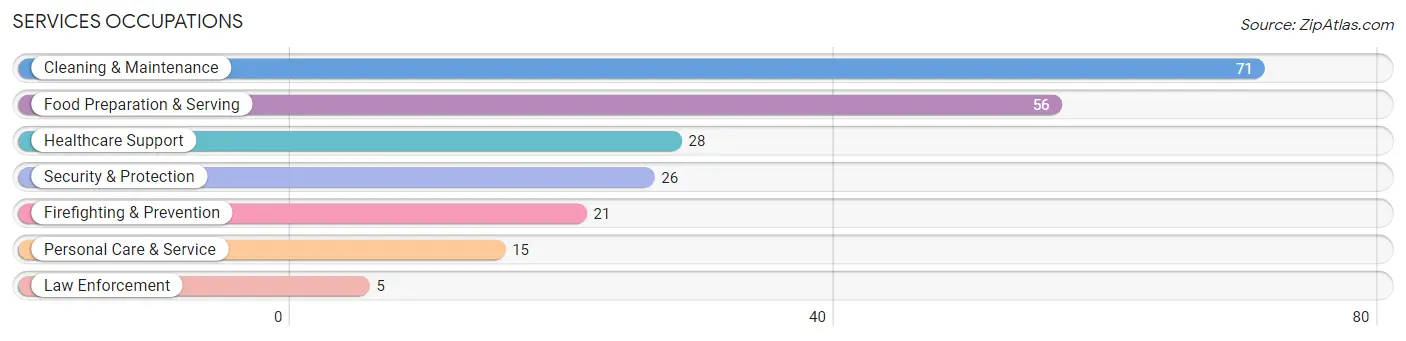
Services Occupations
The most common Services occupations in Carthage are Cleaning & Maintenance (71 | 5.7%), Food Preparation & Serving (56 | 4.5%), Healthcare Support (28 | 2.2%), Security & Protection (26 | 2.1%), and Firefighting & Prevention (21 | 1.7%).
Services Occupations by Sex
Within the Services occupations in Carthage, the most male-oriented occupations are Security & Protection (100.0%), Firefighting & Prevention (100.0%), and Law Enforcement (100.0%), while the most female-oriented occupations are Personal Care & Service (100.0%), Food Preparation & Serving (57.1%), and Cleaning & Maintenance (38.0%).
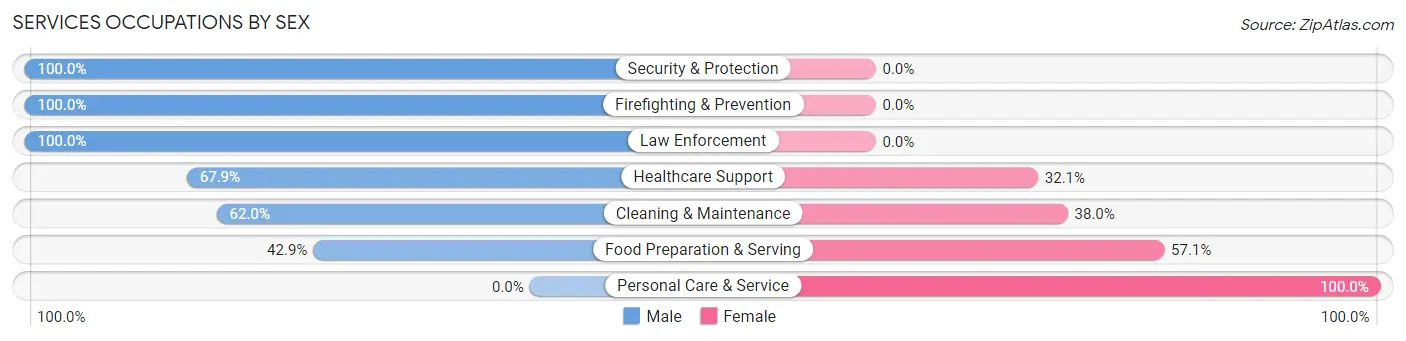
| Occupation | Male | Female |
| Healthcare Support | 19 (67.9%) | 9 (32.1%) |
| Security & Protection | 26 (100.0%) | 0 (0.0%) |
| Firefighting & Prevention | 21 (100.0%) | 0 (0.0%) |
| Law Enforcement | 5 (100.0%) | 0 (0.0%) |
| Food Preparation & Serving | 24 (42.9%) | 32 (57.1%) |
| Cleaning & Maintenance | 44 (62.0%) | 27 (38.0%) |
| Personal Care & Service | 0 (0.0%) | 15 (100.0%) |
| Total (Category) | 113 (57.7%) | 83 (42.3%) |
| Total (Overall) | 633 (50.9%) | 611 (49.1%) |
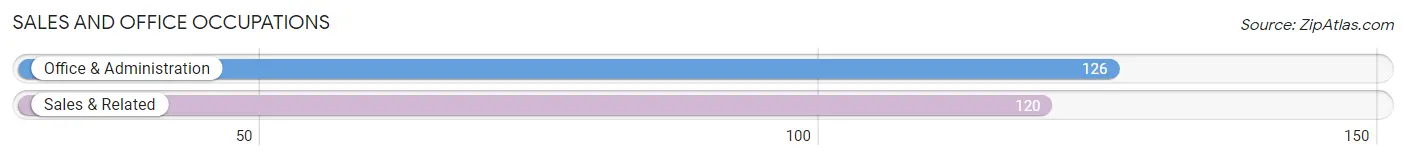
Sales and Office Occupations
The most common Sales and Office occupations in Carthage are Office & Administration (126 | 10.1%), and Sales & Related (120 | 9.7%).
Sales and Office Occupations by Sex
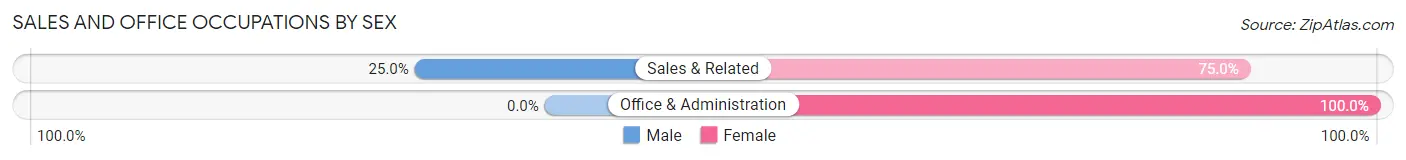
| Occupation | Male | Female |
| Sales & Related | 30 (25.0%) | 90 (75.0%) |
| Office & Administration | 0 (0.0%) | 126 (100.0%) |
| Total (Category) | 30 (12.2%) | 216 (87.8%) |
| Total (Overall) | 633 (50.9%) | 611 (49.1%) |
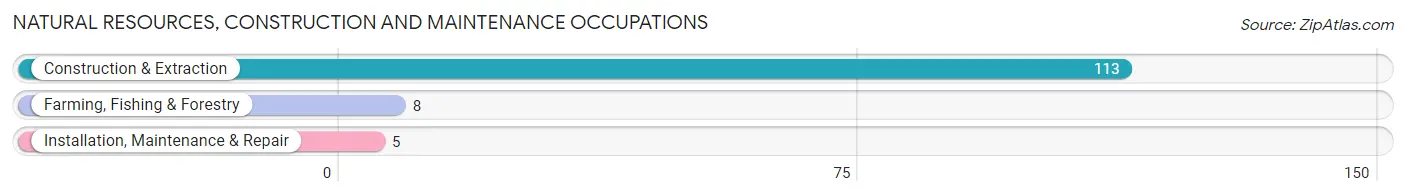
Natural Resources, Construction and Maintenance Occupations
The most common Natural Resources, Construction and Maintenance occupations in Carthage are Construction & Extraction (113 | 9.1%), Farming, Fishing & Forestry (8 | 0.6%), and Installation, Maintenance & Repair (5 | 0.4%).
Natural Resources, Construction and Maintenance Occupations by Sex
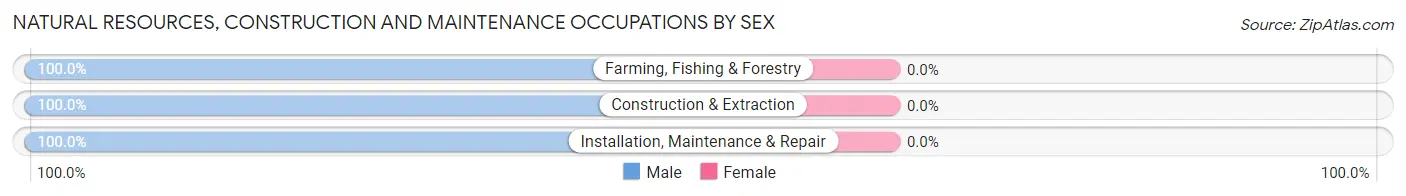
| Occupation | Male | Female |
| Farming, Fishing & Forestry | 8 (100.0%) | 0 (0.0%) |
| Construction & Extraction | 113 (100.0%) | 0 (0.0%) |
| Installation, Maintenance & Repair | 5 (100.0%) | 0 (0.0%) |
| Total (Category) | 126 (100.0%) | 0 (0.0%) |
| Total (Overall) | 633 (50.9%) | 611 (49.1%) |
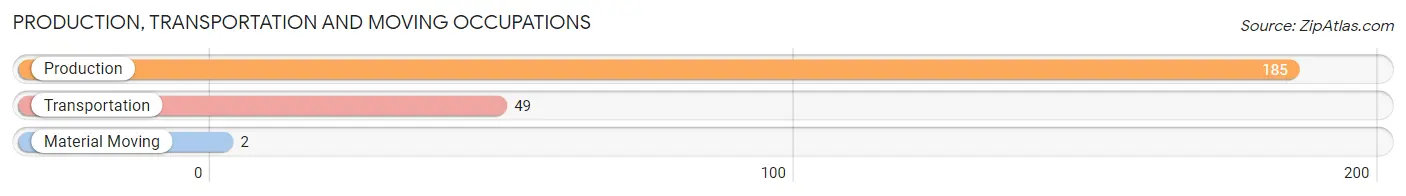
Production, Transportation and Moving Occupations
The most common Production, Transportation and Moving occupations in Carthage are Production (185 | 14.9%), Transportation (49 | 3.9%), and Material Moving (2 | 0.2%).
Production, Transportation and Moving Occupations by Sex
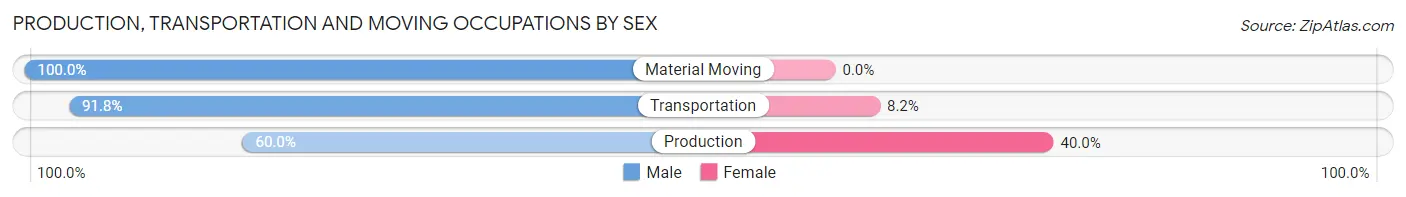
| Occupation | Male | Female |
| Production | 111 (60.0%) | 74 (40.0%) |
| Transportation | 45 (91.8%) | 4 (8.2%) |
| Material Moving | 2 (100.0%) | 0 (0.0%) |
| Total (Category) | 158 (66.9%) | 78 (33.1%) |
| Total (Overall) | 633 (50.9%) | 611 (49.1%) |
Employment Industries by Sex in Carthage
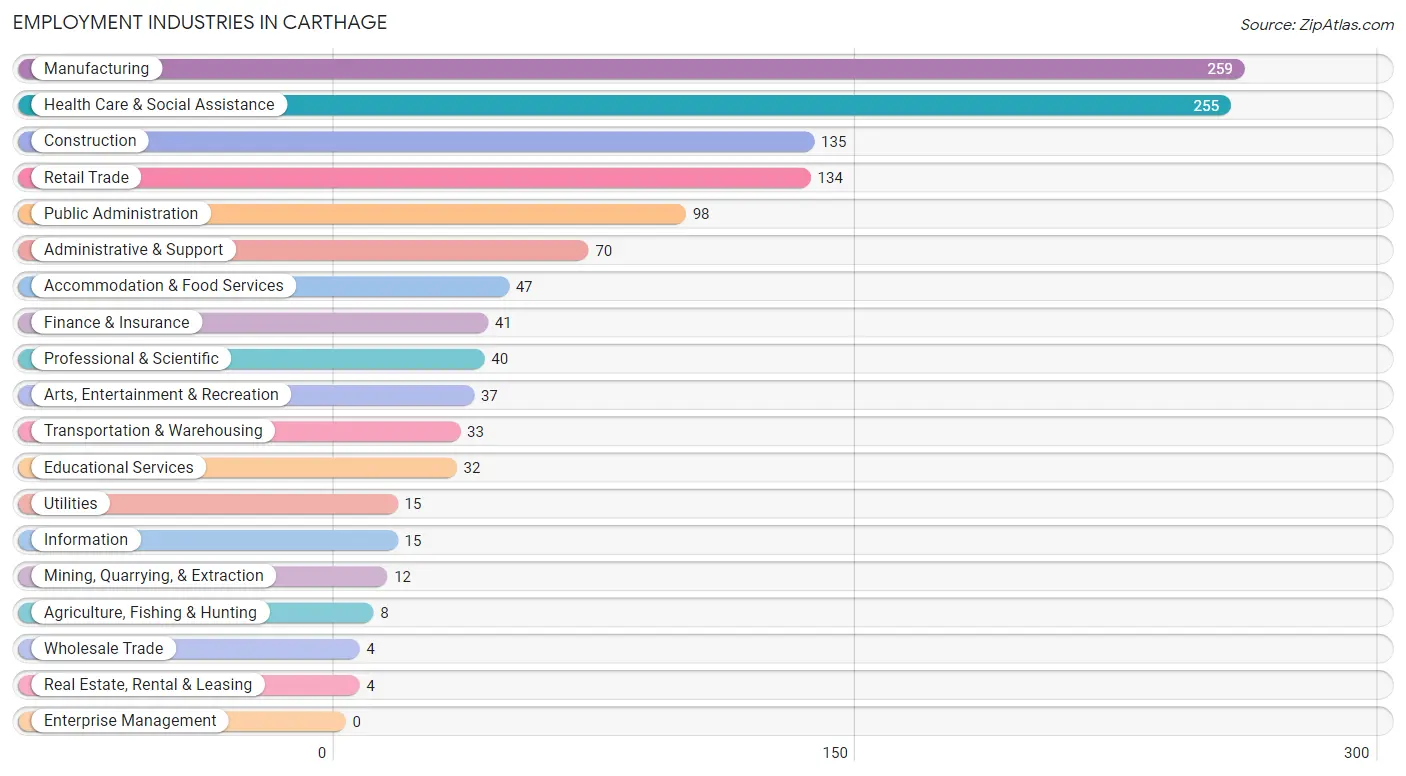
Employment Industries in Carthage
The major employment industries in Carthage include Manufacturing (259 | 20.8%), Health Care & Social Assistance (255 | 20.5%), Construction (135 | 10.8%), Retail Trade (134 | 10.8%), and Public Administration (98 | 7.9%).
Employment Industries by Sex in Carthage
The Carthage industries that see more men than women are Agriculture, Fishing & Hunting (100.0%), Mining, Quarrying, & Extraction (100.0%), and Real Estate, Rental & Leasing (100.0%), whereas the industries that tend to have a higher number of women are Wholesale Trade (100.0%), Finance & Insurance (90.2%), and Health Care & Social Assistance (87.8%).
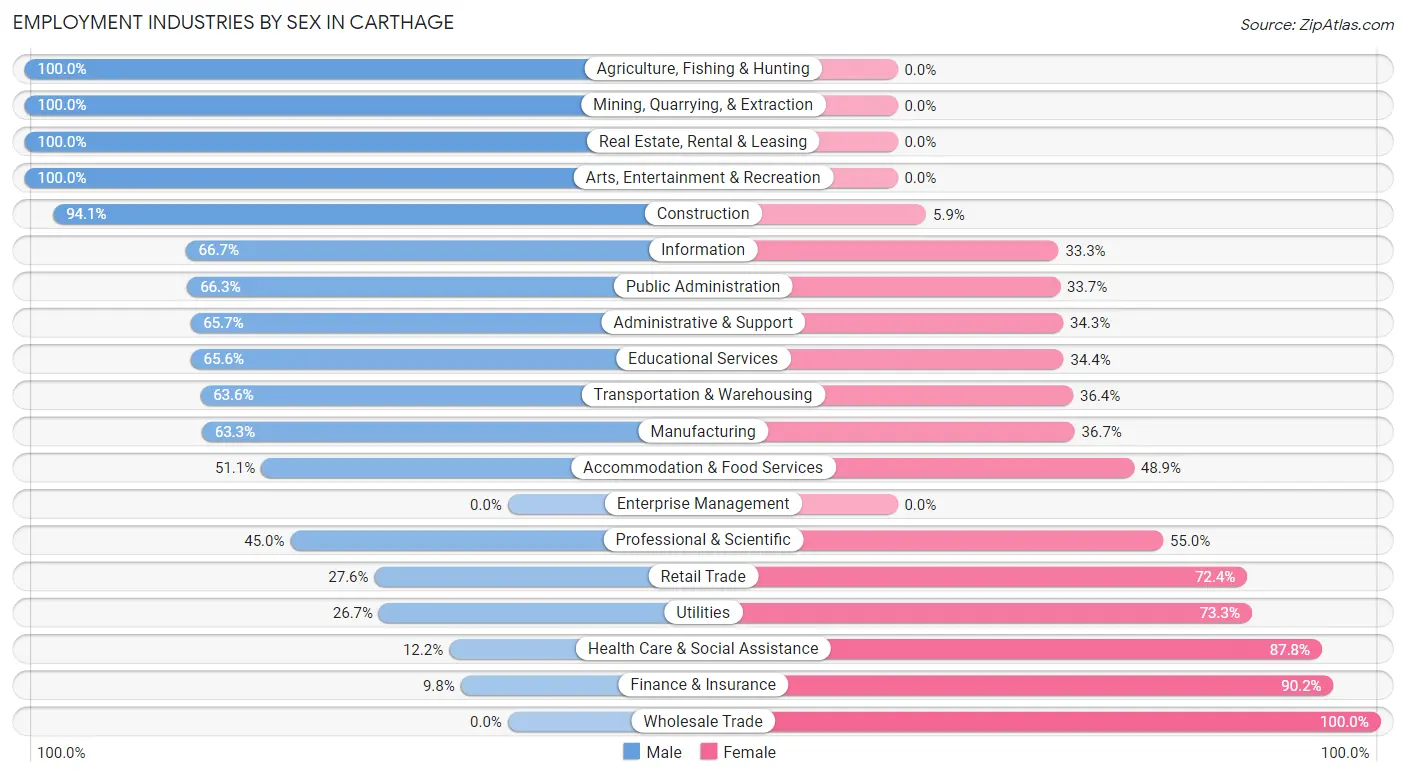
| Industry | Male | Female |
| Agriculture, Fishing & Hunting | 8 (100.0%) | 0 (0.0%) |
| Mining, Quarrying, & Extraction | 12 (100.0%) | 0 (0.0%) |
| Construction | 127 (94.1%) | 8 (5.9%) |
| Manufacturing | 164 (63.3%) | 95 (36.7%) |
| Wholesale Trade | 0 (0.0%) | 4 (100.0%) |
| Retail Trade | 37 (27.6%) | 97 (72.4%) |
| Transportation & Warehousing | 21 (63.6%) | 12 (36.4%) |
| Utilities | 4 (26.7%) | 11 (73.3%) |
| Information | 10 (66.7%) | 5 (33.3%) |
| Finance & Insurance | 4 (9.8%) | 37 (90.2%) |
| Real Estate, Rental & Leasing | 4 (100.0%) | 0 (0.0%) |
| Professional & Scientific | 18 (45.0%) | 22 (55.0%) |
| Enterprise Management | 0 (0.0%) | 0 (0.0%) |
| Administrative & Support | 46 (65.7%) | 24 (34.3%) |
| Educational Services | 21 (65.6%) | 11 (34.4%) |
| Health Care & Social Assistance | 31 (12.2%) | 224 (87.8%) |
| Arts, Entertainment & Recreation | 37 (100.0%) | 0 (0.0%) |
| Accommodation & Food Services | 24 (51.1%) | 23 (48.9%) |
| Public Administration | 65 (66.3%) | 33 (33.7%) |
| Total | 633 (50.9%) | 611 (49.1%) |
Education in Carthage
School Enrollment in Carthage
The most common levels of schooling among the 304 students in Carthage are high school (90 | 29.6%), kindergarten (68 | 22.4%), and elementary school (52 | 17.1%).
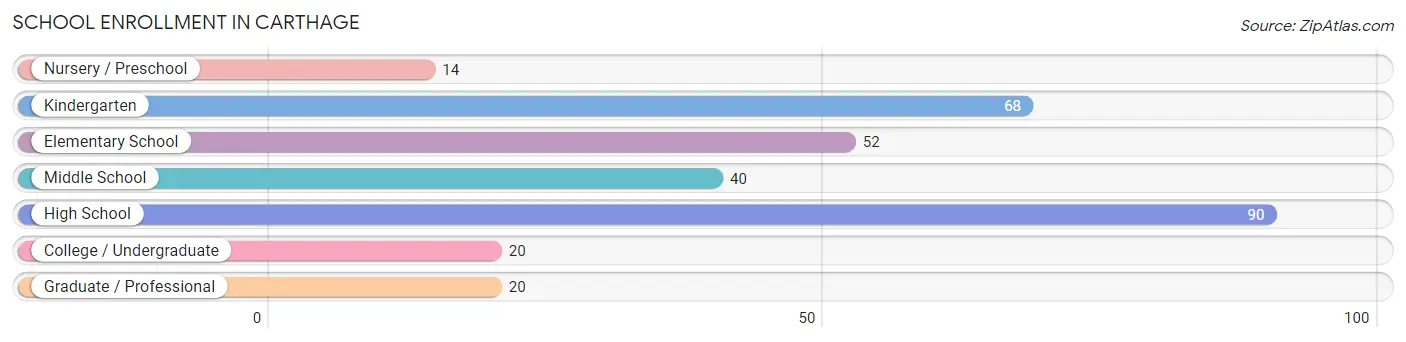
| School Level | # Students | % Students |
| Nursery / Preschool | 14 | 4.6% |
| Kindergarten | 68 | 22.4% |
| Elementary School | 52 | 17.1% |
| Middle School | 40 | 13.2% |
| High School | 90 | 29.6% |
| College / Undergraduate | 20 | 6.6% |
| Graduate / Professional | 20 | 6.6% |
| Total | 304 | 100.0% |
School Enrollment by Age by Funding Source in Carthage
Out of a total of 304 students who are enrolled in schools in Carthage, 22 (7.2%) attend a private institution, while the remaining 282 (92.8%) are enrolled in public schools. The age group of 20 to 24 year olds has the highest likelihood of being enrolled in private schools, with 7 (63.6% in the age bracket) enrolled. Conversely, the age group of 10 to 14 year olds has the lowest likelihood of being enrolled in a private school, with 55 (100.0% in the age bracket) attending a public institution.
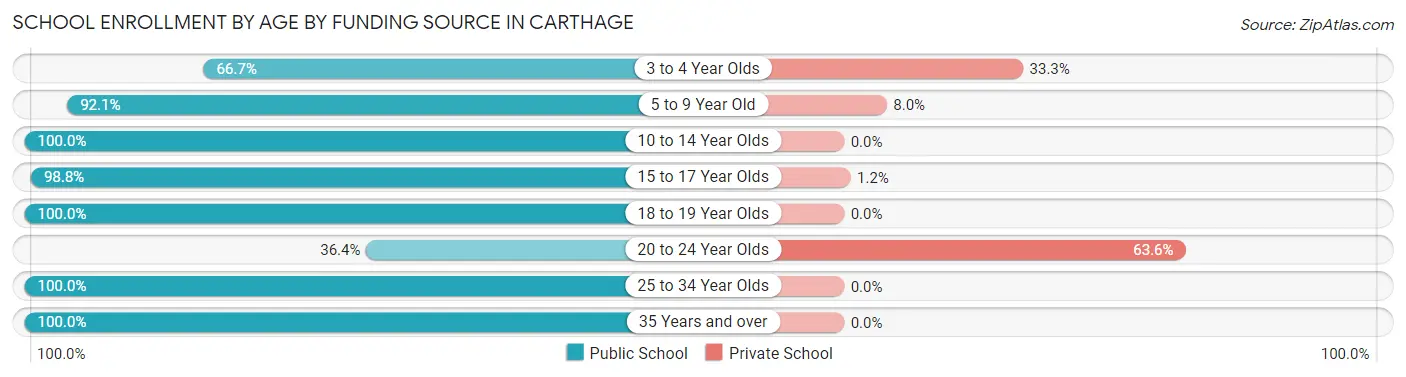
| Age Bracket | Public School | Private School |
| 3 to 4 Year Olds | 14 (66.7%) | 7 (33.3%) |
| 5 to 9 Year Old | 81 (92.0%) | 7 (8.0%) |
| 10 to 14 Year Olds | 55 (100.0%) | 0 (0.0%) |
| 15 to 17 Year Olds | 83 (98.8%) | 1 (1.2%) |
| 18 to 19 Year Olds | 24 (100.0%) | 0 (0.0%) |
| 20 to 24 Year Olds | 4 (36.4%) | 7 (63.6%) |
| 25 to 34 Year Olds | 5 (100.0%) | 0 (0.0%) |
| 35 Years and over | 16 (100.0%) | 0 (0.0%) |
| Total | 282 (92.8%) | 22 (7.2%) |
Educational Attainment by Field of Study in Carthage
Business (174 | 43.8%), education (42 | 10.6%), computers & mathematics (35 | 8.8%), psychology (33 | 8.3%), and bio, nature & agricultural (31 | 7.8%) are the most common fields of study among 397 individuals in Carthage who have obtained a bachelor's degree or higher.
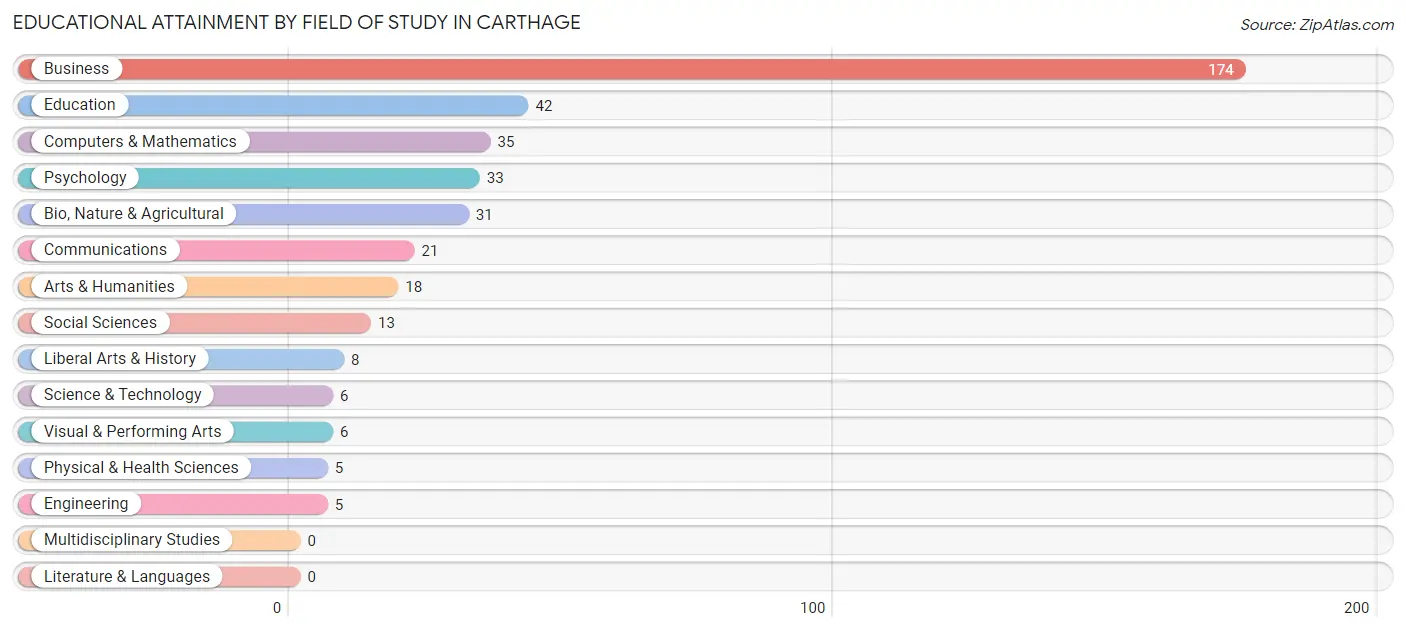
| Field of Study | # Graduates | % Graduates |
| Computers & Mathematics | 35 | 8.8% |
| Bio, Nature & Agricultural | 31 | 7.8% |
| Physical & Health Sciences | 5 | 1.3% |
| Psychology | 33 | 8.3% |
| Social Sciences | 13 | 3.3% |
| Engineering | 5 | 1.3% |
| Multidisciplinary Studies | 0 | 0.0% |
| Science & Technology | 6 | 1.5% |
| Business | 174 | 43.8% |
| Education | 42 | 10.6% |
| Literature & Languages | 0 | 0.0% |
| Liberal Arts & History | 8 | 2.0% |
| Visual & Performing Arts | 6 | 1.5% |
| Communications | 21 | 5.3% |
| Arts & Humanities | 18 | 4.5% |
| Total | 397 | 100.0% |
Transportation & Commute in Carthage
Vehicle Availability by Sex in Carthage
The most prevalent vehicle ownership categories in Carthage are males with 2 vehicles (291, accounting for 46.3%) and females with 2 vehicles (219, making up 47.6%).
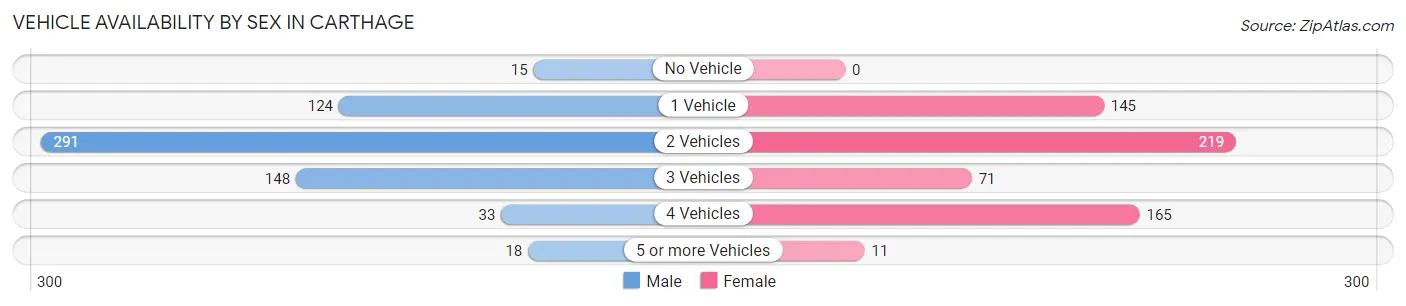
| Vehicles Available | Male | Female |
| No Vehicle | 15 (2.4%) | 0 (0.0%) |
| 1 Vehicle | 124 (19.7%) | 145 (23.7%) |
| 2 Vehicles | 291 (46.3%) | 219 (35.8%) |
| 3 Vehicles | 148 (23.5%) | 71 (11.6%) |
| 4 Vehicles | 33 (5.2%) | 165 (27.0%) |
| 5 or more Vehicles | 18 (2.9%) | 11 (1.8%) |
| Total | 629 (100.0%) | 611 (100.0%) |
Commute Time in Carthage
The most frequently occuring commute durations in Carthage are 45 to 59 minutes (218 commuters, 18.5%), 5 to 9 minutes (185 commuters, 15.7%), and 10 to 14 minutes (177 commuters, 15.0%).
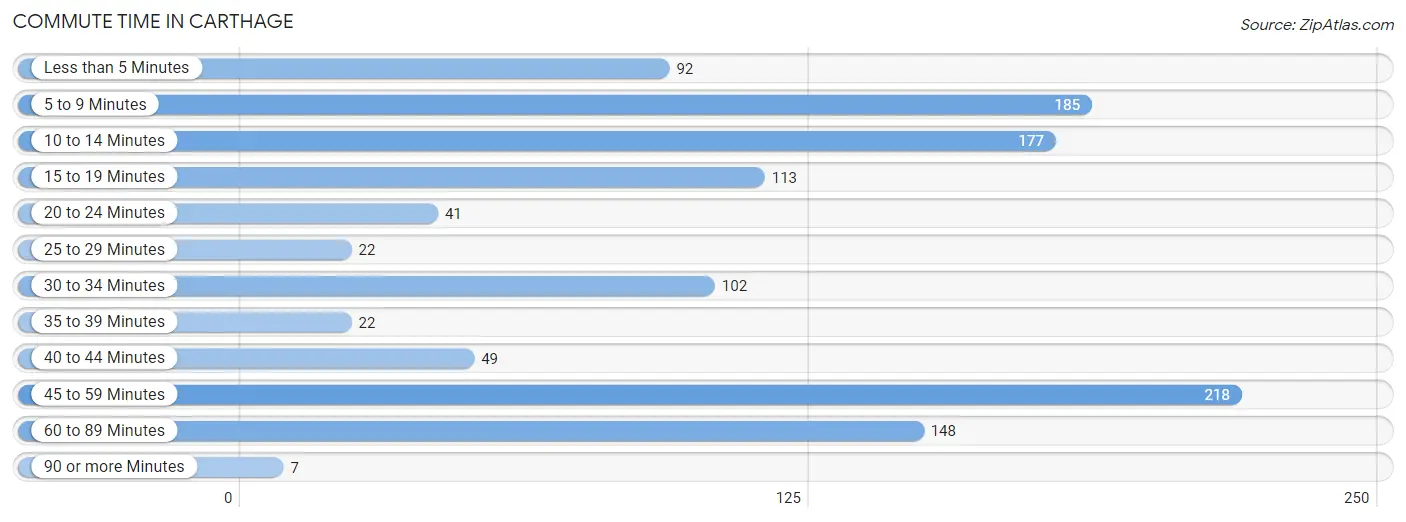
| Commute Time | # Commuters | % Commuters |
| Less than 5 Minutes | 92 | 7.8% |
| 5 to 9 Minutes | 185 | 15.7% |
| 10 to 14 Minutes | 177 | 15.0% |
| 15 to 19 Minutes | 113 | 9.6% |
| 20 to 24 Minutes | 41 | 3.5% |
| 25 to 29 Minutes | 22 | 1.9% |
| 30 to 34 Minutes | 102 | 8.7% |
| 35 to 39 Minutes | 22 | 1.9% |
| 40 to 44 Minutes | 49 | 4.2% |
| 45 to 59 Minutes | 218 | 18.5% |
| 60 to 89 Minutes | 148 | 12.6% |
| 90 or more Minutes | 7 | 0.6% |
Commute Time by Sex in Carthage
The most common commute times in Carthage are 60 to 89 minutes (106 commuters, 17.8%) for males and 45 to 59 minutes (171 commuters, 29.4%) for females.
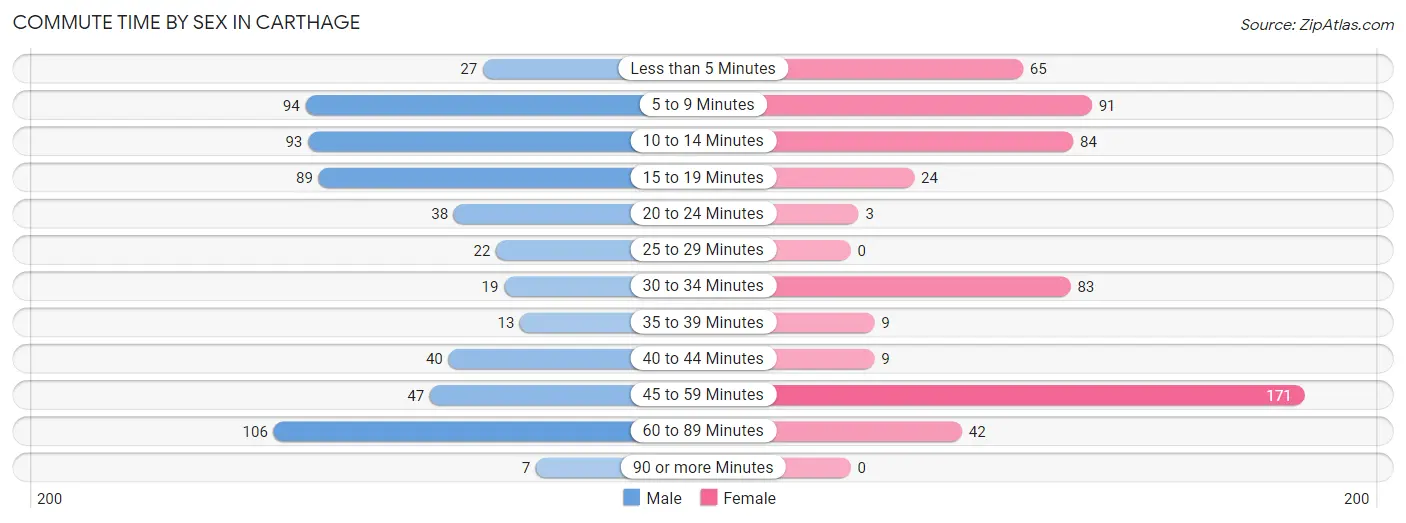
| Commute Time | Male | Female |
| Less than 5 Minutes | 27 (4.5%) | 65 (11.2%) |
| 5 to 9 Minutes | 94 (15.8%) | 91 (15.7%) |
| 10 to 14 Minutes | 93 (15.6%) | 84 (14.5%) |
| 15 to 19 Minutes | 89 (15.0%) | 24 (4.1%) |
| 20 to 24 Minutes | 38 (6.4%) | 3 (0.5%) |
| 25 to 29 Minutes | 22 (3.7%) | 0 (0.0%) |
| 30 to 34 Minutes | 19 (3.2%) | 83 (14.3%) |
| 35 to 39 Minutes | 13 (2.2%) | 9 (1.5%) |
| 40 to 44 Minutes | 40 (6.7%) | 9 (1.5%) |
| 45 to 59 Minutes | 47 (7.9%) | 171 (29.4%) |
| 60 to 89 Minutes | 106 (17.8%) | 42 (7.2%) |
| 90 or more Minutes | 7 (1.2%) | 0 (0.0%) |
Time of Departure to Work by Sex in Carthage
The most frequent times of departure to work in Carthage are 5:00 AM to 5:29 AM (76, 12.8%) for males and 7:00 AM to 7:29 AM (143, 24.6%) for females.
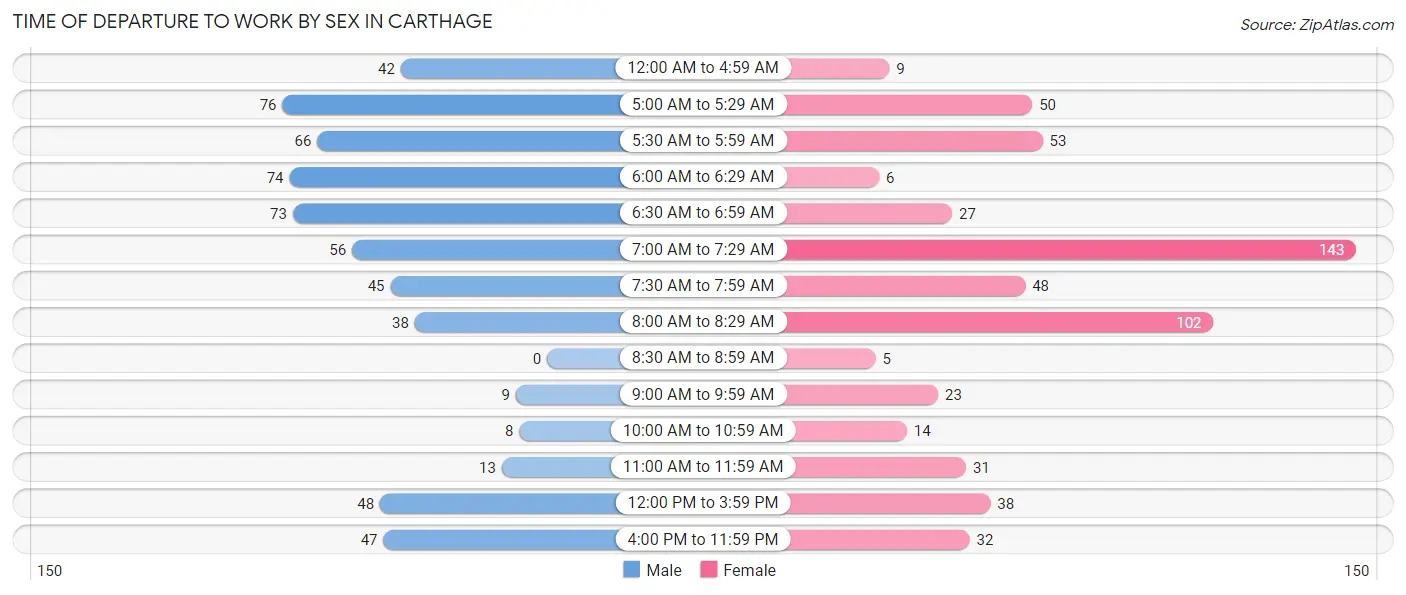
| Time of Departure | Male | Female |
| 12:00 AM to 4:59 AM | 42 (7.1%) | 9 (1.5%) |
| 5:00 AM to 5:29 AM | 76 (12.8%) | 50 (8.6%) |
| 5:30 AM to 5:59 AM | 66 (11.1%) | 53 (9.1%) |
| 6:00 AM to 6:29 AM | 74 (12.4%) | 6 (1.0%) |
| 6:30 AM to 6:59 AM | 73 (12.3%) | 27 (4.6%) |
| 7:00 AM to 7:29 AM | 56 (9.4%) | 143 (24.6%) |
| 7:30 AM to 7:59 AM | 45 (7.6%) | 48 (8.3%) |
| 8:00 AM to 8:29 AM | 38 (6.4%) | 102 (17.6%) |
| 8:30 AM to 8:59 AM | 0 (0.0%) | 5 (0.9%) |
| 9:00 AM to 9:59 AM | 9 (1.5%) | 23 (4.0%) |
| 10:00 AM to 10:59 AM | 8 (1.3%) | 14 (2.4%) |
| 11:00 AM to 11:59 AM | 13 (2.2%) | 31 (5.3%) |
| 12:00 PM to 3:59 PM | 48 (8.1%) | 38 (6.5%) |
| 4:00 PM to 11:59 PM | 47 (7.9%) | 32 (5.5%) |
| Total | 595 (100.0%) | 581 (100.0%) |
Housing Occupancy in Carthage
Occupancy by Ownership in Carthage
Of the total 970 dwellings in Carthage, owner-occupied units account for 562 (57.9%), while renter-occupied units make up 408 (42.1%).
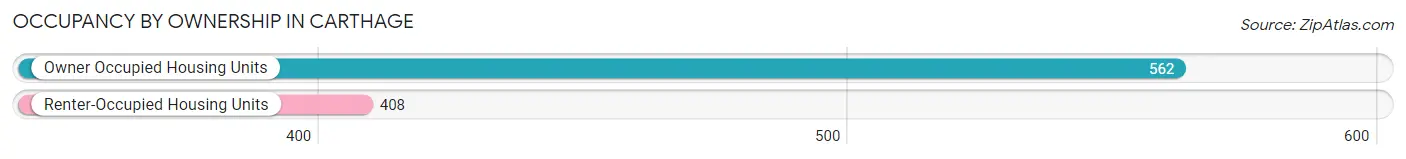
| Occupancy | # Housing Units | % Housing Units |
| Owner Occupied Housing Units | 562 | 57.9% |
| Renter-Occupied Housing Units | 408 | 42.1% |
| Total Occupied Housing Units | 970 | 100.0% |
Occupancy by Household Size in Carthage
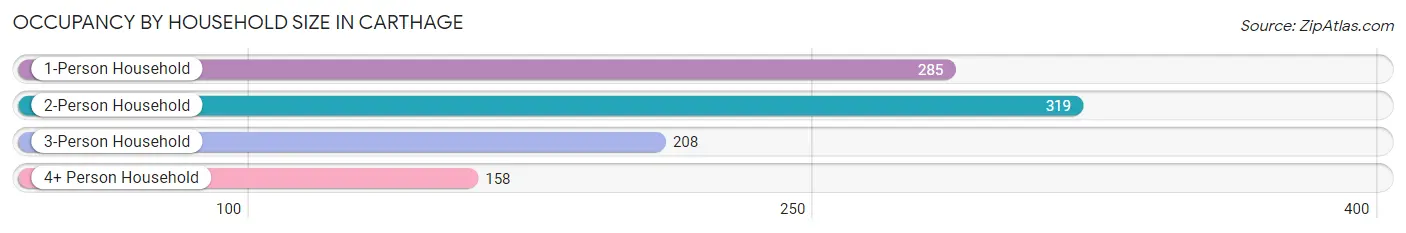
| Household Size | # Housing Units | % Housing Units |
| 1-Person Household | 285 | 29.4% |
| 2-Person Household | 319 | 32.9% |
| 3-Person Household | 208 | 21.4% |
| 4+ Person Household | 158 | 16.3% |
| Total Housing Units | 970 | 100.0% |
Occupancy by Ownership by Household Size in Carthage
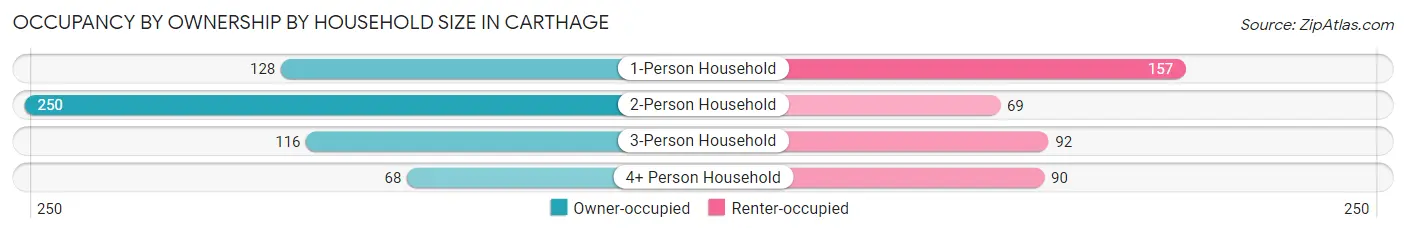
| Household Size | Owner-occupied | Renter-occupied |
| 1-Person Household | 128 (44.9%) | 157 (55.1%) |
| 2-Person Household | 250 (78.4%) | 69 (21.6%) |
| 3-Person Household | 116 (55.8%) | 92 (44.2%) |
| 4+ Person Household | 68 (43.0%) | 90 (57.0%) |
| Total Housing Units | 562 (57.9%) | 408 (42.1%) |
Occupancy by Educational Attainment in Carthage
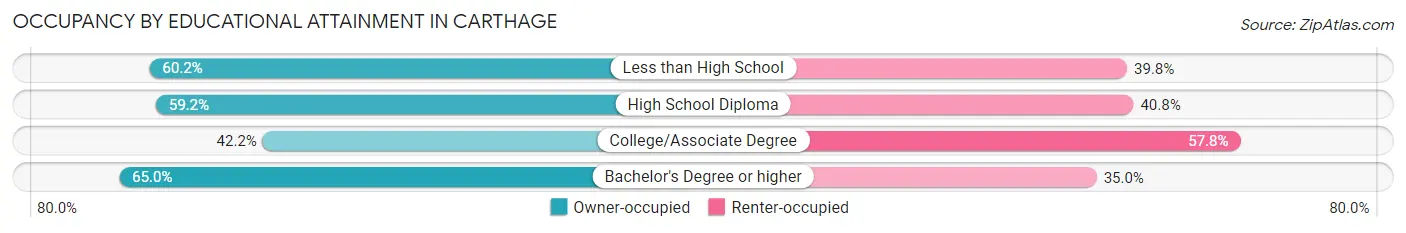
| Household Size | Owner-occupied | Renter-occupied |
| Less than High School | 59 (60.2%) | 39 (39.8%) |
| High School Diploma | 277 (59.2%) | 191 (40.8%) |
| College/Associate Degree | 68 (42.2%) | 93 (57.8%) |
| Bachelor's Degree or higher | 158 (65.0%) | 85 (35.0%) |
Occupancy by Age of Householder in Carthage
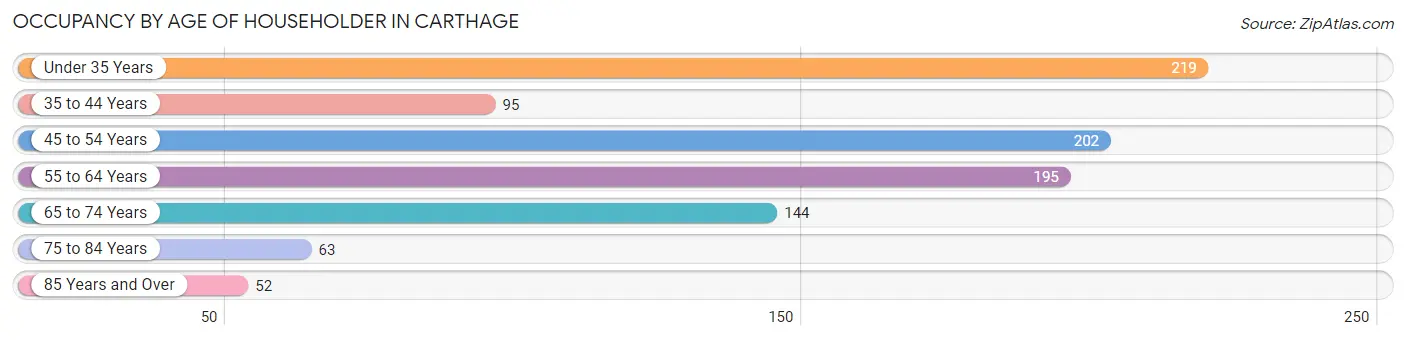
| Age Bracket | # Households | % Households |
| Under 35 Years | 219 | 22.6% |
| 35 to 44 Years | 95 | 9.8% |
| 45 to 54 Years | 202 | 20.8% |
| 55 to 64 Years | 195 | 20.1% |
| 65 to 74 Years | 144 | 14.8% |
| 75 to 84 Years | 63 | 6.5% |
| 85 Years and Over | 52 | 5.4% |
| Total | 970 | 100.0% |
Housing Finances in Carthage
Median Income by Occupancy in Carthage
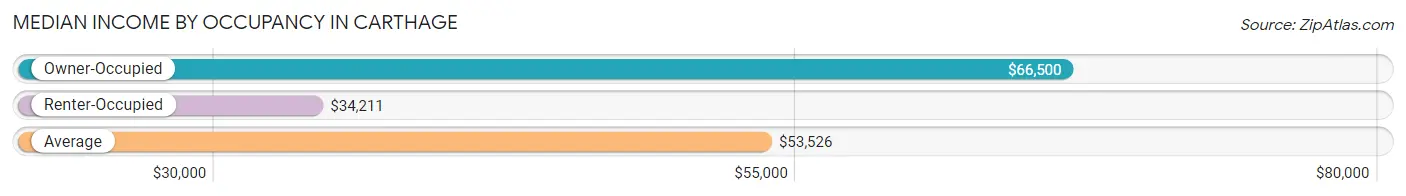
| Occupancy Type | # Households | Median Income |
| Owner-Occupied | 562 (57.9%) | $66,500 |
| Renter-Occupied | 408 (42.1%) | $34,211 |
| Average | 970 (100.0%) | $53,526 |
Occupancy by Householder Income Bracket in Carthage
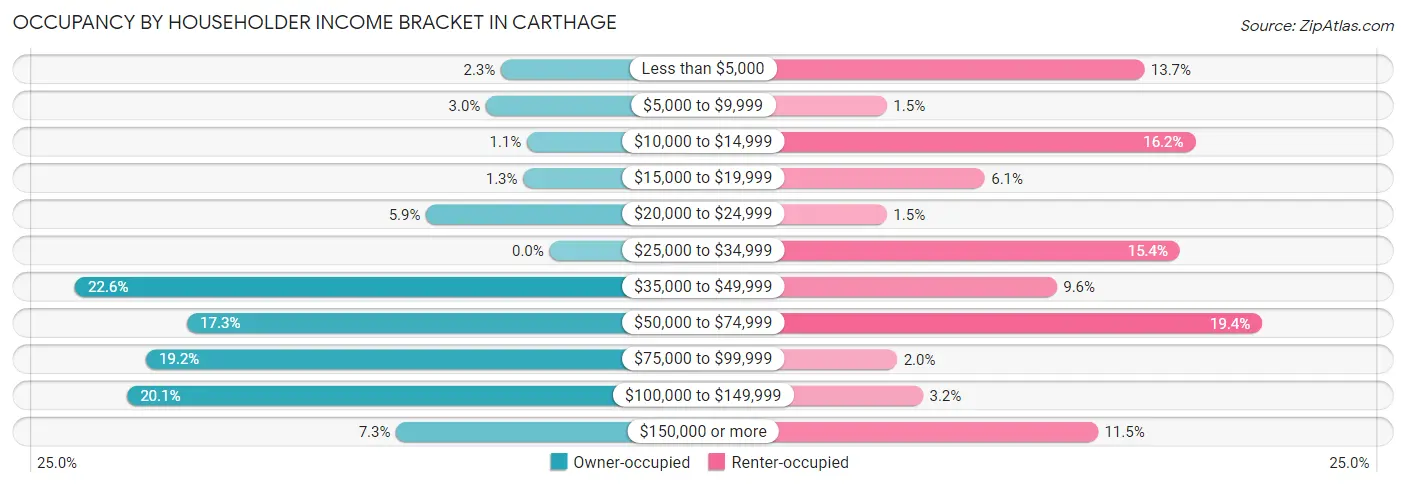
| Income Bracket | Owner-occupied | Renter-occupied |
| Less than $5,000 | 13 (2.3%) | 56 (13.7%) |
| $5,000 to $9,999 | 17 (3.0%) | 6 (1.5%) |
| $10,000 to $14,999 | 6 (1.1%) | 66 (16.2%) |
| $15,000 to $19,999 | 7 (1.3%) | 25 (6.1%) |
| $20,000 to $24,999 | 33 (5.9%) | 6 (1.5%) |
| $25,000 to $34,999 | 0 (0.0%) | 63 (15.4%) |
| $35,000 to $49,999 | 127 (22.6%) | 39 (9.6%) |
| $50,000 to $74,999 | 97 (17.3%) | 79 (19.4%) |
| $75,000 to $99,999 | 108 (19.2%) | 8 (2.0%) |
| $100,000 to $149,999 | 113 (20.1%) | 13 (3.2%) |
| $150,000 or more | 41 (7.3%) | 47 (11.5%) |
| Total | 562 (100.0%) | 408 (100.0%) |
Monthly Housing Cost Tiers in Carthage
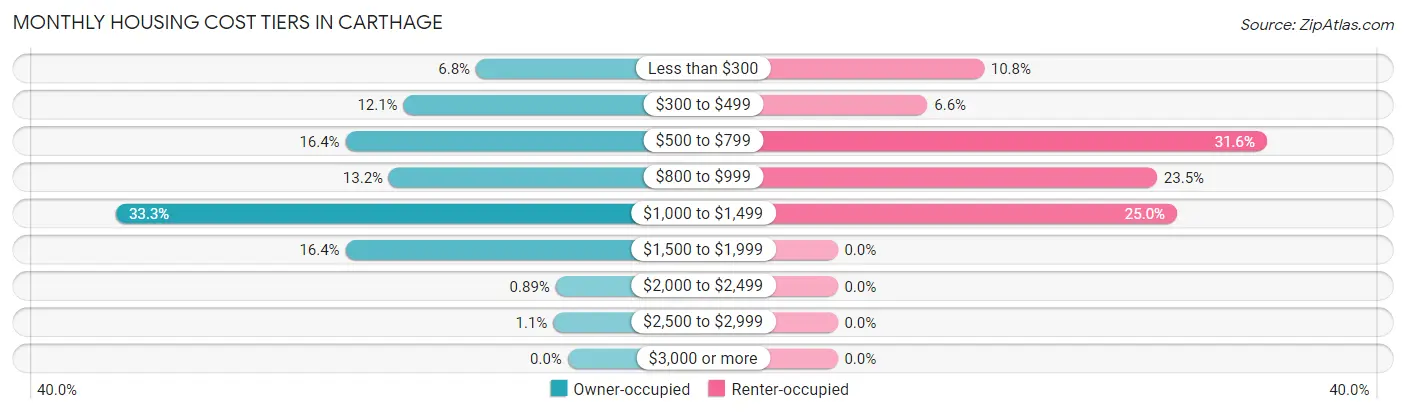
| Monthly Cost | Owner-occupied | Renter-occupied |
| Less than $300 | 38 (6.8%) | 44 (10.8%) |
| $300 to $499 | 68 (12.1%) | 27 (6.6%) |
| $500 to $799 | 92 (16.4%) | 129 (31.6%) |
| $800 to $999 | 74 (13.2%) | 96 (23.5%) |
| $1,000 to $1,499 | 187 (33.3%) | 102 (25.0%) |
| $1,500 to $1,999 | 92 (16.4%) | 0 (0.0%) |
| $2,000 to $2,499 | 5 (0.9%) | 0 (0.0%) |
| $2,500 to $2,999 | 6 (1.1%) | 0 (0.0%) |
| $3,000 or more | 0 (0.0%) | 0 (0.0%) |
| Total | 562 (100.0%) | 408 (100.0%) |
Physical Housing Characteristics in Carthage
Housing Structures in Carthage
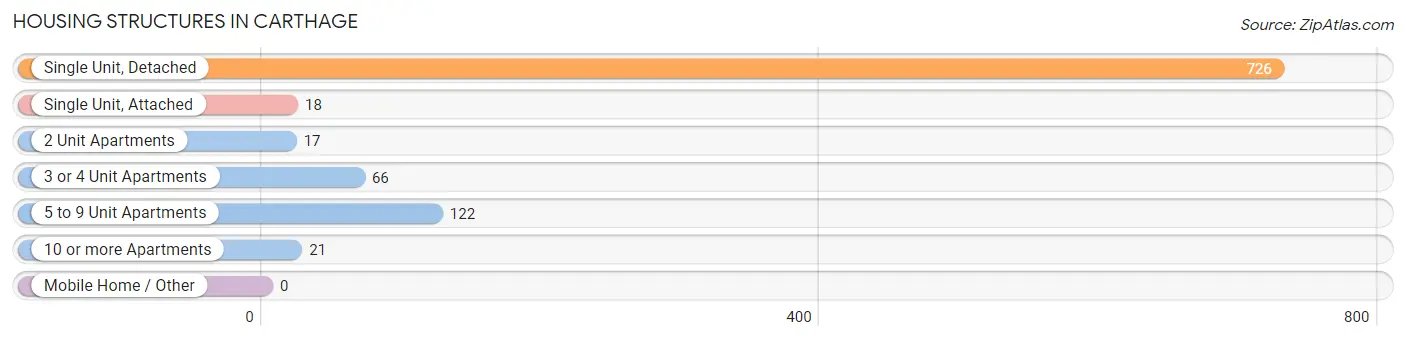
| Structure Type | # Housing Units | % Housing Units |
| Single Unit, Detached | 726 | 74.9% |
| Single Unit, Attached | 18 | 1.9% |
| 2 Unit Apartments | 17 | 1.8% |
| 3 or 4 Unit Apartments | 66 | 6.8% |
| 5 to 9 Unit Apartments | 122 | 12.6% |
| 10 or more Apartments | 21 | 2.2% |
| Mobile Home / Other | 0 | 0.0% |
| Total | 970 | 100.0% |
Housing Structures by Occupancy in Carthage
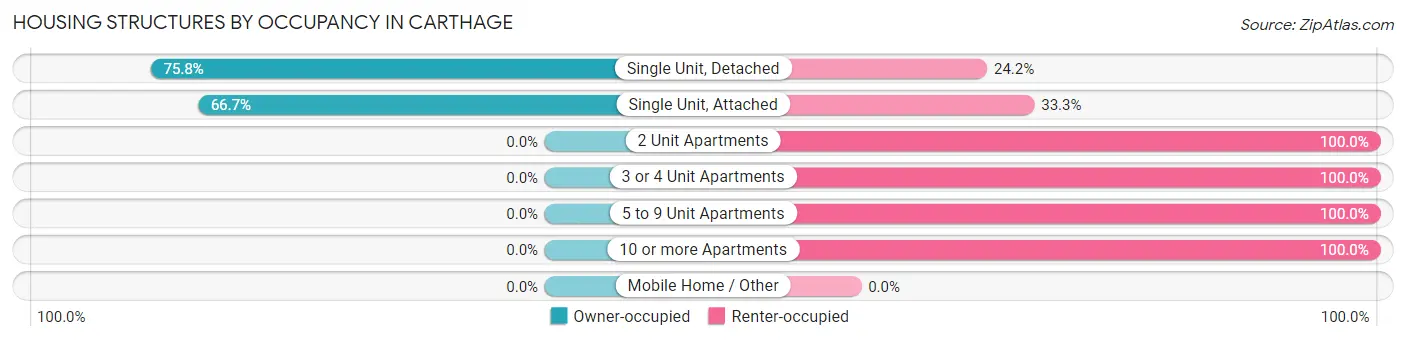
| Structure Type | Owner-occupied | Renter-occupied |
| Single Unit, Detached | 550 (75.8%) | 176 (24.2%) |
| Single Unit, Attached | 12 (66.7%) | 6 (33.3%) |
| 2 Unit Apartments | 0 (0.0%) | 17 (100.0%) |
| 3 or 4 Unit Apartments | 0 (0.0%) | 66 (100.0%) |
| 5 to 9 Unit Apartments | 0 (0.0%) | 122 (100.0%) |
| 10 or more Apartments | 0 (0.0%) | 21 (100.0%) |
| Mobile Home / Other | 0 (0.0%) | 0 (0.0%) |
| Total | 562 (57.9%) | 408 (42.1%) |
Housing Structures by Number of Rooms in Carthage
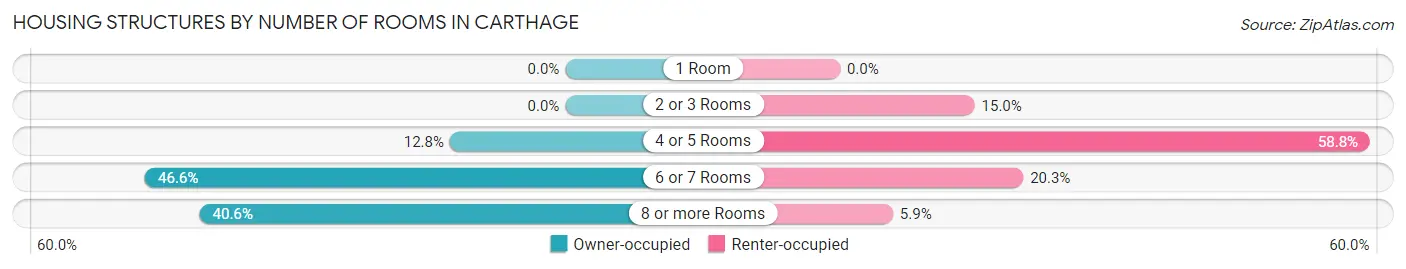
| Number of Rooms | Owner-occupied | Renter-occupied |
| 1 Room | 0 (0.0%) | 0 (0.0%) |
| 2 or 3 Rooms | 0 (0.0%) | 61 (14.9%) |
| 4 or 5 Rooms | 72 (12.8%) | 240 (58.8%) |
| 6 or 7 Rooms | 262 (46.6%) | 83 (20.3%) |
| 8 or more Rooms | 228 (40.6%) | 24 (5.9%) |
| Total | 562 (100.0%) | 408 (100.0%) |
Housing Structure by Heating Type in Carthage
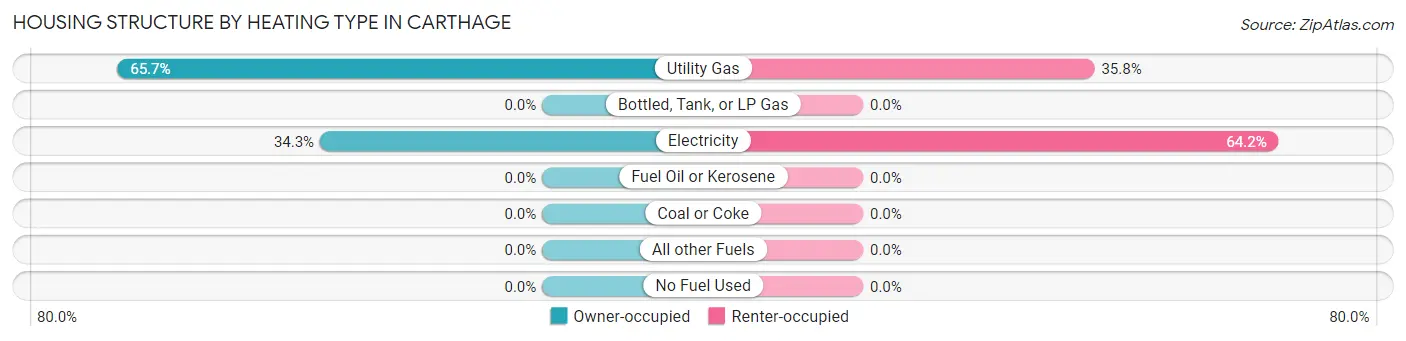
| Heating Type | Owner-occupied | Renter-occupied |
| Utility Gas | 369 (65.7%) | 146 (35.8%) |
| Bottled, Tank, or LP Gas | 0 (0.0%) | 0 (0.0%) |
| Electricity | 193 (34.3%) | 262 (64.2%) |
| Fuel Oil or Kerosene | 0 (0.0%) | 0 (0.0%) |
| Coal or Coke | 0 (0.0%) | 0 (0.0%) |
| All other Fuels | 0 (0.0%) | 0 (0.0%) |
| No Fuel Used | 0 (0.0%) | 0 (0.0%) |
| Total | 562 (100.0%) | 408 (100.0%) |
Household Vehicle Usage in Carthage
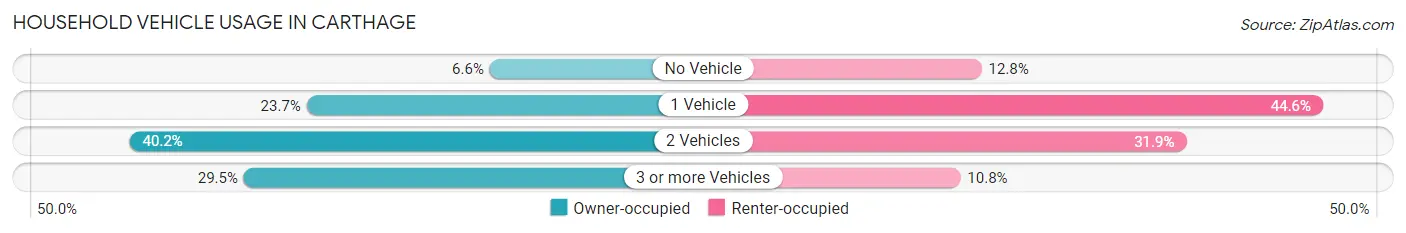
| Vehicles per Household | Owner-occupied | Renter-occupied |
| No Vehicle | 37 (6.6%) | 52 (12.8%) |
| 1 Vehicle | 133 (23.7%) | 182 (44.6%) |
| 2 Vehicles | 226 (40.2%) | 130 (31.9%) |
| 3 or more Vehicles | 166 (29.5%) | 44 (10.8%) |
| Total | 562 (100.0%) | 408 (100.0%) |
Real Estate & Mortgages in Carthage
Real Estate and Mortgage Overview in Carthage
| Characteristic | Without Mortgage | With Mortgage |
| Housing Units | 180 | 382 |
| Median Property Value | $176,400 | $195,800 |
| Median Household Income | $45,227 | $24 |
| Monthly Housing Costs | $438 | $0 |
| Real Estate Taxes | $895 | $9 |
Property Value by Mortgage Status in Carthage
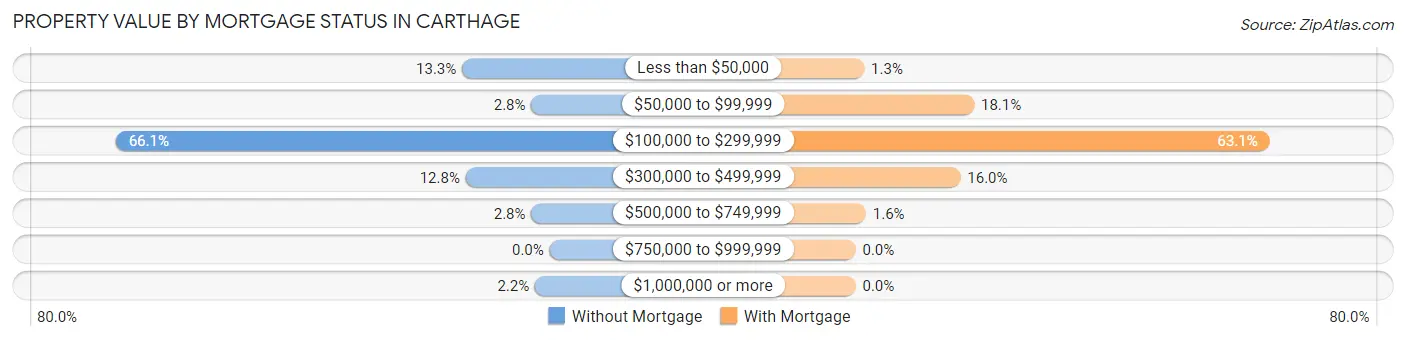
| Property Value | Without Mortgage | With Mortgage |
| Less than $50,000 | 24 (13.3%) | 5 (1.3%) |
| $50,000 to $99,999 | 5 (2.8%) | 69 (18.1%) |
| $100,000 to $299,999 | 119 (66.1%) | 241 (63.1%) |
| $300,000 to $499,999 | 23 (12.8%) | 61 (16.0%) |
| $500,000 to $749,999 | 5 (2.8%) | 6 (1.6%) |
| $750,000 to $999,999 | 0 (0.0%) | 0 (0.0%) |
| $1,000,000 or more | 4 (2.2%) | 0 (0.0%) |
| Total | 180 (100.0%) | 382 (100.0%) |
Household Income by Mortgage Status in Carthage
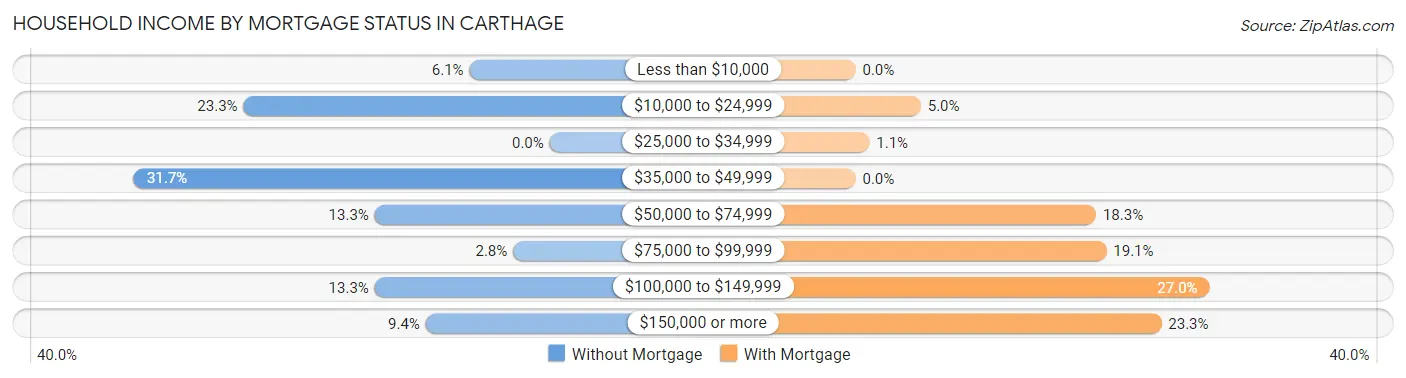
| Household Income | Without Mortgage | With Mortgage |
| Less than $10,000 | 11 (6.1%) | 0 (0.0%) |
| $10,000 to $24,999 | 42 (23.3%) | 19 (5.0%) |
| $25,000 to $34,999 | 0 (0.0%) | 4 (1.1%) |
| $35,000 to $49,999 | 57 (31.7%) | 0 (0.0%) |
| $50,000 to $74,999 | 24 (13.3%) | 70 (18.3%) |
| $75,000 to $99,999 | 5 (2.8%) | 73 (19.1%) |
| $100,000 to $149,999 | 24 (13.3%) | 103 (27.0%) |
| $150,000 or more | 17 (9.4%) | 89 (23.3%) |
| Total | 180 (100.0%) | 382 (100.0%) |
Property Value to Household Income Ratio in Carthage
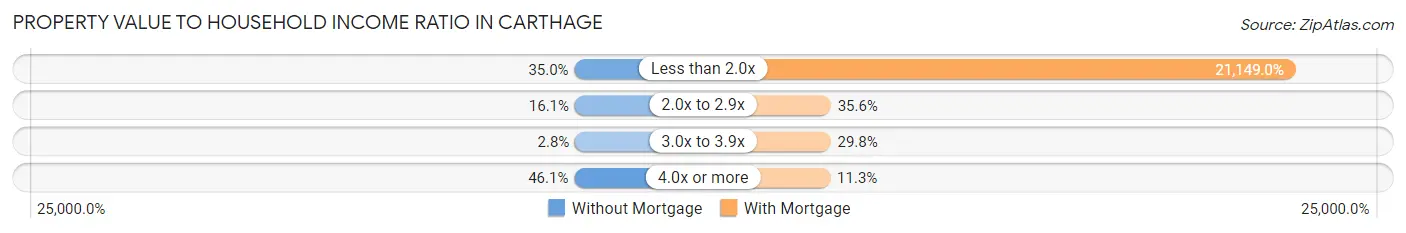
| Value-to-Income Ratio | Without Mortgage | With Mortgage |
| Less than 2.0x | 63 (35.0%) | 80,789 (21,148.9%) |
| 2.0x to 2.9x | 29 (16.1%) | 136 (35.6%) |
| 3.0x to 3.9x | 5 (2.8%) | 114 (29.8%) |
| 4.0x or more | 83 (46.1%) | 43 (11.3%) |
| Total | 180 (100.0%) | 382 (100.0%) |
Real Estate Taxes by Mortgage Status in Carthage
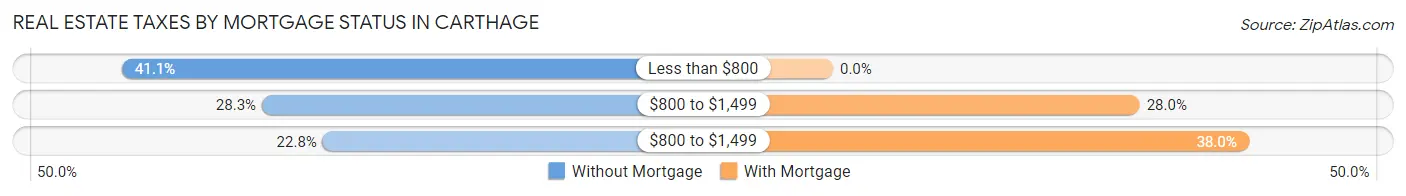
| Property Taxes | Without Mortgage | With Mortgage |
| Less than $800 | 74 (41.1%) | 0 (0.0%) |
| $800 to $1,499 | 51 (28.3%) | 107 (28.0%) |
| $800 to $1,499 | 41 (22.8%) | 145 (38.0%) |
| Total | 180 (100.0%) | 382 (100.0%) |
Health & Disability in Carthage
Health Insurance Coverage by Age in Carthage
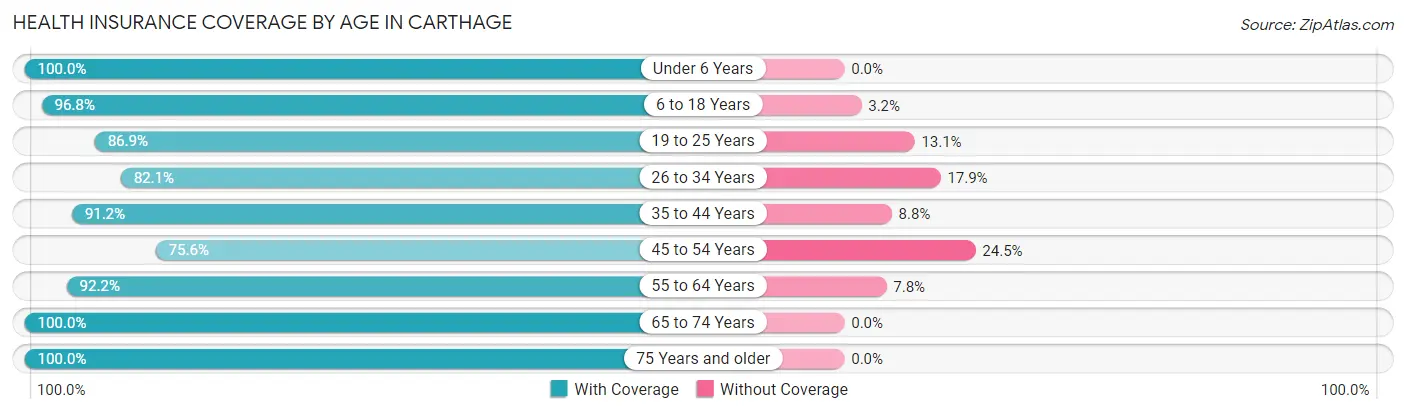
| Age Bracket | With Coverage | Without Coverage |
| Under 6 Years | 210 (100.0%) | 0 (0.0%) |
| 6 to 18 Years | 244 (96.8%) | 8 (3.2%) |
| 19 to 25 Years | 226 (86.9%) | 34 (13.1%) |
| 26 to 34 Years | 206 (82.1%) | 45 (17.9%) |
| 35 to 44 Years | 279 (91.2%) | 27 (8.8%) |
| 45 to 54 Years | 207 (75.5%) | 67 (24.4%) |
| 55 to 64 Years | 294 (92.2%) | 25 (7.8%) |
| 65 to 74 Years | 273 (100.0%) | 0 (0.0%) |
| 75 Years and older | 139 (100.0%) | 0 (0.0%) |
| Total | 2,078 (91.0%) | 206 (9.0%) |
Health Insurance Coverage by Citizenship Status in Carthage
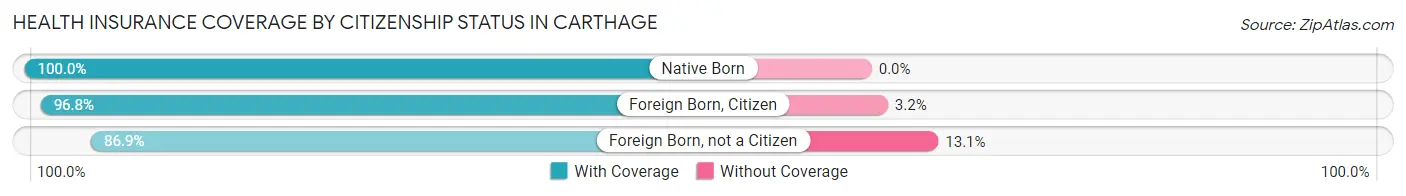
| Citizenship Status | With Coverage | Without Coverage |
| Native Born | 210 (100.0%) | 0 (0.0%) |
| Foreign Born, Citizen | 244 (96.8%) | 8 (3.2%) |
| Foreign Born, not a Citizen | 226 (86.9%) | 34 (13.1%) |
Health Insurance Coverage by Household Income in Carthage
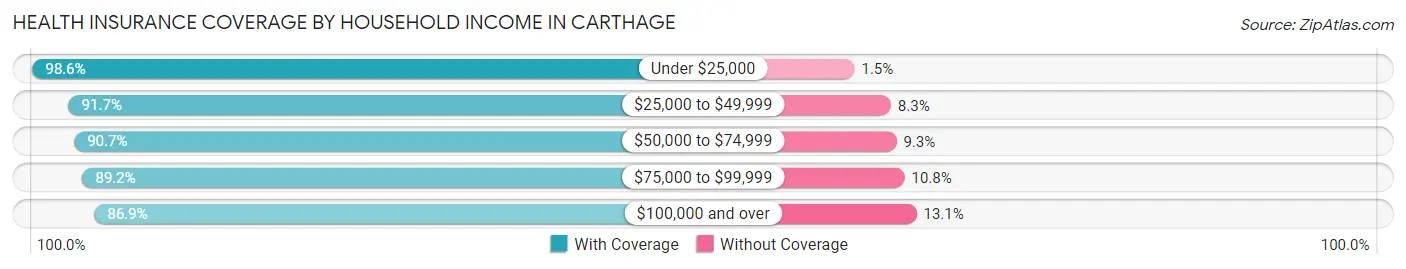
| Household Income | With Coverage | Without Coverage |
| Under $25,000 | 339 (98.6%) | 5 (1.5%) |
| $25,000 to $49,999 | 522 (91.7%) | 47 (8.3%) |
| $50,000 to $74,999 | 439 (90.7%) | 45 (9.3%) |
| $75,000 to $99,999 | 272 (89.2%) | 33 (10.8%) |
| $100,000 and over | 506 (86.9%) | 76 (13.1%) |
Public vs Private Health Insurance Coverage by Age in Carthage
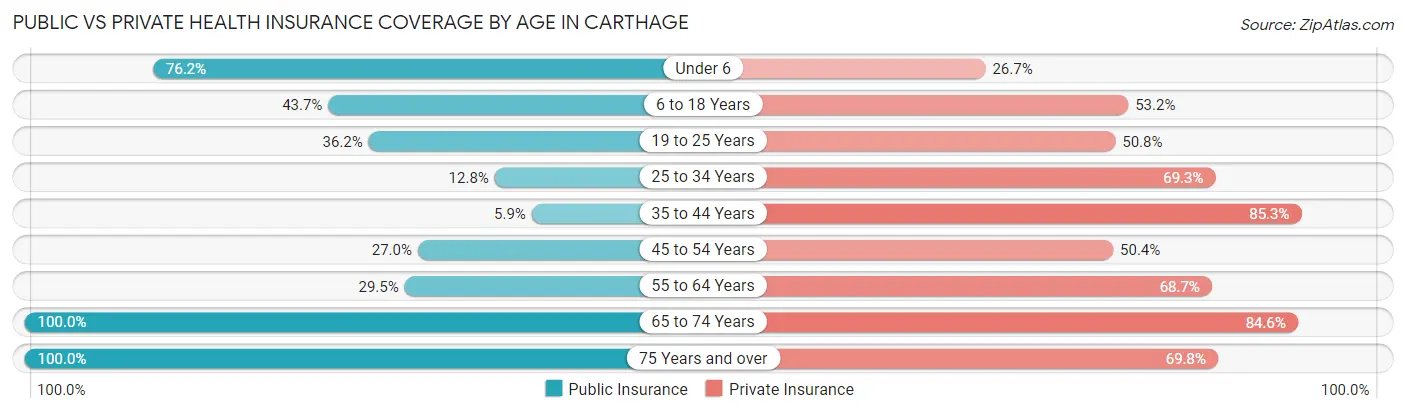
| Age Bracket | Public Insurance | Private Insurance |
| Under 6 | 160 (76.2%) | 56 (26.7%) |
| 6 to 18 Years | 110 (43.6%) | 134 (53.2%) |
| 19 to 25 Years | 94 (36.1%) | 132 (50.8%) |
| 25 to 34 Years | 32 (12.8%) | 174 (69.3%) |
| 35 to 44 Years | 18 (5.9%) | 261 (85.3%) |
| 45 to 54 Years | 74 (27.0%) | 138 (50.4%) |
| 55 to 64 Years | 94 (29.5%) | 219 (68.6%) |
| 65 to 74 Years | 273 (100.0%) | 231 (84.6%) |
| 75 Years and over | 139 (100.0%) | 97 (69.8%) |
| Total | 994 (43.5%) | 1,442 (63.1%) |
Disability Status by Sex by Age in Carthage
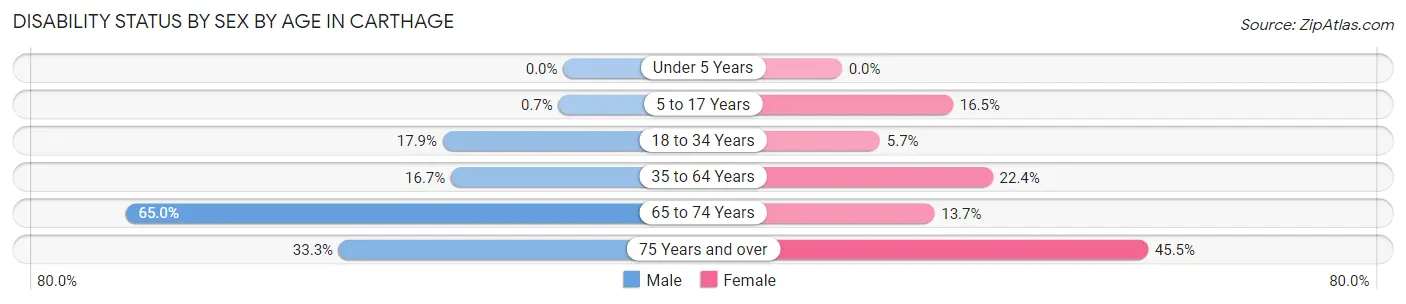
| Age Bracket | Male | Female |
| Under 5 Years | 0 (0.0%) | 0 (0.0%) |
| 5 to 17 Years | 1 (0.7%) | 15 (16.5%) |
| 18 to 34 Years | 51 (17.9%) | 16 (5.7%) |
| 35 to 64 Years | 59 (16.7%) | 122 (22.4%) |
| 65 to 74 Years | 78 (65.0%) | 21 (13.7%) |
| 75 Years and over | 6 (33.3%) | 55 (45.5%) |
Disability Class by Sex by Age in Carthage
Disability Class: Hearing Difficulty
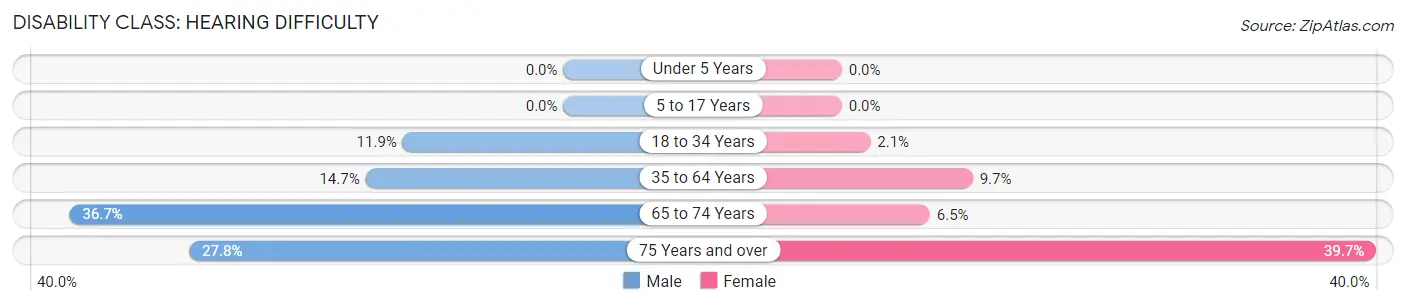
| Age Bracket | Male | Female |
| Under 5 Years | 0 (0.0%) | 0 (0.0%) |
| 5 to 17 Years | 0 (0.0%) | 0 (0.0%) |
| 18 to 34 Years | 34 (11.9%) | 6 (2.1%) |
| 35 to 64 Years | 52 (14.7%) | 53 (9.7%) |
| 65 to 74 Years | 44 (36.7%) | 10 (6.5%) |
| 75 Years and over | 5 (27.8%) | 48 (39.7%) |
Disability Class: Vision Difficulty
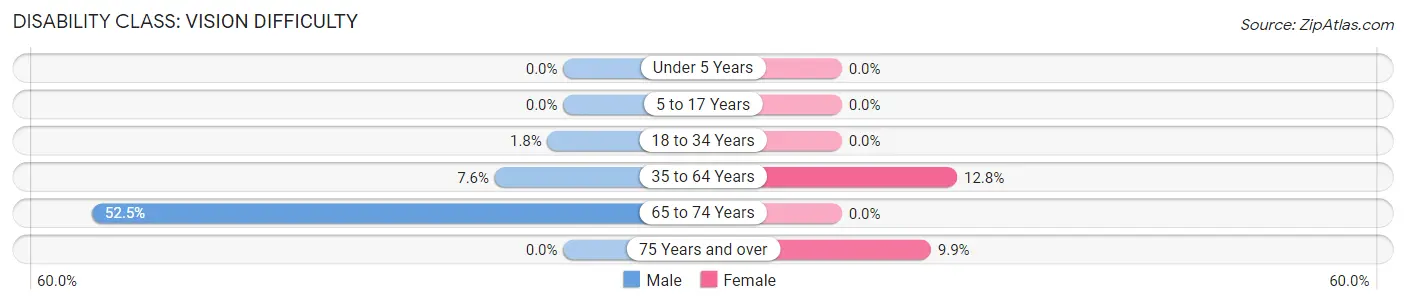
| Age Bracket | Male | Female |
| Under 5 Years | 0 (0.0%) | 0 (0.0%) |
| 5 to 17 Years | 0 (0.0%) | 0 (0.0%) |
| 18 to 34 Years | 5 (1.8%) | 0 (0.0%) |
| 35 to 64 Years | 27 (7.6%) | 70 (12.8%) |
| 65 to 74 Years | 63 (52.5%) | 0 (0.0%) |
| 75 Years and over | 0 (0.0%) | 12 (9.9%) |
Disability Class: Cognitive Difficulty
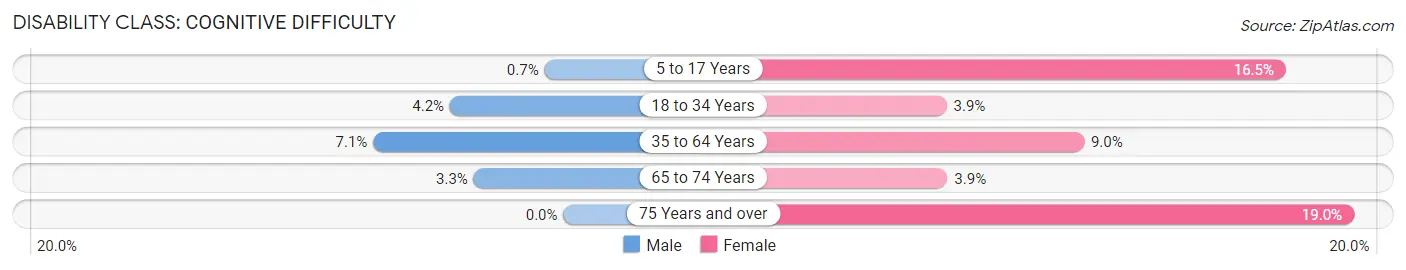
| Age Bracket | Male | Female |
| 5 to 17 Years | 1 (0.7%) | 15 (16.5%) |
| 18 to 34 Years | 12 (4.2%) | 11 (3.9%) |
| 35 to 64 Years | 25 (7.1%) | 49 (9.0%) |
| 65 to 74 Years | 4 (3.3%) | 6 (3.9%) |
| 75 Years and over | 0 (0.0%) | 23 (19.0%) |
Disability Class: Ambulatory Difficulty
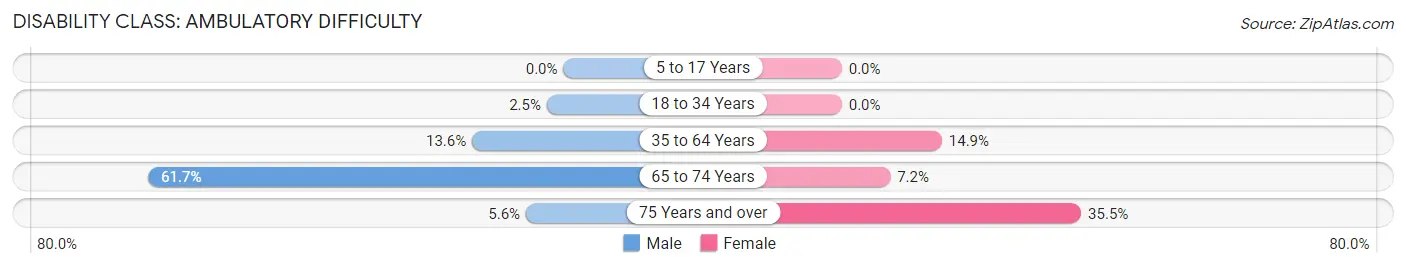
| Age Bracket | Male | Female |
| 5 to 17 Years | 0 (0.0%) | 0 (0.0%) |
| 18 to 34 Years | 7 (2.5%) | 0 (0.0%) |
| 35 to 64 Years | 48 (13.6%) | 81 (14.9%) |
| 65 to 74 Years | 74 (61.7%) | 11 (7.2%) |
| 75 Years and over | 1 (5.6%) | 43 (35.5%) |
Disability Class: Self-Care Difficulty
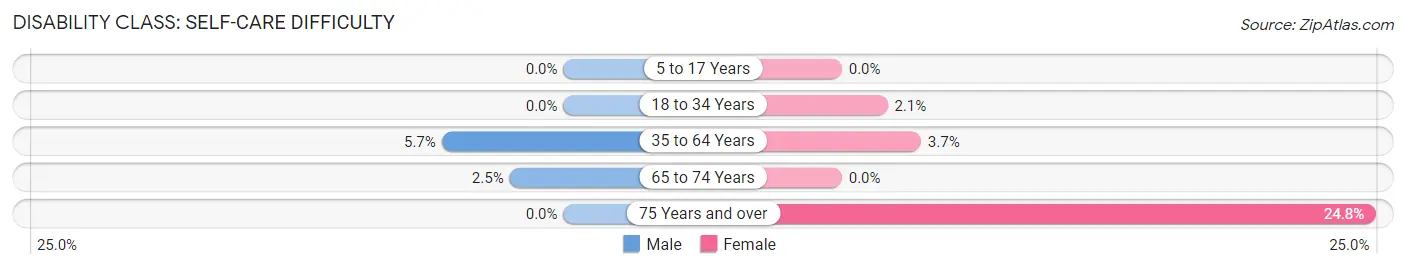
| Age Bracket | Male | Female |
| 5 to 17 Years | 0 (0.0%) | 0 (0.0%) |
| 18 to 34 Years | 0 (0.0%) | 6 (2.1%) |
| 35 to 64 Years | 20 (5.7%) | 20 (3.7%) |
| 65 to 74 Years | 3 (2.5%) | 0 (0.0%) |
| 75 Years and over | 0 (0.0%) | 30 (24.8%) |
Technology Access in Carthage
Computing Device Access in Carthage
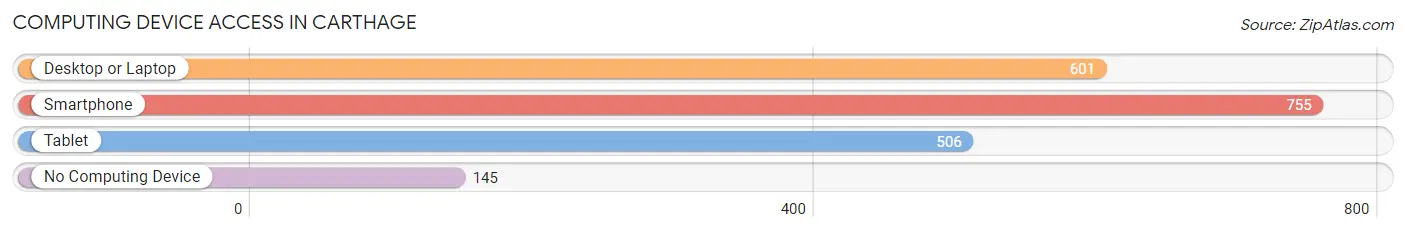
| Device Type | # Households | % Households |
| Desktop or Laptop | 601 | 62.0% |
| Smartphone | 755 | 77.8% |
| Tablet | 506 | 52.2% |
| No Computing Device | 145 | 14.9% |
| Total | 970 | 100.0% |
Internet Access in Carthage
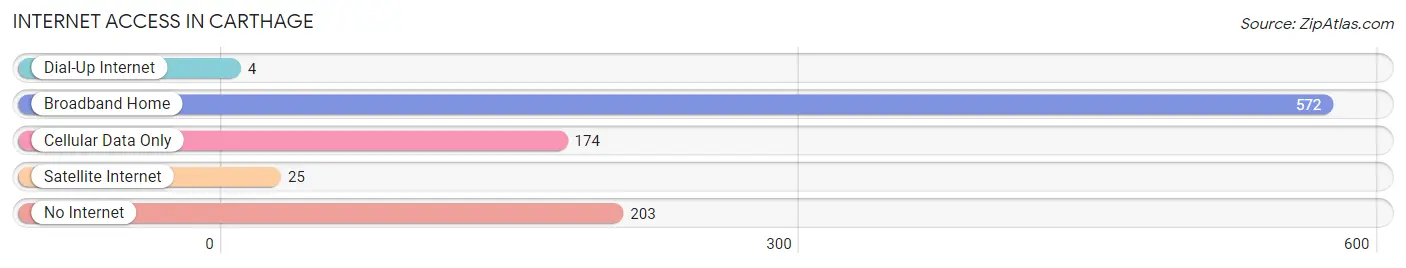
| Internet Type | # Households | % Households |
| Dial-Up Internet | 4 | 0.4% |
| Broadband Home | 572 | 59.0% |
| Cellular Data Only | 174 | 17.9% |
| Satellite Internet | 25 | 2.6% |
| No Internet | 203 | 20.9% |
| Total | 970 | 100.0% |
Carthage Summary
Carthage, Tennessee is a small town located in Smith County, Tennessee. It is situated in the middle of the state, about halfway between Nashville and Knoxville. The town has a population of just over 2,000 people and is the county seat of Smith County.
History
Carthage was founded in 1817 by a group of settlers from North Carolina. The town was named after the ancient city of Carthage in Tunisia. The settlers were attracted to the area due to its fertile soil and abundant natural resources. The town quickly grew and by 1820, it had become the county seat of Smith County.
In the early 19th century, Carthage was a thriving agricultural center. The town was home to several cotton plantations and was a major producer of tobacco. The town also had a thriving lumber industry, with several sawmills located in the area.
In the late 19th century, the town began to decline. The Civil War had a devastating effect on the town, as many of the plantations were destroyed and the economy was in ruins. The town slowly recovered, but it never regained its former prosperity.
Geography
Carthage is located in the middle of Smith County, Tennessee. The town is situated on the banks of the Caney Fork River, which flows through the town. The town is surrounded by rolling hills and is located in a valley. The town is located about halfway between Nashville and Knoxville, and is about an hour and a half drive from each city.
The climate in Carthage is temperate, with hot summers and mild winters. The average temperature in the summer is around 80 degrees Fahrenheit, and the average temperature in the winter is around 40 degrees Fahrenheit.
Economy
The economy of Carthage is largely based on agriculture. The town is home to several farms, which produce a variety of crops, including corn, soybeans, and cotton. The town also has a thriving lumber industry, with several sawmills located in the area.
The town also has a small manufacturing sector, with several small factories located in the area. The town is also home to several small businesses, including restaurants, shops, and other services.
Demographics
As of the 2010 census, the population of Carthage was 2,072. The town is predominantly white, with about 95% of the population being white. The town also has a small African American population, with about 4% of the population being African American. The town also has a small Hispanic population, with about 1% of the population being Hispanic.
The median household income in Carthage is $35,000, and the median home value is $90,000. The town has a poverty rate of about 20%, which is higher than the national average.
Conclusion
Carthage, Tennessee is a small town located in Smith County, Tennessee. The town has a population of just over 2,000 people and is the county seat of Smith County. The town was founded in 1817 and was a thriving agricultural center in the early 19th century. The town has a temperate climate and is home to several farms, sawmills, and small businesses. The town has a predominantly white population, with a small African American and Hispanic population. The median household income in Carthage is $35,000, and the median home value is $90,000.
Common Questions
What is Per Capita Income in Carthage?
Per Capita income in Carthage is $27,044.
What is the Median Family Income in Carthage?
Median Family Income in Carthage is $63,913.
What is the Median Household income in Carthage?
Median Household Income in Carthage is $53,526.
What is Income or Wage Gap in Carthage?
Income or Wage Gap in Carthage is 42.6%.
Women in Carthage earn 57.4 cents for every dollar earned by a man.
What is Family Income Deficit in Carthage?
Family Income Deficit in Carthage is $14,531.
Families that are below poverty line in Carthage earn $14,531 less on average than the poverty threshold level.
What is Inequality or Gini Index in Carthage?
Inequality or Gini Index in Carthage is 0.41.
What is the Total Population of Carthage?
Total Population of Carthage is 2,454.
What is the Total Male Population of Carthage?
Total Male Population of Carthage is 1,157.
What is the Total Female Population of Carthage?
Total Female Population of Carthage is 1,297.
What is the Ratio of Males per 100 Females in Carthage?
There are 89.21 Males per 100 Females in Carthage.
What is the Ratio of Females per 100 Males in Carthage?
There are 112.10 Females per 100 Males in Carthage.
What is the Median Population Age in Carthage?
Median Population Age in Carthage is 39.5 Years.
What is the Average Family Size in Carthage
Average Family Size in Carthage is 2.9 People.
What is the Average Household Size in Carthage
Average Household Size in Carthage is 2.4 People.
How Large is the Labor Force in Carthage?
There are 1,261 People in the Labor Forcein in Carthage.
What is the Percentage of People in the Labor Force in Carthage?
59.7% of People are in the Labor Force in Carthage.
What is the Unemployment Rate in Carthage?
Unemployment Rate in Carthage is 1.4%.