Coalfield, TN Map & Demographics
Coalfield Map
Coalfield Overview
$25,097
PER CAPITA INCOME
$85,132
AVG FAMILY INCOME
$52,375
AVG HOUSEHOLD INCOME
39.4%
WAGE / INCOME GAP [ % ]
60.6¢/ $1
WAGE / INCOME GAP [ $ ]
0.42
INEQUALITY / GINI INDEX
2,905
TOTAL POPULATION
1,479
MALE POPULATION
1,426
FEMALE POPULATION
103.72
MALES / 100 FEMALES
96.42
FEMALES / 100 MALES
35.3
MEDIAN AGE
3.7
AVG FAMILY SIZE
3.2
AVG HOUSEHOLD SIZE
1,211
LABOR FORCE [ PEOPLE ]
59.2%
PERCENT IN LABOR FORCE
4.0%
UNEMPLOYMENT RATE
Coalfield Zip Codes
Coalfield Area Codes
Income in Coalfield
Income Overview in Coalfield
Per Capita Income in Coalfield is $25,097, while median incomes of families and households are $85,132 and $52,375 respectively.
| Characteristic | Number | Measure |
| Per Capita Income | 2,905 | $25,097 |
| Median Family Income | 678 | $85,132 |
| Mean Family Income | 678 | $84,238 |
| Median Household Income | 915 | $52,375 |
| Mean Household Income | 915 | $74,464 |
| Income Deficit | 678 | $0 |
| Wage / Income Gap (%) | 2,905 | 39.37% |
| Wage / Income Gap ($) | 2,905 | 60.63¢ per $1 |
| Gini / Inequality Index | 2,905 | 0.42 |
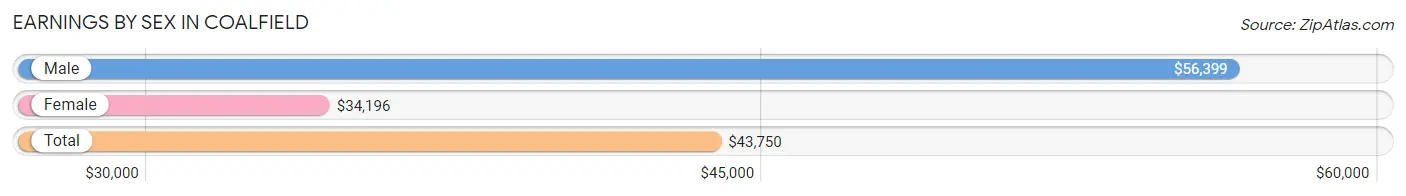
Earnings by Sex in Coalfield
Average Earnings in Coalfield are $43,750, $56,399 for men and $34,196 for women, a difference of 39.4%.
| Sex | Number | Average Earnings |
| Male | 633 (50.2%) | $56,399 |
| Female | 627 (49.8%) | $34,196 |
| Total | 1,260 (100.0%) | $43,750 |
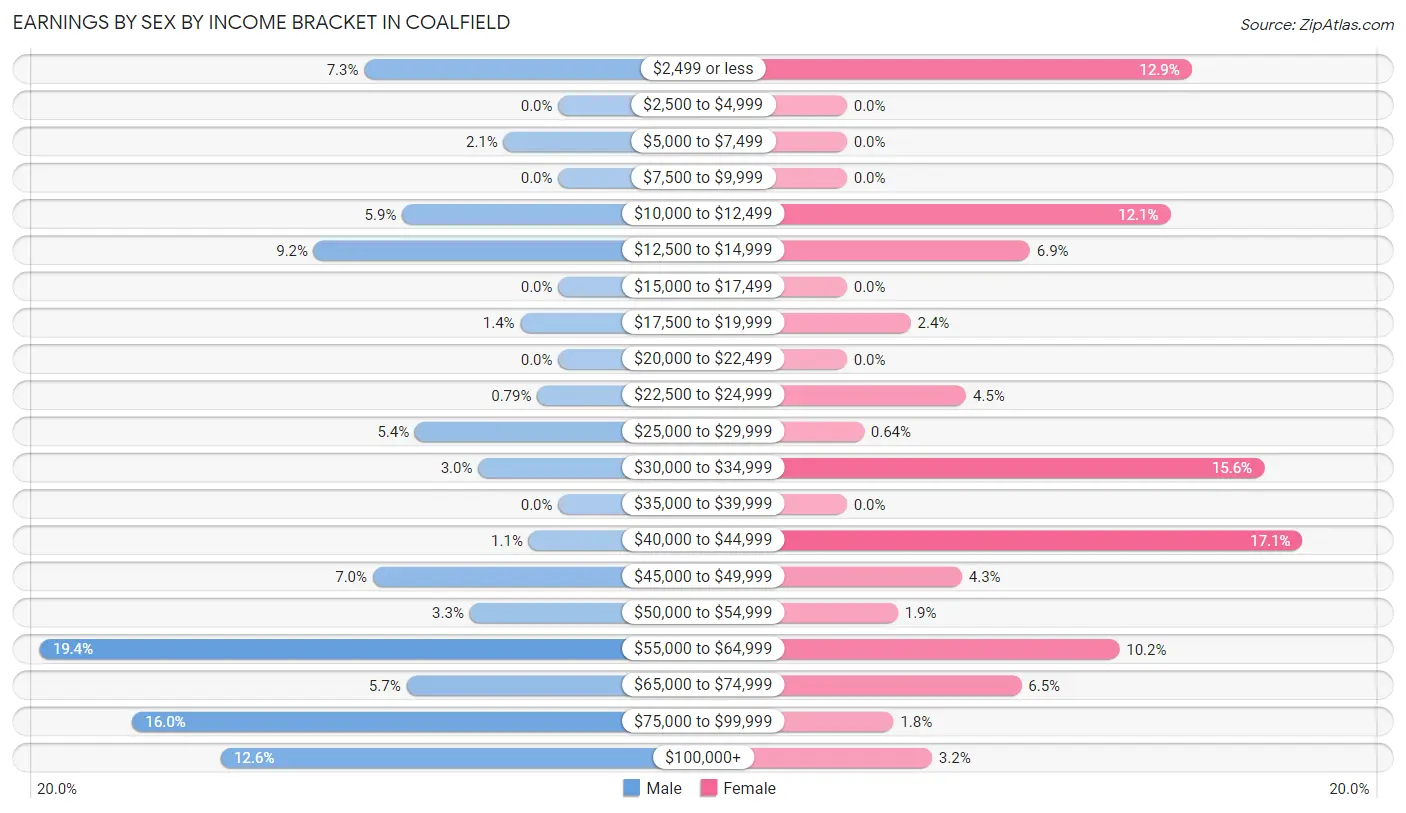
Earnings by Sex by Income Bracket in Coalfield
The most common earnings brackets in Coalfield are $55,000 to $64,999 for men (123 | 19.4%) and $40,000 to $44,999 for women (107 | 17.1%).
| Income | Male | Female |
| $2,499 or less | 46 (7.3%) | 81 (12.9%) |
| $2,500 to $4,999 | 0 (0.0%) | 0 (0.0%) |
| $5,000 to $7,499 | 13 (2.1%) | 0 (0.0%) |
| $7,500 to $9,999 | 0 (0.0%) | 0 (0.0%) |
| $10,000 to $12,499 | 37 (5.9%) | 76 (12.1%) |
| $12,500 to $14,999 | 58 (9.2%) | 43 (6.9%) |
| $15,000 to $17,499 | 0 (0.0%) | 0 (0.0%) |
| $17,500 to $19,999 | 9 (1.4%) | 15 (2.4%) |
| $20,000 to $22,499 | 0 (0.0%) | 0 (0.0%) |
| $22,500 to $24,999 | 5 (0.8%) | 28 (4.5%) |
| $25,000 to $29,999 | 34 (5.4%) | 4 (0.6%) |
| $30,000 to $34,999 | 19 (3.0%) | 98 (15.6%) |
| $35,000 to $39,999 | 0 (0.0%) | 0 (0.0%) |
| $40,000 to $44,999 | 7 (1.1%) | 107 (17.1%) |
| $45,000 to $49,999 | 44 (7.0%) | 27 (4.3%) |
| $50,000 to $54,999 | 21 (3.3%) | 12 (1.9%) |
| $55,000 to $64,999 | 123 (19.4%) | 64 (10.2%) |
| $65,000 to $74,999 | 36 (5.7%) | 41 (6.5%) |
| $75,000 to $99,999 | 101 (16.0%) | 11 (1.8%) |
| $100,000+ | 80 (12.6%) | 20 (3.2%) |
| Total | 633 (100.0%) | 627 (100.0%) |
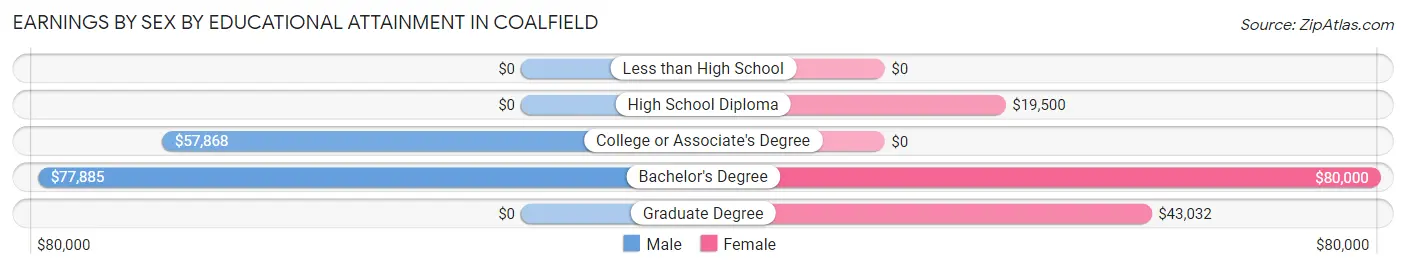
Earnings by Sex by Educational Attainment in Coalfield
Average earnings in Coalfield are $59,320 for men and $34,770 for women, a difference of 41.4%. Men with an educational attainment of bachelor's degree enjoy the highest average annual earnings of $77,885, while those with college or associate's degree education earn the least with $57,868. Women with an educational attainment of bachelor's degree earn the most with the average annual earnings of $80,000, while those with high school diploma education have the smallest earnings of $19,500.
| Educational Attainment | Male Income | Female Income |
| Less than High School | - | - |
| High School Diploma | - | - |
| College or Associate's Degree | $57,868 | $0 |
| Bachelor's Degree | $77,885 | $80,000 |
| Graduate Degree | - | - |
| Total | $59,320 | $34,770 |
Family Income in Coalfield
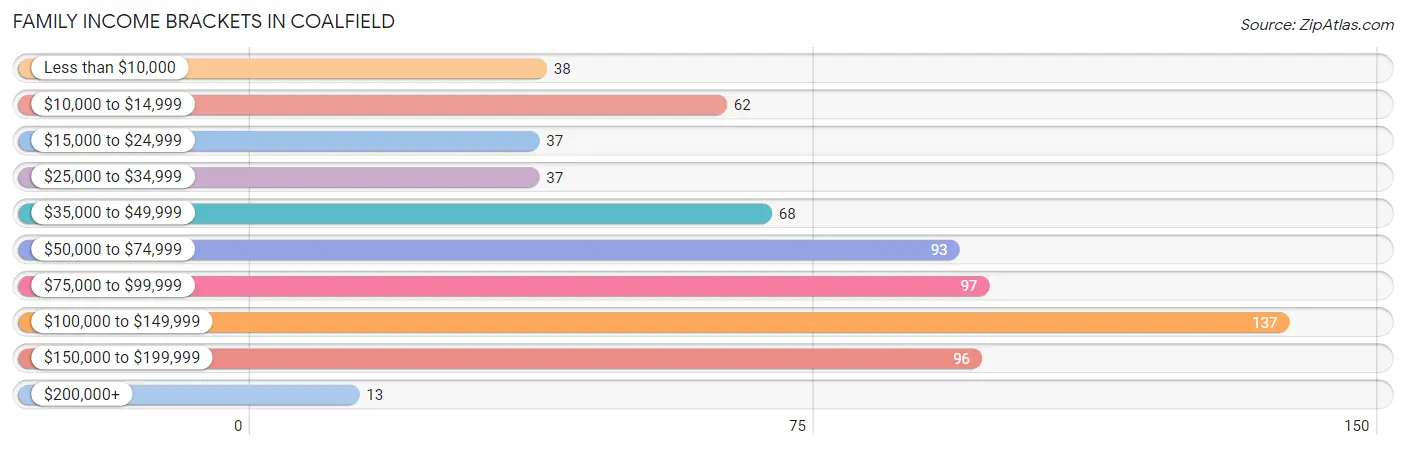
Family Income Brackets in Coalfield
According to the Coalfield family income data, there are 137 families falling into the $100,000 to $149,999 income range, which is the most common income bracket and makes up 20.2% of all families. Conversely, the $200,000+ income bracket is the least frequent group with only 13 families (1.9%) belonging to this category.
| Income Bracket | # Families | % Families |
| Less than $10,000 | 38 | 5.6% |
| $10,000 to $14,999 | 62 | 9.1% |
| $15,000 to $24,999 | 37 | 5.5% |
| $25,000 to $34,999 | 37 | 5.5% |
| $35,000 to $49,999 | 68 | 10.0% |
| $50,000 to $74,999 | 93 | 13.7% |
| $75,000 to $99,999 | 97 | 14.3% |
| $100,000 to $149,999 | 137 | 20.2% |
| $150,000 to $199,999 | 96 | 14.2% |
| $200,000+ | 13 | 1.9% |
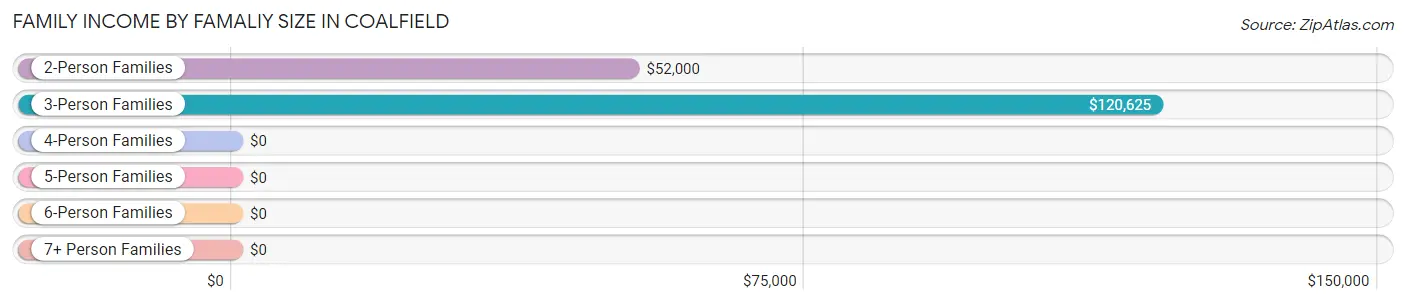
Family Income by Famaliy Size in Coalfield
3-person families (244 | 36.0%) account for the highest median family income in Coalfield with $120,625 per family, while 3-person families (244 | 36.0%) have the highest median income of $40,208 per family member.
| Income Bracket | # Families | Median Income |
| 2-Person Families | 216 (31.9%) | $52,000 |
| 3-Person Families | 244 (36.0%) | $120,625 |
| 4-Person Families | 143 (21.1%) | $0 |
| 5-Person Families | 62 (9.1%) | $0 |
| 6-Person Families | 13 (1.9%) | $0 |
| 7+ Person Families | 0 (0.0%) | $0 |
| Total | 678 (100.0%) | $85,132 |
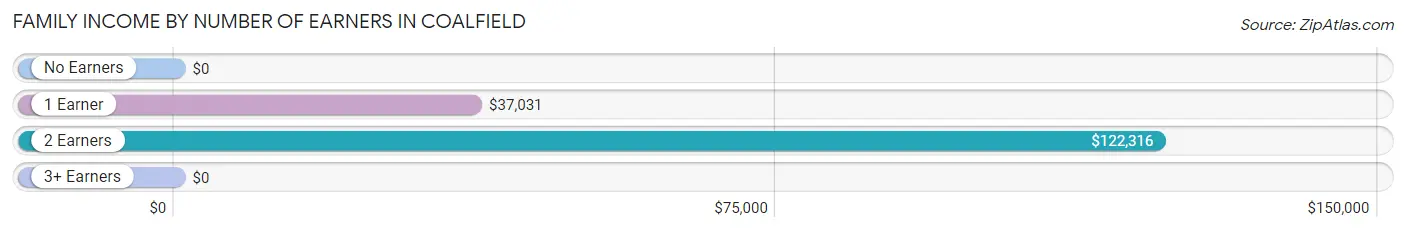
Family Income by Number of Earners in Coalfield
| Number of Earners | # Families | Median Income |
| No Earners | 183 (27.0%) | $0 |
| 1 Earner | 177 (26.1%) | $37,031 |
| 2 Earners | 248 (36.6%) | $122,316 |
| 3+ Earners | 70 (10.3%) | $0 |
| Total | 678 (100.0%) | $85,132 |
Household Income in Coalfield
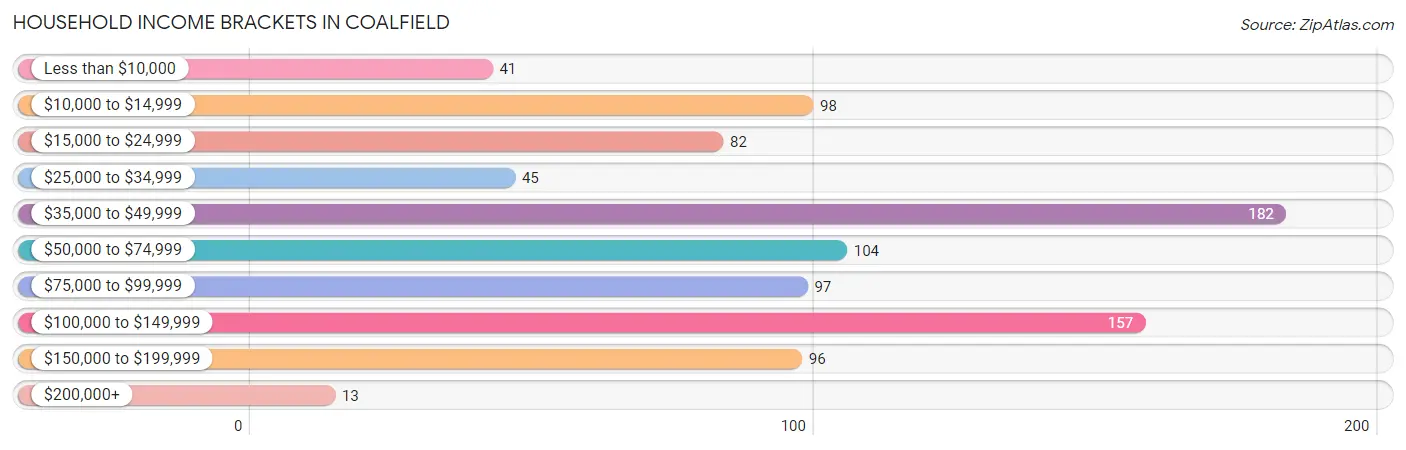
Household Income Brackets in Coalfield
With 182 households falling in the category, the $35,000 to $49,999 income range is the most frequent in Coalfield, accounting for 19.9% of all households. In contrast, only 13 households (1.4%) fall into the $200,000+ income bracket, making it the least populous group.
| Income Bracket | # Households | % Households |
| Less than $10,000 | 41 | 4.5% |
| $10,000 to $14,999 | 98 | 10.7% |
| $15,000 to $24,999 | 82 | 9.0% |
| $25,000 to $34,999 | 45 | 4.9% |
| $35,000 to $49,999 | 182 | 19.9% |
| $50,000 to $74,999 | 104 | 11.4% |
| $75,000 to $99,999 | 97 | 10.6% |
| $100,000 to $149,999 | 157 | 17.2% |
| $150,000 to $199,999 | 96 | 10.5% |
| $200,000+ | 13 | 1.4% |
Household Income by Householder Age in Coalfield
The median household income in Coalfield is $52,375, with the highest median household income of $120,147 found in the 45 to 64 years age bracket for the primary householder. A total of 350 households (38.3%) fall into this category. Meanwhile, the 25 to 44 years age bracket for the primary householder has the lowest median household income of $0, with 217 households (23.7%) in this group.
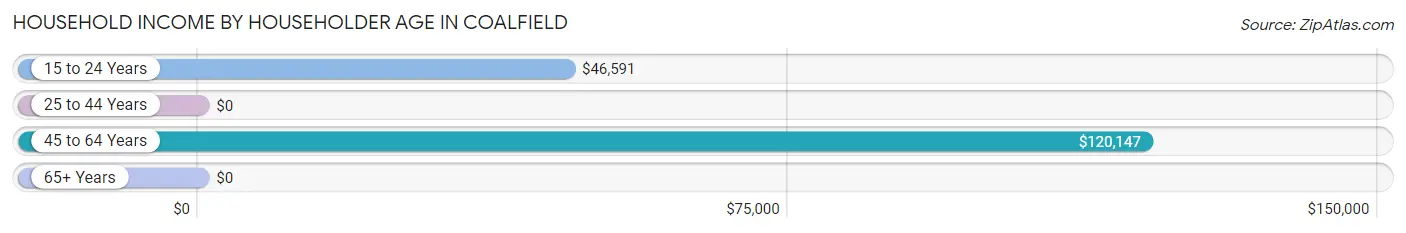
| Income Bracket | # Households | Median Income |
| 15 to 24 Years | 40 (4.4%) | $46,591 |
| 25 to 44 Years | 217 (23.7%) | $0 |
| 45 to 64 Years | 350 (38.3%) | $120,147 |
| 65+ Years | 308 (33.7%) | $0 |
| Total | 915 (100.0%) | $52,375 |
Poverty in Coalfield
Income Below Poverty by Sex and Age in Coalfield
With 14.8% poverty level for males and 36.3% for females among the residents of Coalfield, 15 year old males and under 5 year old females are the most vulnerable to poverty, with 16 males (100.0%) and 50 females (100.0%) in their respective age groups living below the poverty level.
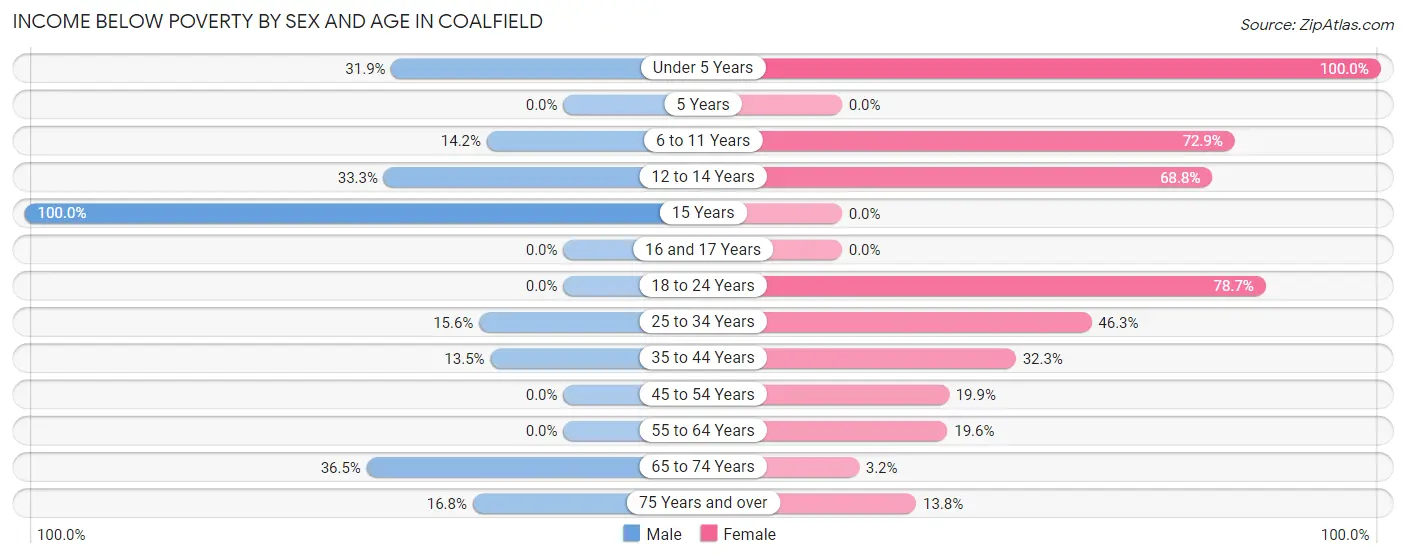
| Age Bracket | Male | Female |
| Under 5 Years | 45 (31.9%) | 50 (100.0%) |
| 5 Years | 0 (0.0%) | 0 (0.0%) |
| 6 to 11 Years | 47 (14.2%) | 70 (72.9%) |
| 12 to 14 Years | 13 (33.3%) | 88 (68.8%) |
| 15 Years | 16 (100.0%) | 0 (0.0%) |
| 16 and 17 Years | 0 (0.0%) | 0 (0.0%) |
| 18 to 24 Years | 0 (0.0%) | 59 (78.7%) |
| 25 to 34 Years | 15 (15.6%) | 88 (46.3%) |
| 35 to 44 Years | 13 (13.5%) | 92 (32.3%) |
| 45 to 54 Years | 0 (0.0%) | 27 (19.9%) |
| 55 to 64 Years | 0 (0.0%) | 19 (19.6%) |
| 65 to 74 Years | 50 (36.5%) | 4 (3.2%) |
| 75 Years and over | 20 (16.8%) | 20 (13.8%) |
| Total | 219 (14.8%) | 517 (36.3%) |
Income Above Poverty by Sex and Age in Coalfield
According to the poverty statistics in Coalfield, males aged 16 and 17 years and females aged 5 years are the age groups that are most secure financially, with 100.0% of males and 100.0% of females in these age groups living above the poverty line.
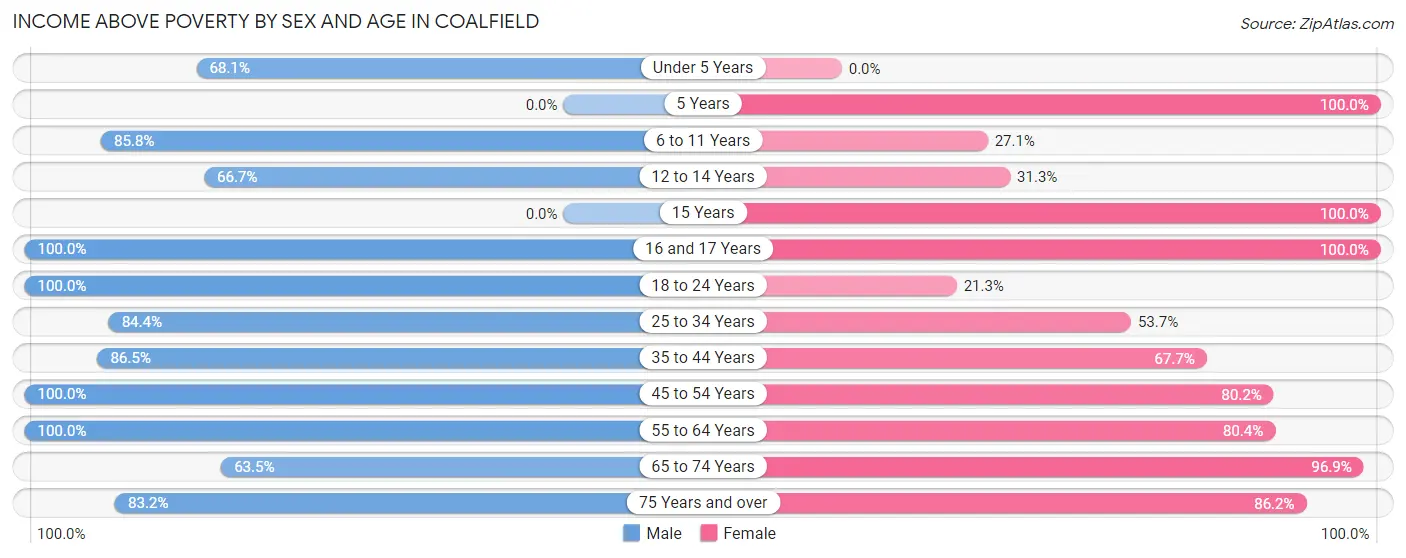
| Age Bracket | Male | Female |
| Under 5 Years | 96 (68.1%) | 0 (0.0%) |
| 5 Years | 0 (0.0%) | 17 (100.0%) |
| 6 to 11 Years | 284 (85.8%) | 26 (27.1%) |
| 12 to 14 Years | 26 (66.7%) | 40 (31.2%) |
| 15 Years | 0 (0.0%) | 42 (100.0%) |
| 16 and 17 Years | 31 (100.0%) | 38 (100.0%) |
| 18 to 24 Years | 136 (100.0%) | 16 (21.3%) |
| 25 to 34 Years | 81 (84.4%) | 102 (53.7%) |
| 35 to 44 Years | 83 (86.5%) | 193 (67.7%) |
| 45 to 54 Years | 278 (100.0%) | 109 (80.1%) |
| 55 to 64 Years | 59 (100.0%) | 78 (80.4%) |
| 65 to 74 Years | 87 (63.5%) | 123 (96.9%) |
| 75 Years and over | 99 (83.2%) | 125 (86.2%) |
| Total | 1,260 (85.2%) | 909 (63.7%) |
Income Below Poverty Among Married-Couple Families in Coalfield
The poverty statistics for married-couple families in Coalfield show that 5.0% or 25 of the total 501 families live below the poverty line. Families with 1 or 2 children have the highest poverty rate of 7.0%, comprising of 15 families. On the other hand, families with 3 or 4 children have the lowest poverty rate of 0.0%, which includes 0 families.
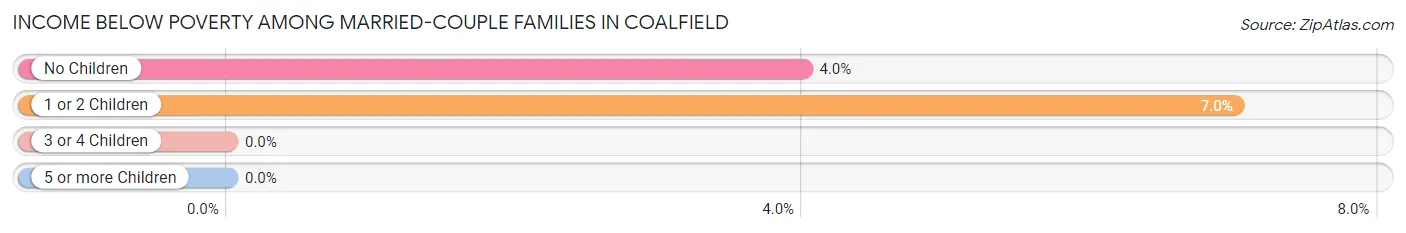
| Children | Above Poverty | Below Poverty |
| No Children | 240 (96.0%) | 10 (4.0%) |
| 1 or 2 Children | 199 (93.0%) | 15 (7.0%) |
| 3 or 4 Children | 37 (100.0%) | 0 (0.0%) |
| 5 or more Children | 0 (0.0%) | 0 (0.0%) |
| Total | 476 (95.0%) | 25 (5.0%) |
Income Below Poverty Among Single-Parent Households in Coalfield
According to the poverty data in Coalfield, 50.0% or 35 single-father households and 65.4% or 70 single-mother households are living below the poverty line. Among single-father households, those with 1 or 2 children have the highest poverty rate, with 35 households (50.0%) experiencing poverty. Likewise, among single-mother households, those with 3 or 4 children have the highest poverty rate, with 15 households (100.0%) falling below the poverty line.
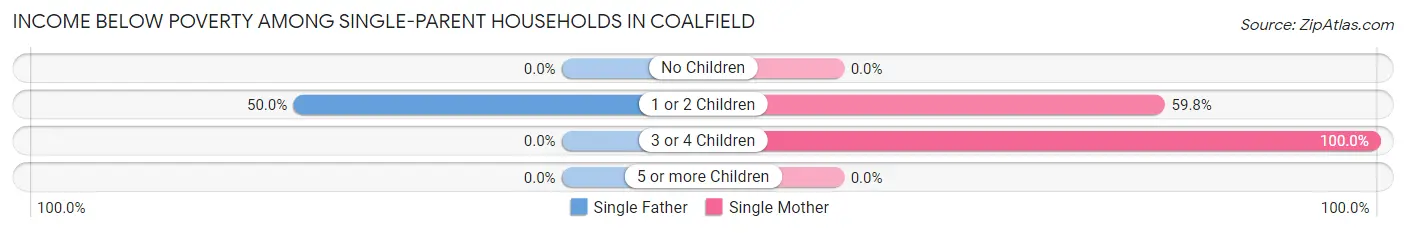
| Children | Single Father | Single Mother |
| No Children | 0 (0.0%) | 0 (0.0%) |
| 1 or 2 Children | 35 (50.0%) | 55 (59.8%) |
| 3 or 4 Children | 0 (0.0%) | 15 (100.0%) |
| 5 or more Children | 0 (0.0%) | 0 (0.0%) |
| Total | 35 (50.0%) | 70 (65.4%) |
Income Below Poverty Among Married-Couple vs Single-Parent Households in Coalfield
The poverty data for Coalfield shows that 25 of the married-couple family households (5.0%) and 105 of the single-parent households (59.3%) are living below the poverty level. Within the married-couple family households, those with 1 or 2 children have the highest poverty rate, with 15 households (7.0%) falling below the poverty line. Among the single-parent households, those with 3 or 4 children have the highest poverty rate, with 15 household (100.0%) living below poverty.
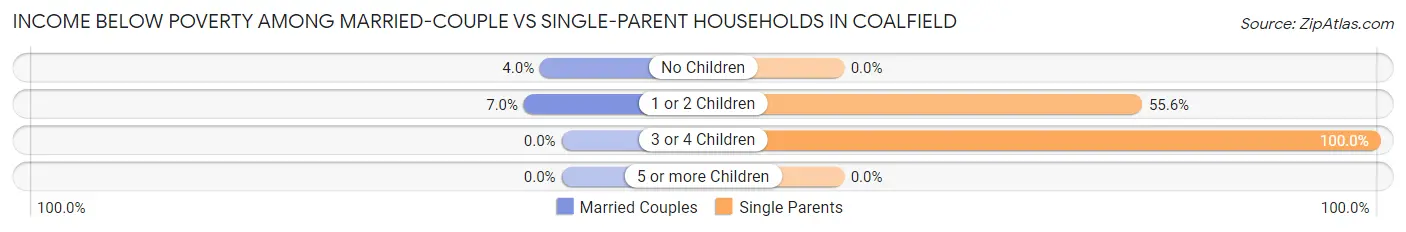
| Children | Married-Couple Families | Single-Parent Households |
| No Children | 10 (4.0%) | 0 (0.0%) |
| 1 or 2 Children | 15 (7.0%) | 90 (55.6%) |
| 3 or 4 Children | 0 (0.0%) | 15 (100.0%) |
| 5 or more Children | 0 (0.0%) | 0 (0.0%) |
| Total | 25 (5.0%) | 105 (59.3%) |
Race in Coalfield
The most populous races in Coalfield are White / Caucasian (2,870 | 98.8%), Two or more Races (35 | 1.2%), and Hispanic or Latino (3 | 0.1%).
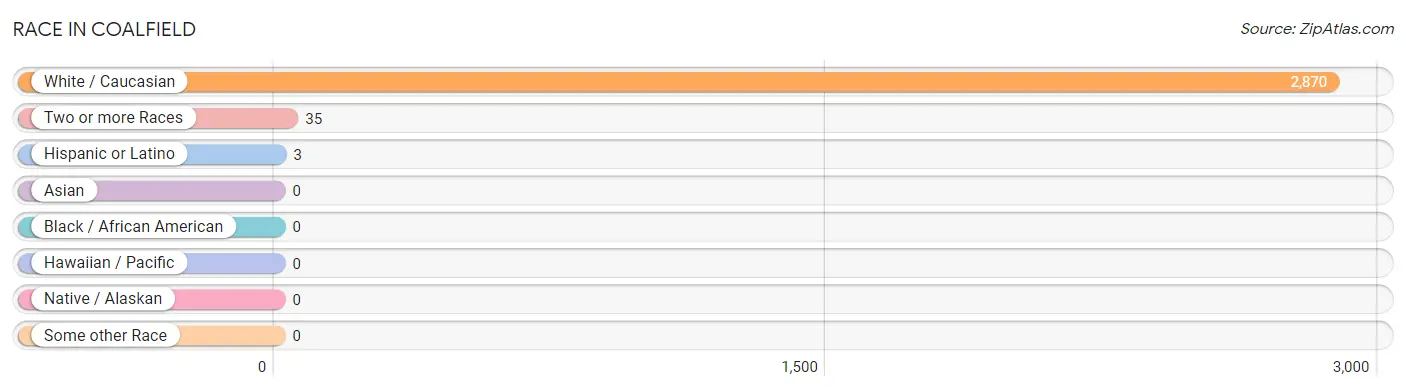
| Race | # Population | % Population |
| Asian | 0 | 0.0% |
| Black / African American | 0 | 0.0% |
| Hawaiian / Pacific | 0 | 0.0% |
| Hispanic or Latino | 3 | 0.1% |
| Native / Alaskan | 0 | 0.0% |
| White / Caucasian | 2,870 | 98.8% |
| Two or more Races | 35 | 1.2% |
| Some other Race | 0 | 0.0% |
| Total | 2,905 | 100.0% |
Ancestry in Coalfield
The most populous ancestries reported in Coalfield are English (612 | 21.1%), Irish (453 | 15.6%), Scotch-Irish (345 | 11.9%), Arab (199 | 6.9%), and Lebanese (199 | 6.9%), together accounting for 62.2% of all Coalfield residents.
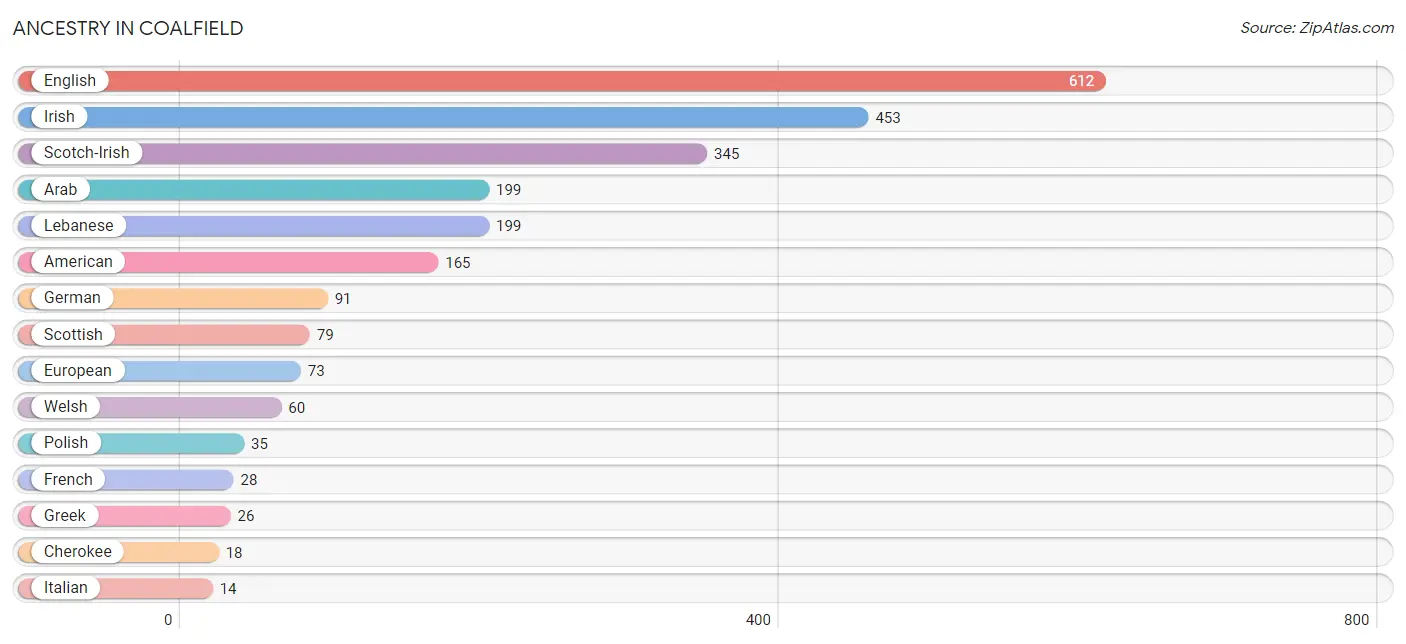
| Ancestry | # Population | % Population |
| American | 165 | 5.7% |
| Arab | 199 | 6.9% |
| Canadian | 12 | 0.4% |
| Cherokee | 18 | 0.6% |
| English | 612 | 21.1% |
| European | 73 | 2.5% |
| Finnish | 12 | 0.4% |
| French | 28 | 1.0% |
| French Canadian | 13 | 0.4% |
| German | 91 | 3.1% |
| Greek | 26 | 0.9% |
| Irish | 453 | 15.6% |
| Italian | 14 | 0.5% |
| Lebanese | 199 | 6.9% |
| Mexican | 3 | 0.1% |
| Polish | 35 | 1.2% |
| Portuguese | 14 | 0.5% |
| Scotch-Irish | 345 | 11.9% |
| Scottish | 79 | 2.7% |
| Welsh | 60 | 2.1% | View All 20 Rows |
Immigrants in Coalfield
The most numerous immigrant groups reported in Coalfield came from , and Canada (12 | 0.4%), together accounting for 0.4% of all Coalfield residents.

| Immigration Origin | # Population | % Population |
| Canada | 12 | 0.4% | View All 1 Rows |
Sex and Age in Coalfield
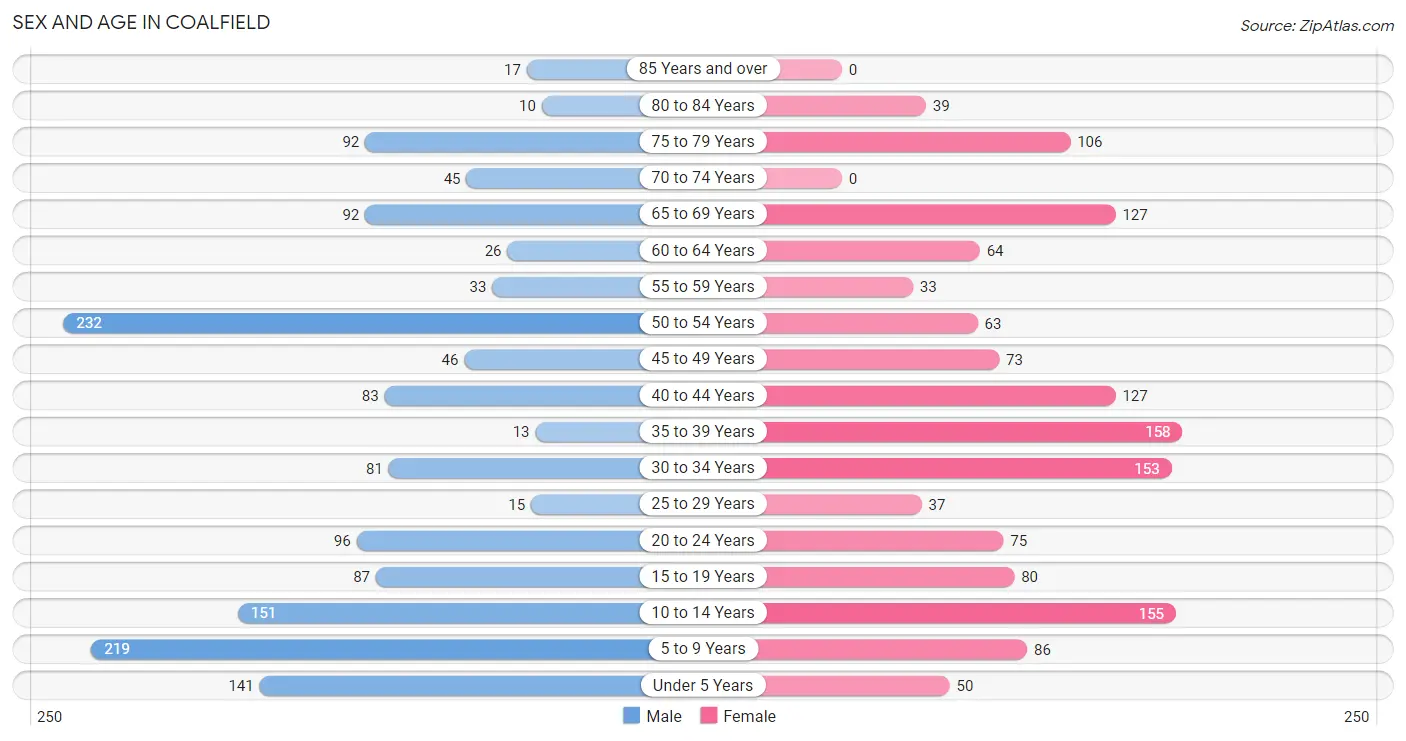
Sex and Age in Coalfield
The most populous age groups in Coalfield are 50 to 54 Years (232 | 15.7%) for men and 35 to 39 Years (158 | 11.1%) for women.
| Age Bracket | Male | Female |
| Under 5 Years | 141 (9.5%) | 50 (3.5%) |
| 5 to 9 Years | 219 (14.8%) | 86 (6.0%) |
| 10 to 14 Years | 151 (10.2%) | 155 (10.9%) |
| 15 to 19 Years | 87 (5.9%) | 80 (5.6%) |
| 20 to 24 Years | 96 (6.5%) | 75 (5.3%) |
| 25 to 29 Years | 15 (1.0%) | 37 (2.6%) |
| 30 to 34 Years | 81 (5.5%) | 153 (10.7%) |
| 35 to 39 Years | 13 (0.9%) | 158 (11.1%) |
| 40 to 44 Years | 83 (5.6%) | 127 (8.9%) |
| 45 to 49 Years | 46 (3.1%) | 73 (5.1%) |
| 50 to 54 Years | 232 (15.7%) | 63 (4.4%) |
| 55 to 59 Years | 33 (2.2%) | 33 (2.3%) |
| 60 to 64 Years | 26 (1.8%) | 64 (4.5%) |
| 65 to 69 Years | 92 (6.2%) | 127 (8.9%) |
| 70 to 74 Years | 45 (3.0%) | 0 (0.0%) |
| 75 to 79 Years | 92 (6.2%) | 106 (7.4%) |
| 80 to 84 Years | 10 (0.7%) | 39 (2.7%) |
| 85 Years and over | 17 (1.1%) | 0 (0.0%) |
| Total | 1,479 (100.0%) | 1,426 (100.0%) |
Families and Households in Coalfield
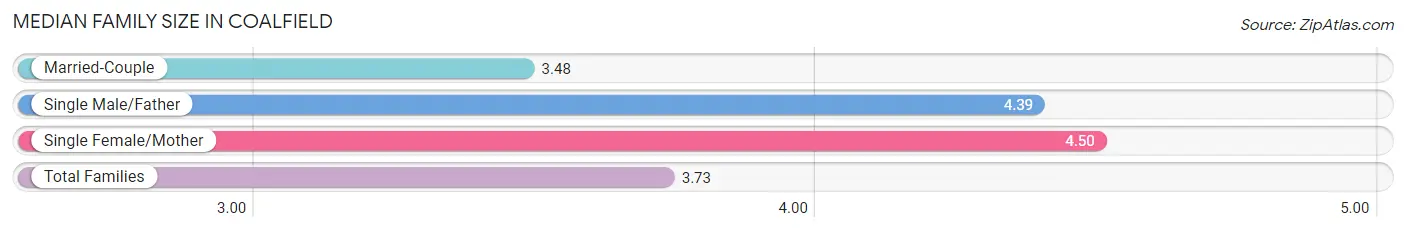
Median Family Size in Coalfield
The median family size in Coalfield is 3.73 persons per family, with single female/mother families (107 | 15.8%) accounting for the largest median family size of 4.5 persons per family. On the other hand, married-couple families (501 | 73.9%) represent the smallest median family size with 3.48 persons per family.
| Family Type | # Families | Family Size |
| Married-Couple | 501 (73.9%) | 3.48 |
| Single Male/Father | 70 (10.3%) | 4.39 |
| Single Female/Mother | 107 (15.8%) | 4.50 |
| Total Families | 678 (100.0%) | 3.73 |
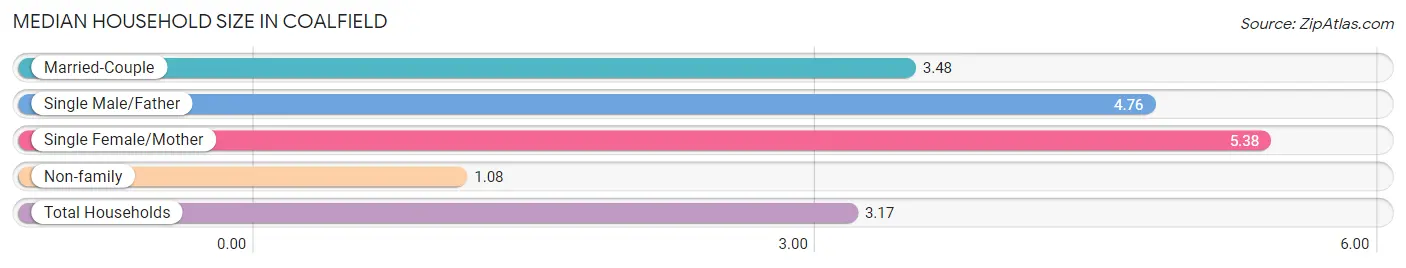
Median Household Size in Coalfield
The median household size in Coalfield is 3.17 persons per household, with single female/mother households (107 | 11.7%) accounting for the largest median household size of 5.38 persons per household. non-family households (237 | 25.9%) represent the smallest median household size with 1.08 persons per household.
| Household Type | # Households | Household Size |
| Married-Couple | 501 (54.7%) | 3.48 |
| Single Male/Father | 70 (7.6%) | 4.76 |
| Single Female/Mother | 107 (11.7%) | 5.38 |
| Non-family | 237 (25.9%) | 1.08 |
| Total Households | 915 (100.0%) | 3.17 |
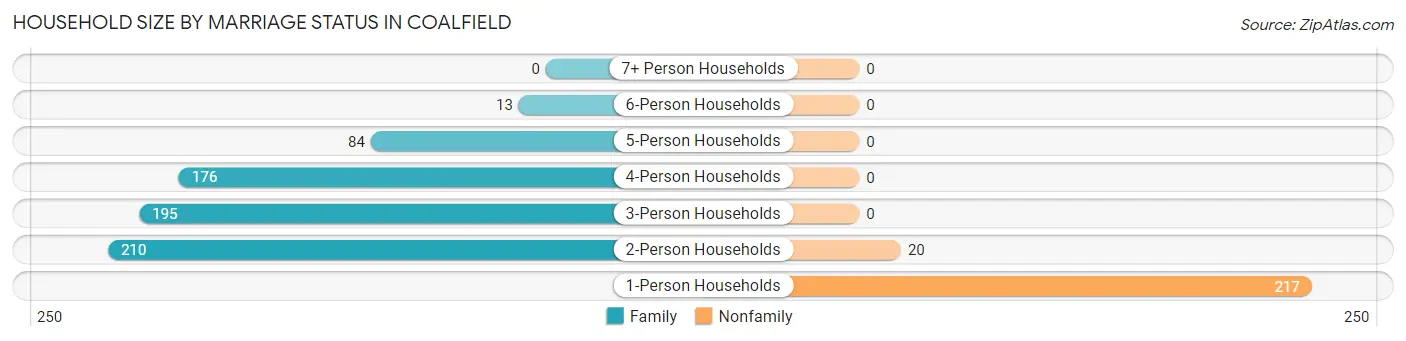
Household Size by Marriage Status in Coalfield
Out of a total of 915 households in Coalfield, 678 (74.1%) are family households, while 237 (25.9%) are nonfamily households. The most numerous type of family households are 2-person households, comprising 210, and the most common type of nonfamily households are 1-person households, comprising 217.
| Household Size | Family Households | Nonfamily Households |
| 1-Person Households | - | 217 (23.7%) |
| 2-Person Households | 210 (23.0%) | 20 (2.2%) |
| 3-Person Households | 195 (21.3%) | 0 (0.0%) |
| 4-Person Households | 176 (19.2%) | 0 (0.0%) |
| 5-Person Households | 84 (9.2%) | 0 (0.0%) |
| 6-Person Households | 13 (1.4%) | 0 (0.0%) |
| 7+ Person Households | 0 (0.0%) | 0 (0.0%) |
| Total | 678 (74.1%) | 237 (25.9%) |
Female Fertility in Coalfield
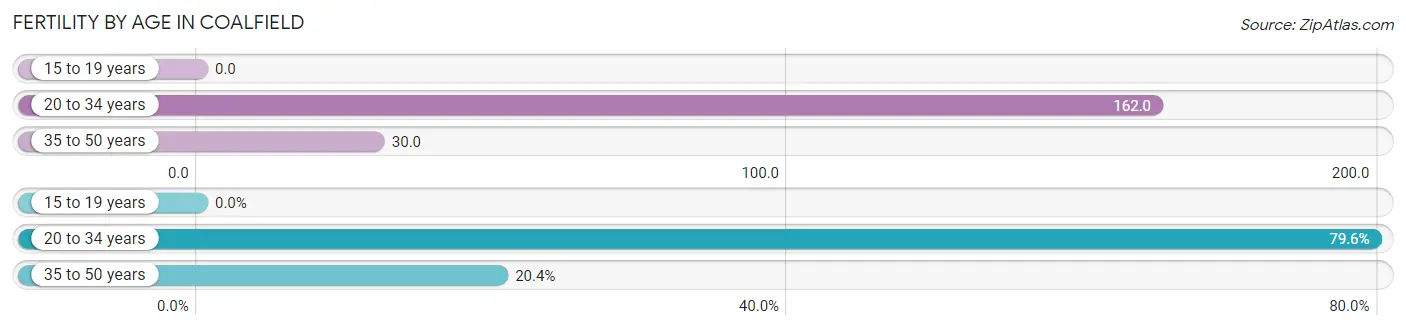
Fertility by Age in Coalfield
Average fertility rate in Coalfield is 76.0 births per 1,000 women. Women in the age bracket of 20 to 34 years have the highest fertility rate with 162.0 births per 1,000 women. Women in the age bracket of 20 to 34 years acount for 79.6% of all women with births.
| Age Bracket | Women with Births | Births / 1,000 Women |
| 15 to 19 years | 0 (0.0%) | 0.0 |
| 20 to 34 years | 43 (79.6%) | 162.0 |
| 35 to 50 years | 11 (20.4%) | 30.0 |
| Total | 54 (100.0%) | 76.0 |
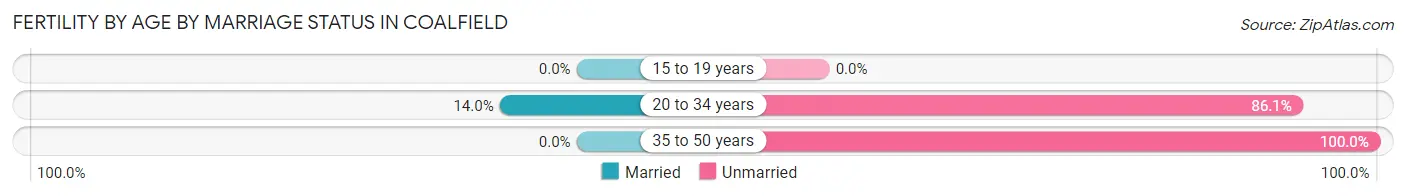
Fertility by Age by Marriage Status in Coalfield
11.1% of women with births (54) in Coalfield are married. The highest percentage of unmarried women with births falls into 35 to 50 years age bracket with 100.0% of them unmarried at the time of birth, while the lowest percentage of unmarried women with births belong to 20 to 34 years age bracket with 86.1% of them unmarried.
| Age Bracket | Married | Unmarried |
| 15 to 19 years | 0 (0.0%) | 0 (0.0%) |
| 20 to 34 years | 6 (14.0%) | 37 (86.1%) |
| 35 to 50 years | 0 (0.0%) | 11 (100.0%) |
| Total | 6 (11.1%) | 48 (88.9%) |
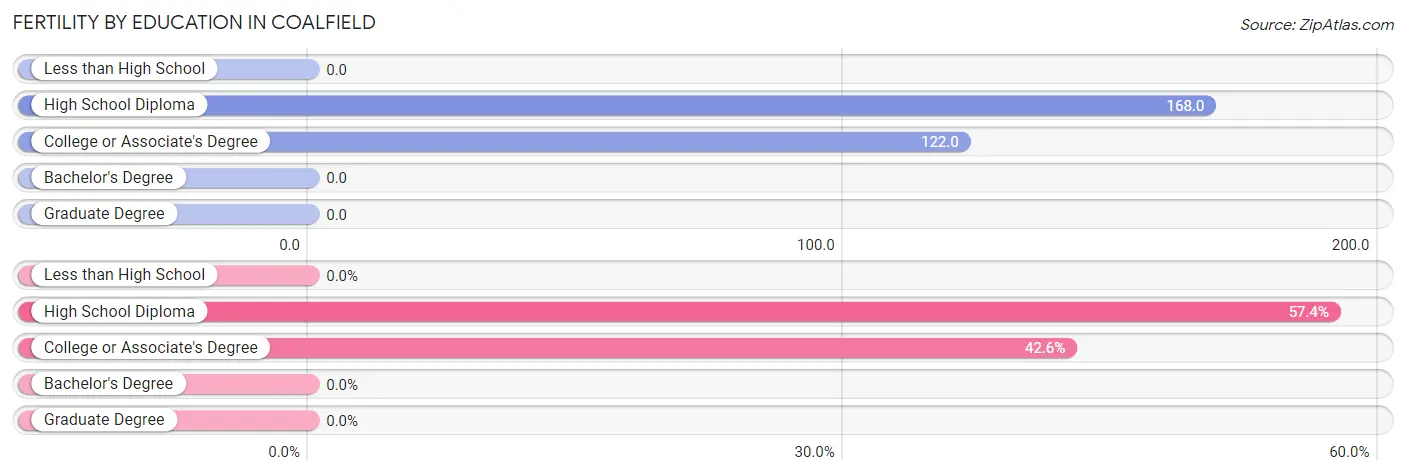
Fertility by Education in Coalfield
| Educational Attainment | Women with Births | Births / 1,000 Women |
| Less than High School | 0 (0.0%) | 0.0 |
| High School Diploma | 31 (57.4%) | 168.0 |
| College or Associate's Degree | 23 (42.6%) | 122.0 |
| Bachelor's Degree | 0 (0.0%) | 0.0 |
| Graduate Degree | 0 (0.0%) | 0.0 |
| Total | 54 (100.0%) | 76.0 |
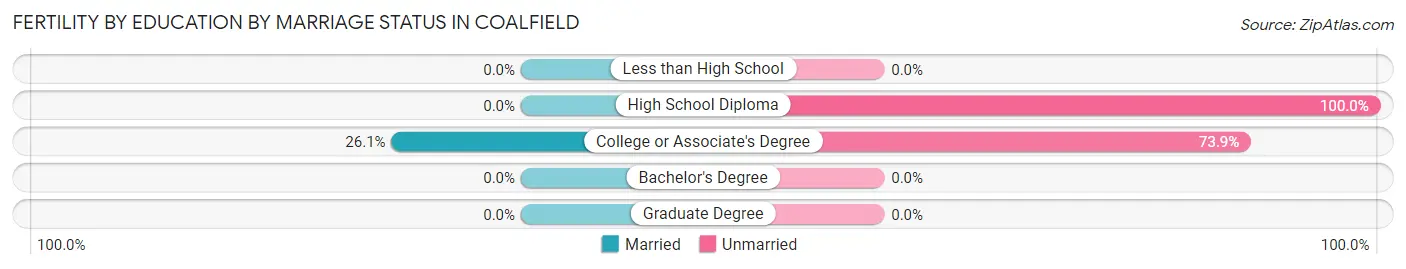
Fertility by Education by Marriage Status in Coalfield
88.9% of women with births in Coalfield are unmarried. Women with the educational attainment of college or associate's degree are most likely to be married with 26.1% of them married at childbirth, while women with the educational attainment of high school diploma are least likely to be married with 100.0% of them unmarried at childbirth.
| Educational Attainment | Married | Unmarried |
| Less than High School | 0 (0.0%) | 0 (0.0%) |
| High School Diploma | 0 (0.0%) | 31 (100.0%) |
| College or Associate's Degree | 6 (26.1%) | 17 (73.9%) |
| Bachelor's Degree | 0 (0.0%) | 0 (0.0%) |
| Graduate Degree | 0 (0.0%) | 0 (0.0%) |
| Total | 6 (11.1%) | 48 (88.9%) |
Employment Characteristics in Coalfield
Employment by Class of Employer in Coalfield
Among the 1,163 employed individuals in Coalfield, private company employees (729 | 62.7%), local government employees (169 | 14.5%), and not-for-profit organizations (107 | 9.2%) make up the most common classes of employment.
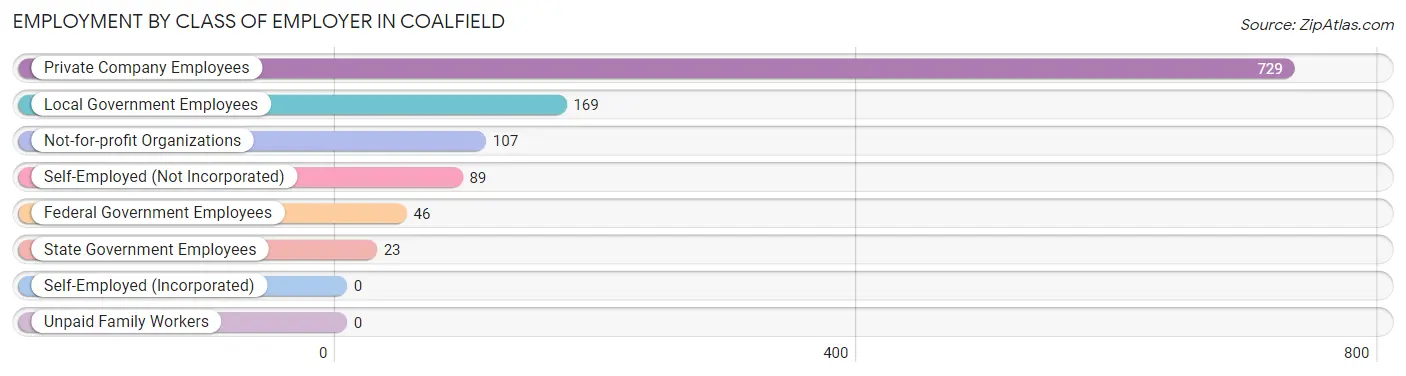
| Employer Class | # Employees | % Employees |
| Private Company Employees | 729 | 62.7% |
| Self-Employed (Incorporated) | 0 | 0.0% |
| Self-Employed (Not Incorporated) | 89 | 7.6% |
| Not-for-profit Organizations | 107 | 9.2% |
| Local Government Employees | 169 | 14.5% |
| State Government Employees | 23 | 2.0% |
| Federal Government Employees | 46 | 4.0% |
| Unpaid Family Workers | 0 | 0.0% |
| Total | 1,163 | 100.0% |
Employment Status by Age in Coalfield
According to the labor force statistics for Coalfield, out of the total population over 16 years of age (2,045), 59.2% or 1,211 individuals are in the labor force, with 4.0% or 48 of them unemployed. The age group with the highest labor force participation rate is 45 to 54 years, with 89.4% or 370 individuals in the labor force. Within the labor force, the 35 to 44 years age range has the highest percentage of unemployed individuals, with 15.9% or 48 of them being unemployed.
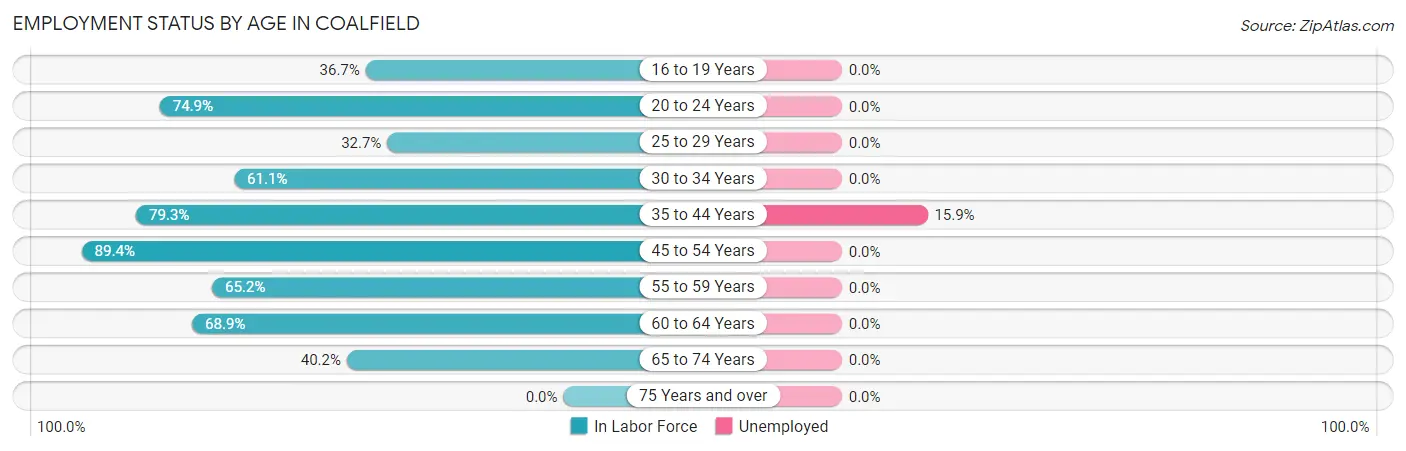
| Age Bracket | In Labor Force | Unemployed |
| 16 to 19 Years | 40 (36.7%) | 0 (0.0%) |
| 20 to 24 Years | 128 (74.9%) | 0 (0.0%) |
| 25 to 29 Years | 17 (32.7%) | 0 (0.0%) |
| 30 to 34 Years | 143 (61.1%) | 0 (0.0%) |
| 35 to 44 Years | 302 (79.3%) | 48 (15.9%) |
| 45 to 54 Years | 370 (89.4%) | 0 (0.0%) |
| 55 to 59 Years | 43 (65.2%) | 0 (0.0%) |
| 60 to 64 Years | 62 (68.9%) | 0 (0.0%) |
| 65 to 74 Years | 106 (40.2%) | 0 (0.0%) |
| 75 Years and over | 0 (0.0%) | 0 (0.0%) |
| Total | 1,211 (59.2%) | 48 (4.0%) |
Employment Status by Educational Attainment in Coalfield
According to labor force statistics for Coalfield, 75.7% of individuals (936) out of the total population between 25 and 64 years of age (1,237) are in the labor force, with 5.1% or 48 of them being unemployed. The group with the highest labor force participation rate are those with the educational attainment of bachelor's degree or higher, with 100.0% or 407 individuals in the labor force. Within the labor force, individuals with less than high school education have the highest percentage of unemployment, with 53.7% or 22 of them being unemployed.
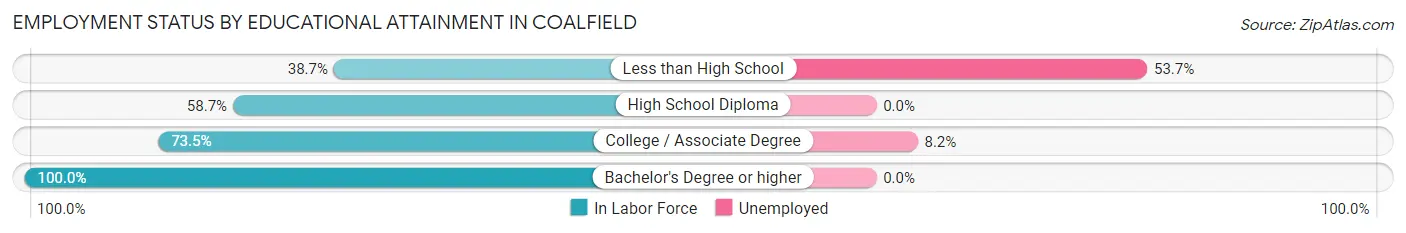
| Educational Attainment | In Labor Force | Unemployed |
| Less than High School | 41 (38.7%) | 57 (53.7%) |
| High School Diploma | 172 (58.7%) | 0 (0.0%) |
| College / Associate Degree | 317 (73.5%) | 35 (8.2%) |
| Bachelor's Degree or higher | 407 (100.0%) | 0 (0.0%) |
| Total | 936 (75.7%) | 63 (5.1%) |
Employment Occupations by Sex in Coalfield
Management, Business, Science and Arts Occupations
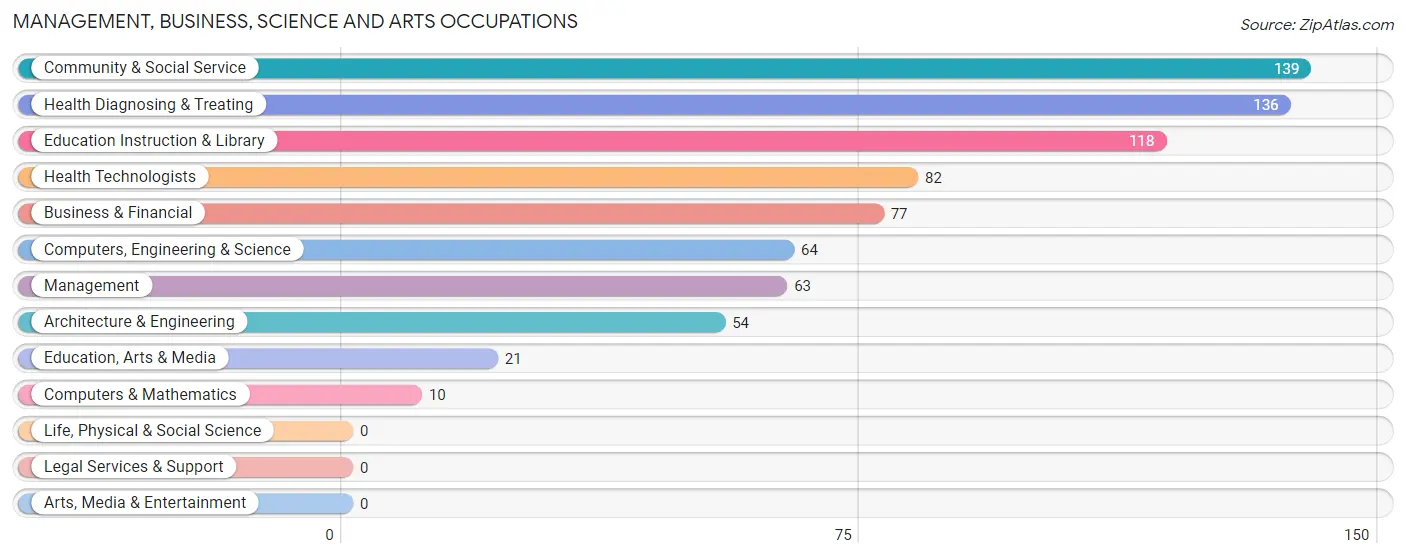
The most common Management, Business, Science and Arts occupations in Coalfield are Community & Social Service (139 | 11.9%), Health Diagnosing & Treating (136 | 11.7%), Education Instruction & Library (118 | 10.2%), Health Technologists (82 | 7.0%), and Business & Financial (77 | 6.6%).
Management, Business, Science and Arts Occupations by Sex
Within the Management, Business, Science and Arts occupations in Coalfield, the most male-oriented occupations are Architecture & Engineering (100.0%), Computers, Engineering & Science (84.4%), and Health Technologists (50.0%), while the most female-oriented occupations are Computers & Mathematics (100.0%), Education, Arts & Media (100.0%), and Management (98.4%).
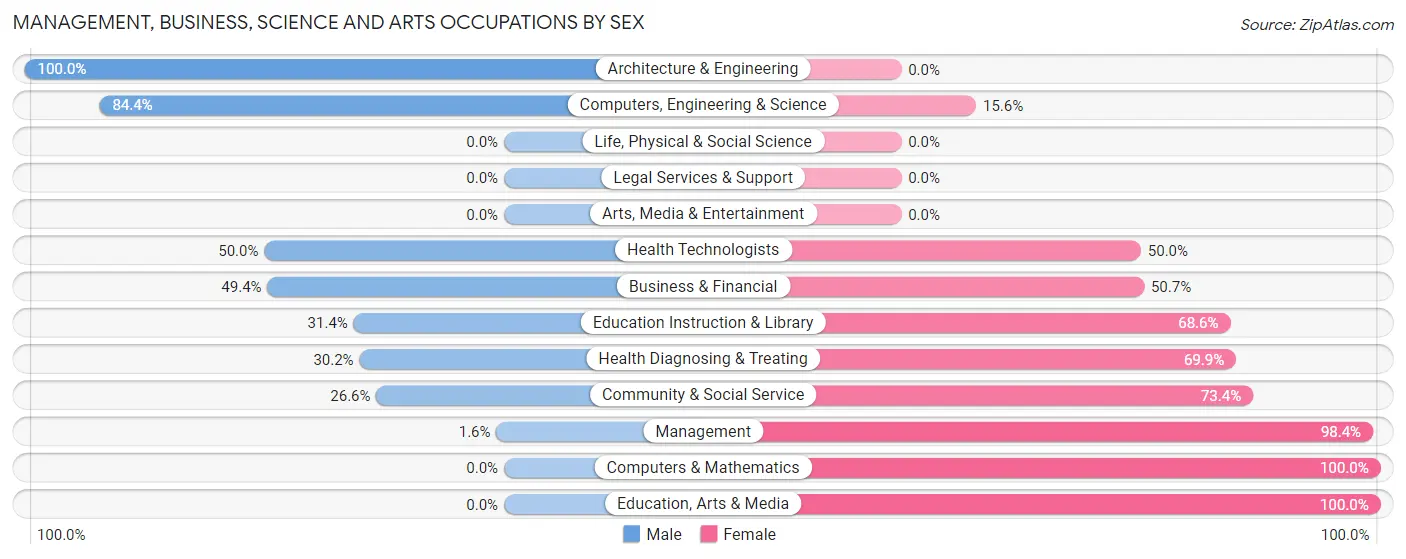
| Occupation | Male | Female |
| Management | 1 (1.6%) | 62 (98.4%) |
| Business & Financial | 38 (49.3%) | 39 (50.6%) |
| Computers, Engineering & Science | 54 (84.4%) | 10 (15.6%) |
| Computers & Mathematics | 0 (0.0%) | 10 (100.0%) |
| Architecture & Engineering | 54 (100.0%) | 0 (0.0%) |
| Life, Physical & Social Science | 0 (0.0%) | 0 (0.0%) |
| Community & Social Service | 37 (26.6%) | 102 (73.4%) |
| Education, Arts & Media | 0 (0.0%) | 21 (100.0%) |
| Legal Services & Support | 0 (0.0%) | 0 (0.0%) |
| Education Instruction & Library | 37 (31.4%) | 81 (68.6%) |
| Arts, Media & Entertainment | 0 (0.0%) | 0 (0.0%) |
| Health Diagnosing & Treating | 41 (30.1%) | 95 (69.9%) |
| Health Technologists | 41 (50.0%) | 41 (50.0%) |
| Total (Category) | 171 (35.7%) | 308 (64.3%) |
| Total (Overall) | 627 (53.9%) | 536 (46.1%) |
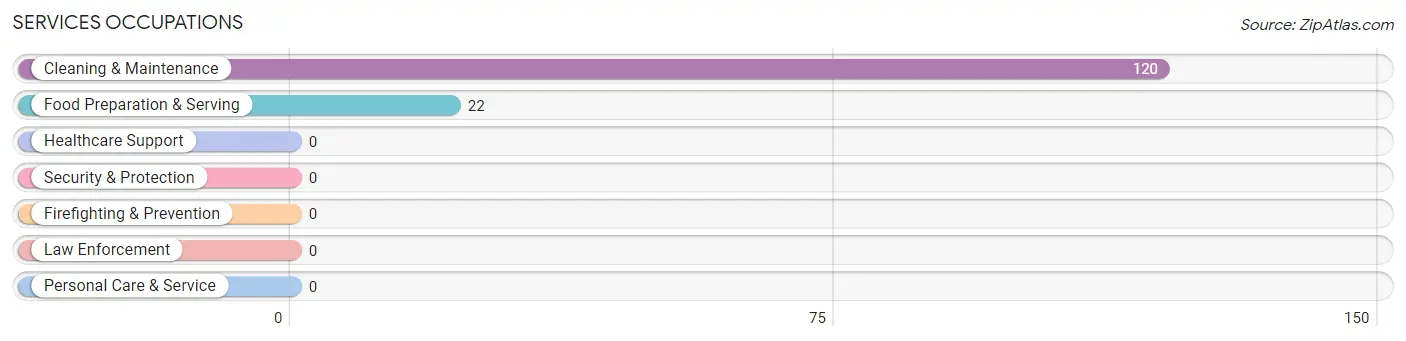
Services Occupations
The most common Services occupations in Coalfield are Cleaning & Maintenance (120 | 10.3%), and Food Preparation & Serving (22 | 1.9%).
Services Occupations by Sex
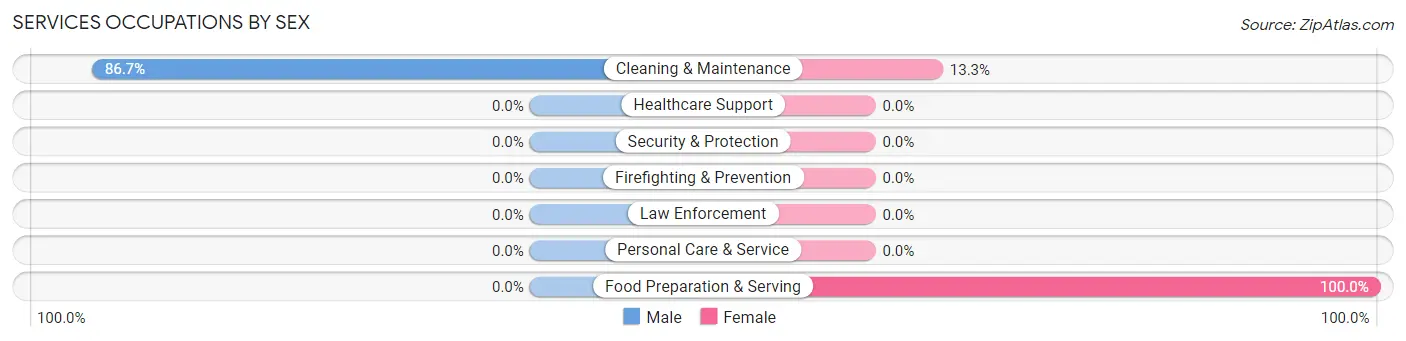
| Occupation | Male | Female |
| Healthcare Support | 0 (0.0%) | 0 (0.0%) |
| Security & Protection | 0 (0.0%) | 0 (0.0%) |
| Firefighting & Prevention | 0 (0.0%) | 0 (0.0%) |
| Law Enforcement | 0 (0.0%) | 0 (0.0%) |
| Food Preparation & Serving | 0 (0.0%) | 22 (100.0%) |
| Cleaning & Maintenance | 104 (86.7%) | 16 (13.3%) |
| Personal Care & Service | 0 (0.0%) | 0 (0.0%) |
| Total (Category) | 104 (73.2%) | 38 (26.8%) |
| Total (Overall) | 627 (53.9%) | 536 (46.1%) |
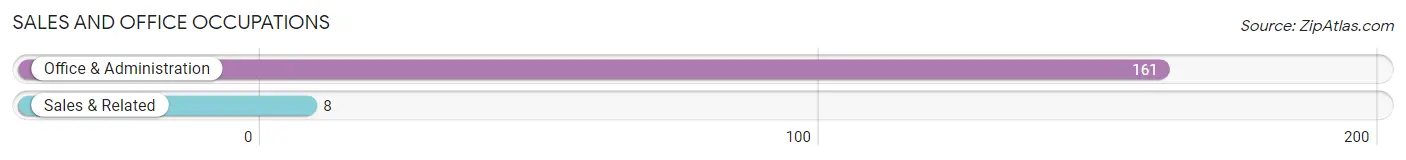
Sales and Office Occupations
The most common Sales and Office occupations in Coalfield are Office & Administration (161 | 13.8%), and Sales & Related (8 | 0.7%).
Sales and Office Occupations by Sex
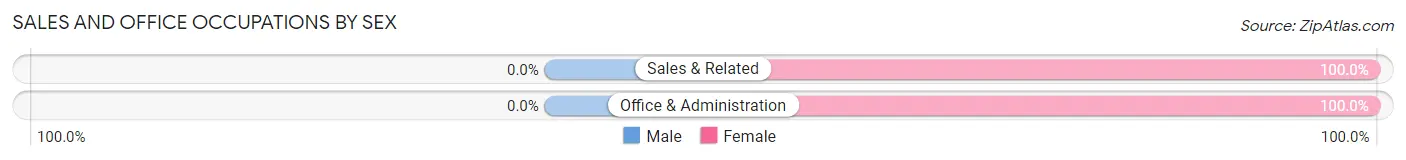
| Occupation | Male | Female |
| Sales & Related | 0 (0.0%) | 8 (100.0%) |
| Office & Administration | 0 (0.0%) | 161 (100.0%) |
| Total (Category) | 0 (0.0%) | 169 (100.0%) |
| Total (Overall) | 627 (53.9%) | 536 (46.1%) |
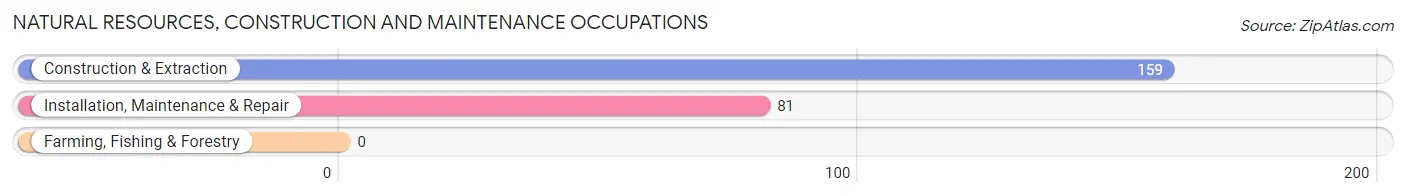
Natural Resources, Construction and Maintenance Occupations
The most common Natural Resources, Construction and Maintenance occupations in Coalfield are Construction & Extraction (159 | 13.7%), and Installation, Maintenance & Repair (81 | 7.0%).
Natural Resources, Construction and Maintenance Occupations by Sex
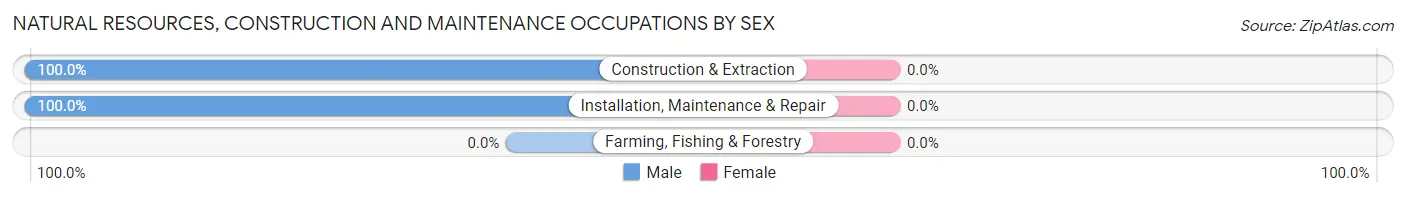
| Occupation | Male | Female |
| Farming, Fishing & Forestry | 0 (0.0%) | 0 (0.0%) |
| Construction & Extraction | 159 (100.0%) | 0 (0.0%) |
| Installation, Maintenance & Repair | 81 (100.0%) | 0 (0.0%) |
| Total (Category) | 240 (100.0%) | 0 (0.0%) |
| Total (Overall) | 627 (53.9%) | 536 (46.1%) |
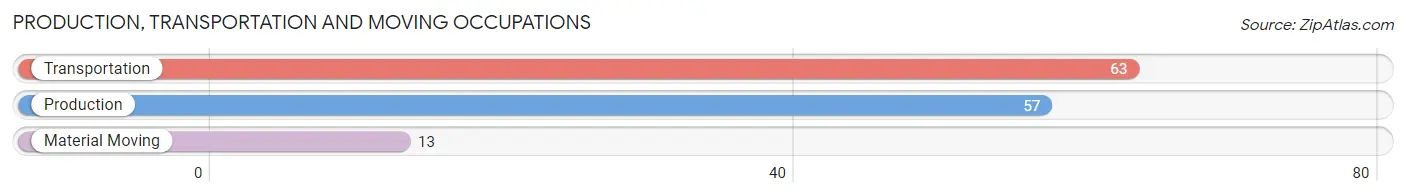
Production, Transportation and Moving Occupations
The most common Production, Transportation and Moving occupations in Coalfield are Transportation (63 | 5.4%), Production (57 | 4.9%), and Material Moving (13 | 1.1%).
Production, Transportation and Moving Occupations by Sex
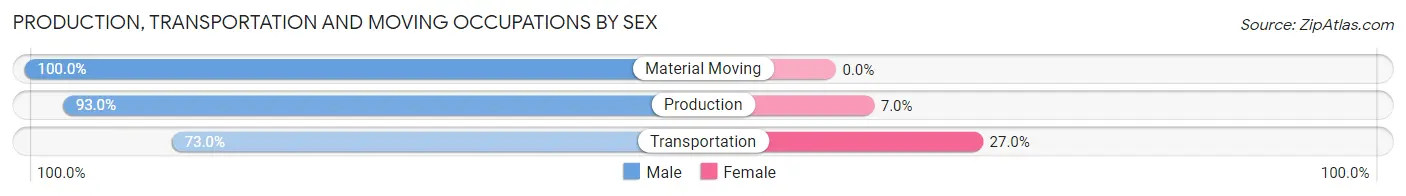
| Occupation | Male | Female |
| Production | 53 (93.0%) | 4 (7.0%) |
| Transportation | 46 (73.0%) | 17 (27.0%) |
| Material Moving | 13 (100.0%) | 0 (0.0%) |
| Total (Category) | 112 (84.2%) | 21 (15.8%) |
| Total (Overall) | 627 (53.9%) | 536 (46.1%) |
Employment Industries by Sex in Coalfield
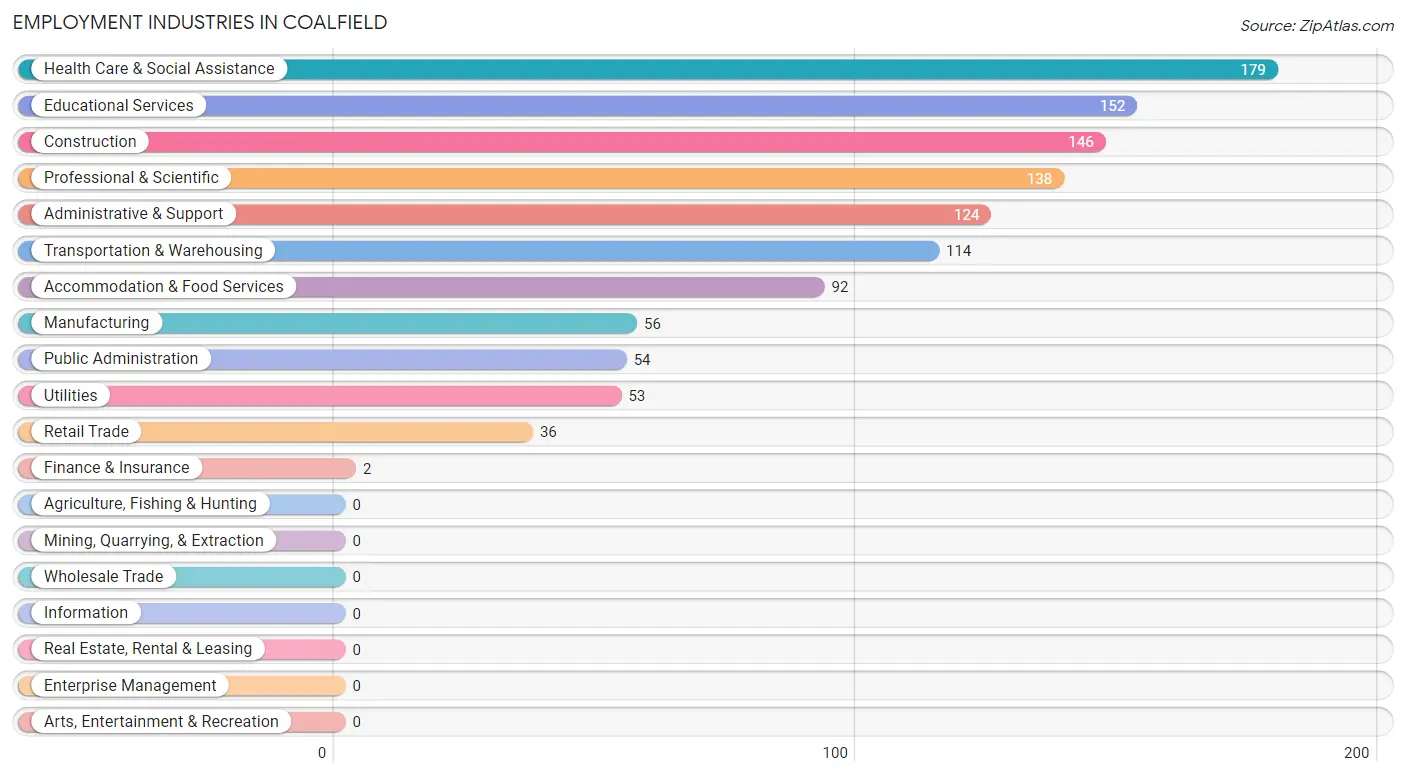
Employment Industries in Coalfield
The major employment industries in Coalfield include Health Care & Social Assistance (179 | 15.4%), Educational Services (152 | 13.1%), Construction (146 | 12.6%), Professional & Scientific (138 | 11.9%), and Administrative & Support (124 | 10.7%).
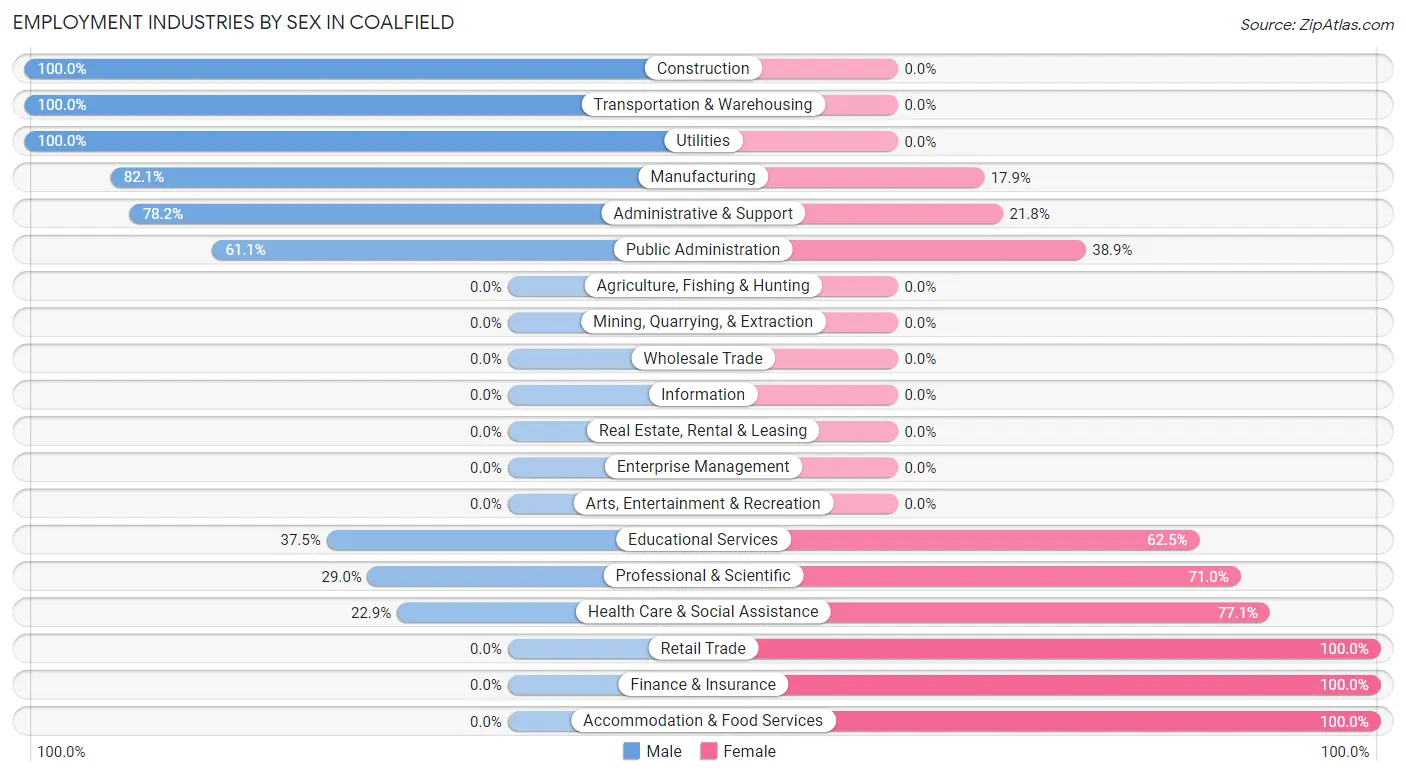
Employment Industries by Sex in Coalfield
The Coalfield industries that see more men than women are Construction (100.0%), Transportation & Warehousing (100.0%), and Utilities (100.0%), whereas the industries that tend to have a higher number of women are Retail Trade (100.0%), Finance & Insurance (100.0%), and Accommodation & Food Services (100.0%).
| Industry | Male | Female |
| Agriculture, Fishing & Hunting | 0 (0.0%) | 0 (0.0%) |
| Mining, Quarrying, & Extraction | 0 (0.0%) | 0 (0.0%) |
| Construction | 146 (100.0%) | 0 (0.0%) |
| Manufacturing | 46 (82.1%) | 10 (17.9%) |
| Wholesale Trade | 0 (0.0%) | 0 (0.0%) |
| Retail Trade | 0 (0.0%) | 36 (100.0%) |
| Transportation & Warehousing | 114 (100.0%) | 0 (0.0%) |
| Utilities | 53 (100.0%) | 0 (0.0%) |
| Information | 0 (0.0%) | 0 (0.0%) |
| Finance & Insurance | 0 (0.0%) | 2 (100.0%) |
| Real Estate, Rental & Leasing | 0 (0.0%) | 0 (0.0%) |
| Professional & Scientific | 40 (29.0%) | 98 (71.0%) |
| Enterprise Management | 0 (0.0%) | 0 (0.0%) |
| Administrative & Support | 97 (78.2%) | 27 (21.8%) |
| Educational Services | 57 (37.5%) | 95 (62.5%) |
| Health Care & Social Assistance | 41 (22.9%) | 138 (77.1%) |
| Arts, Entertainment & Recreation | 0 (0.0%) | 0 (0.0%) |
| Accommodation & Food Services | 0 (0.0%) | 92 (100.0%) |
| Public Administration | 33 (61.1%) | 21 (38.9%) |
| Total | 627 (53.9%) | 536 (46.1%) |
Education in Coalfield
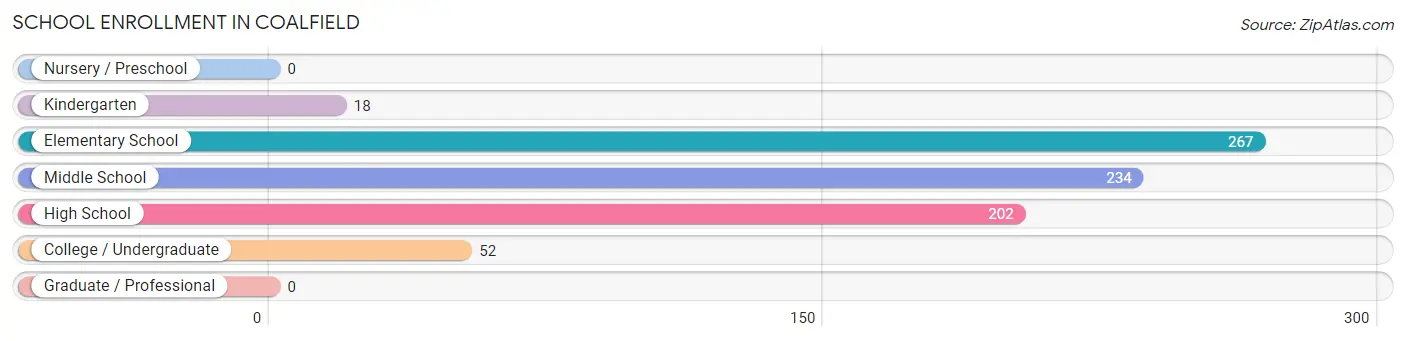
School Enrollment in Coalfield
The most common levels of schooling among the 773 students in Coalfield are elementary school (267 | 34.5%), middle school (234 | 30.3%), and high school (202 | 26.1%).
| School Level | # Students | % Students |
| Nursery / Preschool | 0 | 0.0% |
| Kindergarten | 18 | 2.3% |
| Elementary School | 267 | 34.5% |
| Middle School | 234 | 30.3% |
| High School | 202 | 26.1% |
| College / Undergraduate | 52 | 6.7% |
| Graduate / Professional | 0 | 0.0% |
| Total | 773 | 100.0% |
School Enrollment by Age by Funding Source in Coalfield
Out of a total of 773 students who are enrolled in schools in Coalfield, 76 (9.8%) attend a private institution, while the remaining 697 (90.2%) are enrolled in public schools. The age group of 25 to 34 year olds has the highest likelihood of being enrolled in private schools, with 18 (62.1% in the age bracket) enrolled. Conversely, the age group of 10 to 14 year olds has the lowest likelihood of being enrolled in a private school, with 306 (100.0% in the age bracket) attending a public institution.
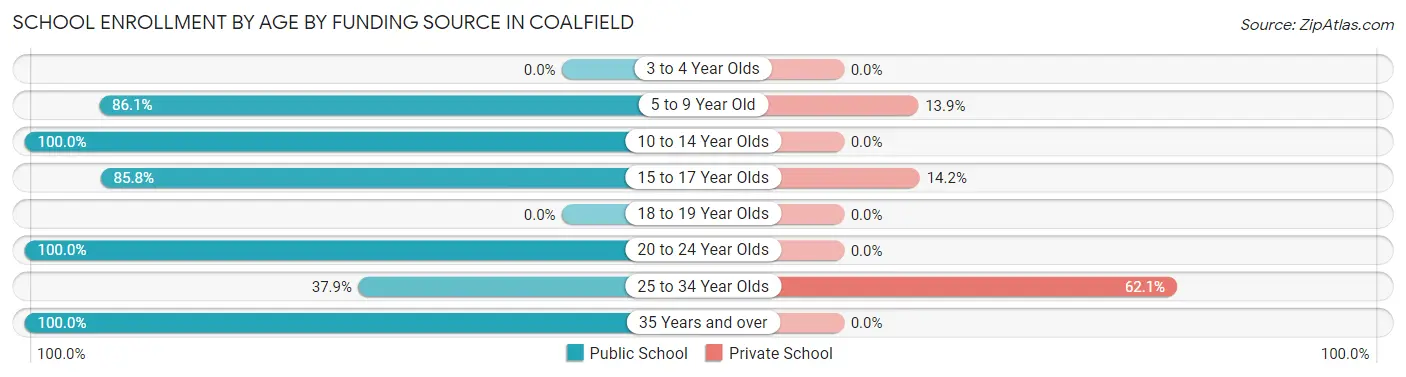
| Age Bracket | Public School | Private School |
| 3 to 4 Year Olds | 0 (0.0%) | 0 (0.0%) |
| 5 to 9 Year Old | 248 (86.1%) | 40 (13.9%) |
| 10 to 14 Year Olds | 306 (100.0%) | 0 (0.0%) |
| 15 to 17 Year Olds | 109 (85.8%) | 18 (14.2%) |
| 18 to 19 Year Olds | 0 (0.0%) | 0 (0.0%) |
| 20 to 24 Year Olds | 6 (100.0%) | 0 (0.0%) |
| 25 to 34 Year Olds | 11 (37.9%) | 18 (62.1%) |
| 35 Years and over | 17 (100.0%) | 0 (0.0%) |
| Total | 697 (90.2%) | 76 (9.8%) |
Educational Attainment by Field of Study in Coalfield
Social sciences (136 | 20.6%), business (136 | 20.6%), education (135 | 20.4%), engineering (91 | 13.8%), and science & technology (82 | 12.4%) are the most common fields of study among 660 individuals in Coalfield who have obtained a bachelor's degree or higher.
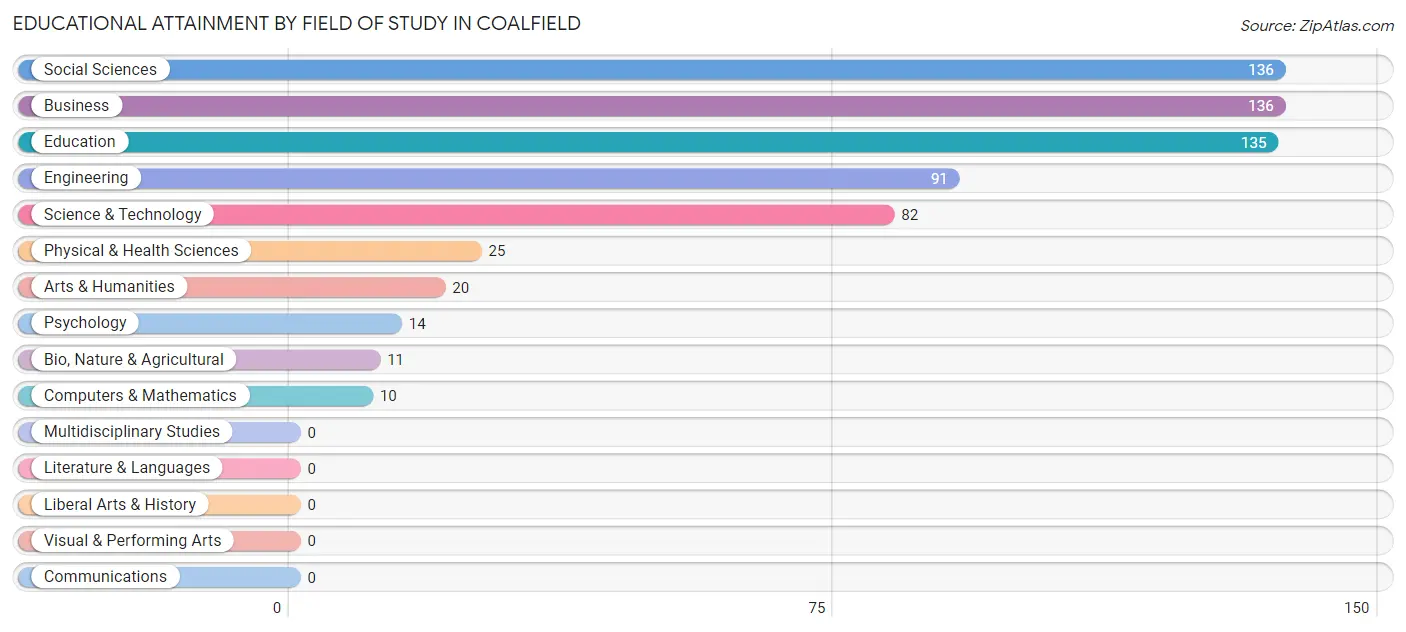
| Field of Study | # Graduates | % Graduates |
| Computers & Mathematics | 10 | 1.5% |
| Bio, Nature & Agricultural | 11 | 1.7% |
| Physical & Health Sciences | 25 | 3.8% |
| Psychology | 14 | 2.1% |
| Social Sciences | 136 | 20.6% |
| Engineering | 91 | 13.8% |
| Multidisciplinary Studies | 0 | 0.0% |
| Science & Technology | 82 | 12.4% |
| Business | 136 | 20.6% |
| Education | 135 | 20.4% |
| Literature & Languages | 0 | 0.0% |
| Liberal Arts & History | 0 | 0.0% |
| Visual & Performing Arts | 0 | 0.0% |
| Communications | 0 | 0.0% |
| Arts & Humanities | 20 | 3.0% |
| Total | 660 | 100.0% |
Transportation & Commute in Coalfield
Vehicle Availability by Sex in Coalfield
The most prevalent vehicle ownership categories in Coalfield are males with 3 vehicles (237, accounting for 37.8%) and females with 3 vehicles (130, making up 44.2%).
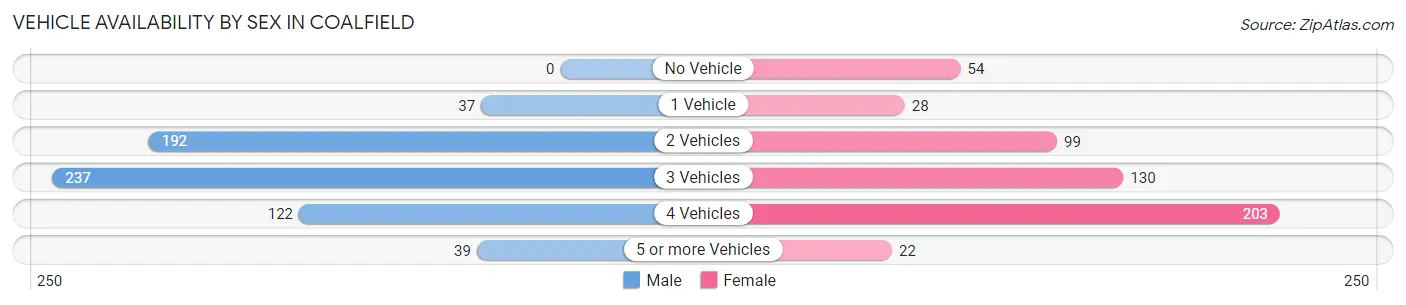
| Vehicles Available | Male | Female |
| No Vehicle | 0 (0.0%) | 54 (10.1%) |
| 1 Vehicle | 37 (5.9%) | 28 (5.2%) |
| 2 Vehicles | 192 (30.6%) | 99 (18.5%) |
| 3 Vehicles | 237 (37.8%) | 130 (24.2%) |
| 4 Vehicles | 122 (19.5%) | 203 (37.9%) |
| 5 or more Vehicles | 39 (6.2%) | 22 (4.1%) |
| Total | 627 (100.0%) | 536 (100.0%) |
Commute Time in Coalfield
The most frequently occuring commute durations in Coalfield are 45 to 59 minutes (271 commuters, 24.5%), 30 to 34 minutes (269 commuters, 24.3%), and less than 5 minutes (111 commuters, 10.0%).
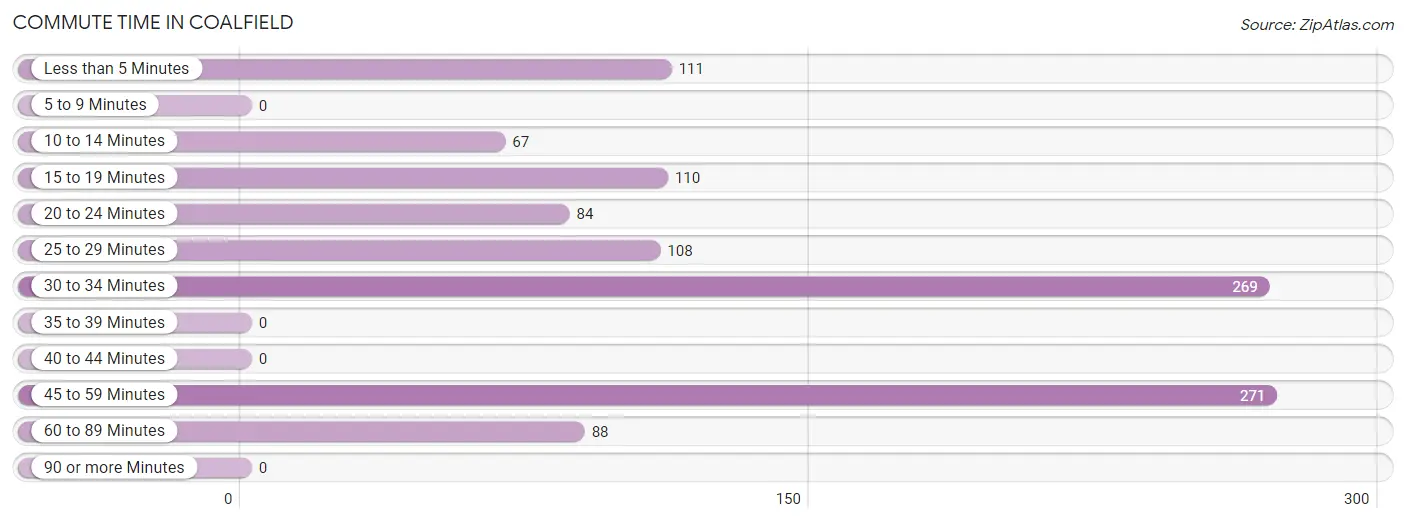
| Commute Time | # Commuters | % Commuters |
| Less than 5 Minutes | 111 | 10.0% |
| 5 to 9 Minutes | 0 | 0.0% |
| 10 to 14 Minutes | 67 | 6.0% |
| 15 to 19 Minutes | 110 | 9.9% |
| 20 to 24 Minutes | 84 | 7.6% |
| 25 to 29 Minutes | 108 | 9.8% |
| 30 to 34 Minutes | 269 | 24.3% |
| 35 to 39 Minutes | 0 | 0.0% |
| 40 to 44 Minutes | 0 | 0.0% |
| 45 to 59 Minutes | 271 | 24.5% |
| 60 to 89 Minutes | 88 | 7.9% |
| 90 or more Minutes | 0 | 0.0% |
Commute Time by Sex in Coalfield
The most common commute times in Coalfield are 30 to 34 minutes (235 commuters, 39.9%) for males and 45 to 59 minutes (211 commuters, 40.7%) for females.
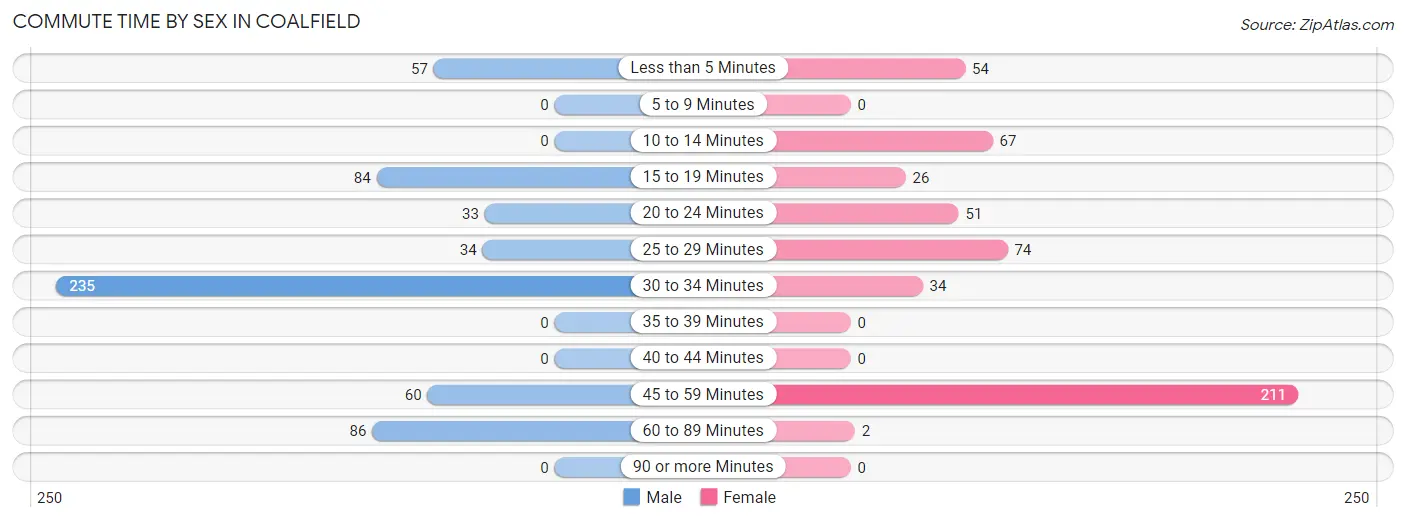
| Commute Time | Male | Female |
| Less than 5 Minutes | 57 (9.7%) | 54 (10.4%) |
| 5 to 9 Minutes | 0 (0.0%) | 0 (0.0%) |
| 10 to 14 Minutes | 0 (0.0%) | 67 (12.9%) |
| 15 to 19 Minutes | 84 (14.3%) | 26 (5.0%) |
| 20 to 24 Minutes | 33 (5.6%) | 51 (9.8%) |
| 25 to 29 Minutes | 34 (5.8%) | 74 (14.3%) |
| 30 to 34 Minutes | 235 (39.9%) | 34 (6.6%) |
| 35 to 39 Minutes | 0 (0.0%) | 0 (0.0%) |
| 40 to 44 Minutes | 0 (0.0%) | 0 (0.0%) |
| 45 to 59 Minutes | 60 (10.2%) | 211 (40.7%) |
| 60 to 89 Minutes | 86 (14.6%) | 2 (0.4%) |
| 90 or more Minutes | 0 (0.0%) | 0 (0.0%) |
Time of Departure to Work by Sex in Coalfield
The most frequent times of departure to work in Coalfield are 6:30 AM to 6:59 AM (150, 25.5%) for males and 5:30 AM to 5:59 AM (140, 27.0%) for females.
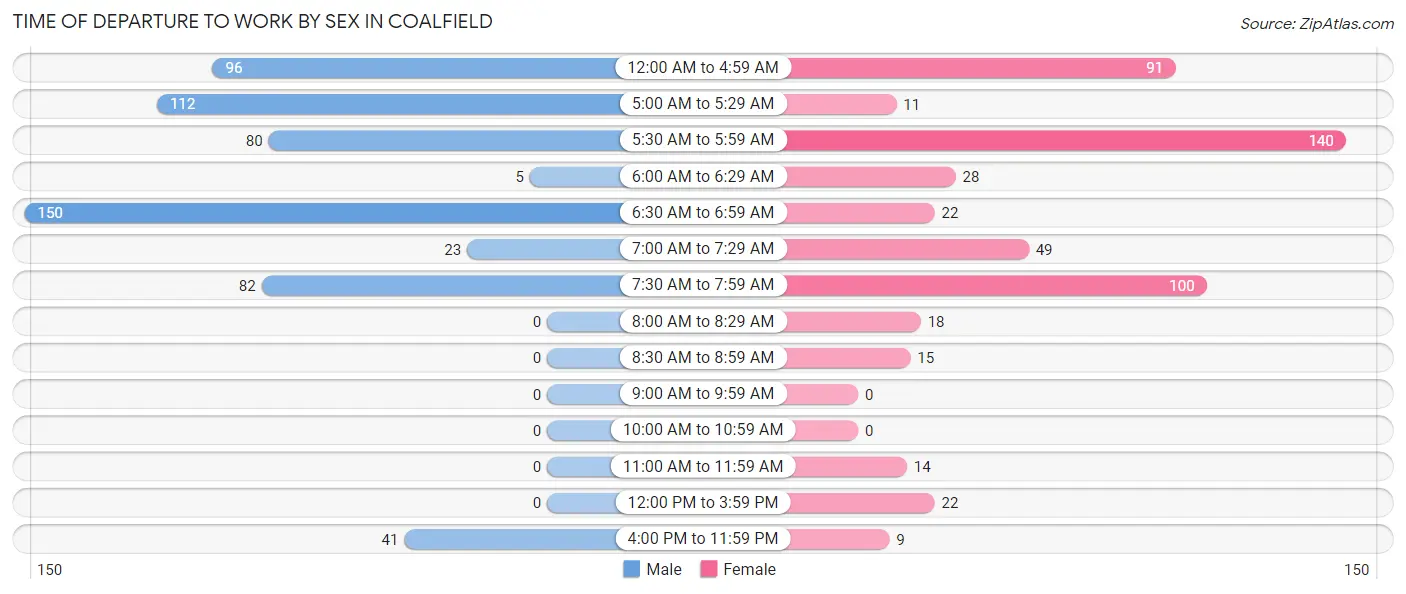
| Time of Departure | Male | Female |
| 12:00 AM to 4:59 AM | 96 (16.3%) | 91 (17.5%) |
| 5:00 AM to 5:29 AM | 112 (19.0%) | 11 (2.1%) |
| 5:30 AM to 5:59 AM | 80 (13.6%) | 140 (27.0%) |
| 6:00 AM to 6:29 AM | 5 (0.9%) | 28 (5.4%) |
| 6:30 AM to 6:59 AM | 150 (25.5%) | 22 (4.2%) |
| 7:00 AM to 7:29 AM | 23 (3.9%) | 49 (9.4%) |
| 7:30 AM to 7:59 AM | 82 (13.9%) | 100 (19.3%) |
| 8:00 AM to 8:29 AM | 0 (0.0%) | 18 (3.5%) |
| 8:30 AM to 8:59 AM | 0 (0.0%) | 15 (2.9%) |
| 9:00 AM to 9:59 AM | 0 (0.0%) | 0 (0.0%) |
| 10:00 AM to 10:59 AM | 0 (0.0%) | 0 (0.0%) |
| 11:00 AM to 11:59 AM | 0 (0.0%) | 14 (2.7%) |
| 12:00 PM to 3:59 PM | 0 (0.0%) | 22 (4.2%) |
| 4:00 PM to 11:59 PM | 41 (7.0%) | 9 (1.7%) |
| Total | 589 (100.0%) | 519 (100.0%) |
Housing Occupancy in Coalfield
Occupancy by Ownership in Coalfield
Of the total 915 dwellings in Coalfield, owner-occupied units account for 665 (72.7%), while renter-occupied units make up 250 (27.3%).
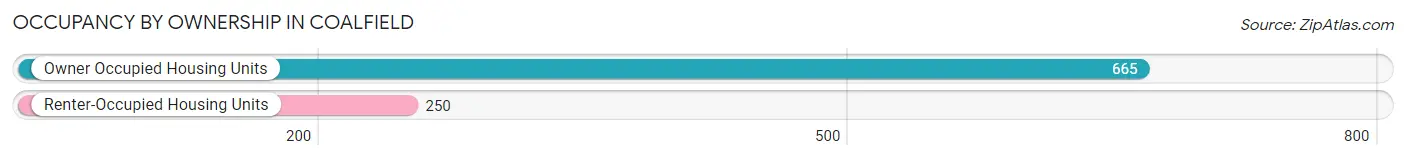
| Occupancy | # Housing Units | % Housing Units |
| Owner Occupied Housing Units | 665 | 72.7% |
| Renter-Occupied Housing Units | 250 | 27.3% |
| Total Occupied Housing Units | 915 | 100.0% |
Occupancy by Household Size in Coalfield
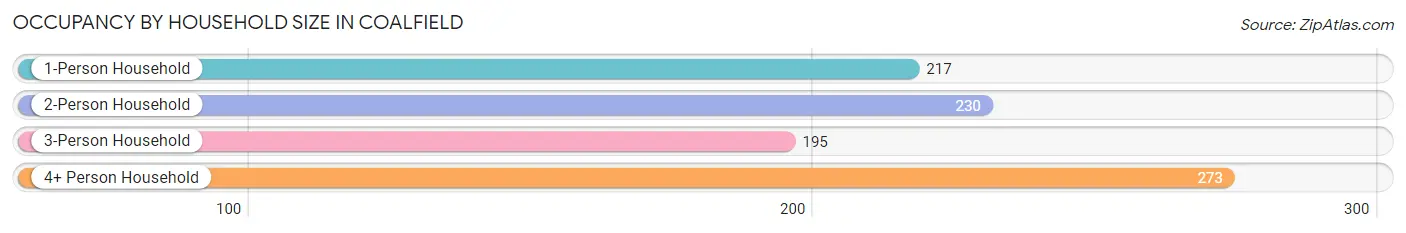
| Household Size | # Housing Units | % Housing Units |
| 1-Person Household | 217 | 23.7% |
| 2-Person Household | 230 | 25.1% |
| 3-Person Household | 195 | 21.3% |
| 4+ Person Household | 273 | 29.8% |
| Total Housing Units | 915 | 100.0% |
Occupancy by Ownership by Household Size in Coalfield
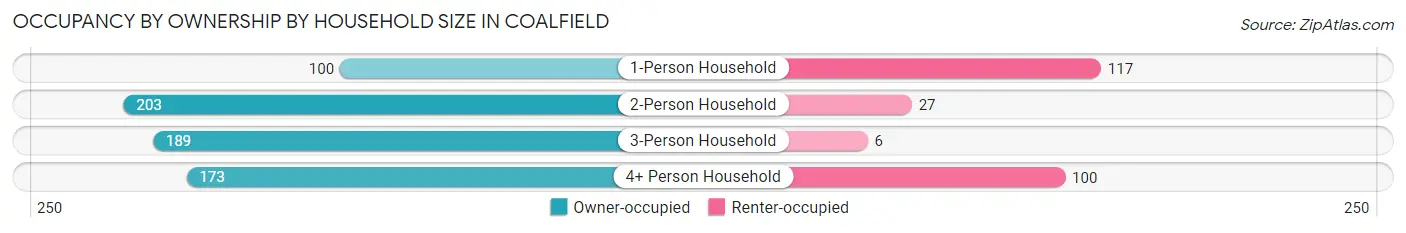
| Household Size | Owner-occupied | Renter-occupied |
| 1-Person Household | 100 (46.1%) | 117 (53.9%) |
| 2-Person Household | 203 (88.3%) | 27 (11.7%) |
| 3-Person Household | 189 (96.9%) | 6 (3.1%) |
| 4+ Person Household | 173 (63.4%) | 100 (36.6%) |
| Total Housing Units | 665 (72.7%) | 250 (27.3%) |
Occupancy by Educational Attainment in Coalfield
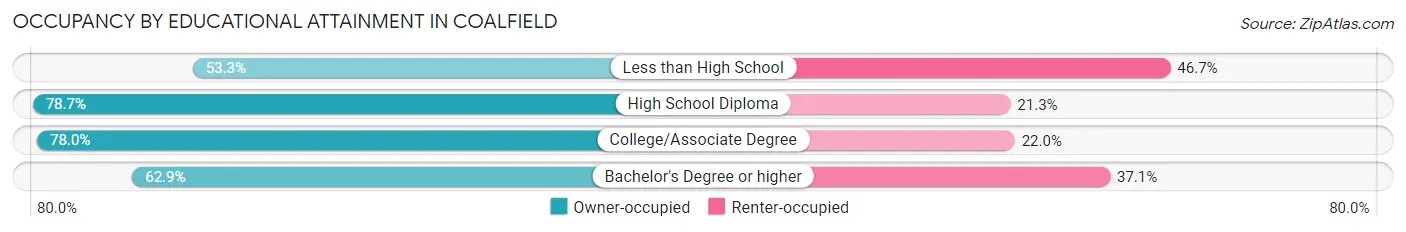
| Household Size | Owner-occupied | Renter-occupied |
| Less than High School | 40 (53.3%) | 35 (46.7%) |
| High School Diploma | 207 (78.7%) | 56 (21.3%) |
| College/Associate Degree | 284 (78.0%) | 80 (22.0%) |
| Bachelor's Degree or higher | 134 (62.9%) | 79 (37.1%) |
Occupancy by Age of Householder in Coalfield
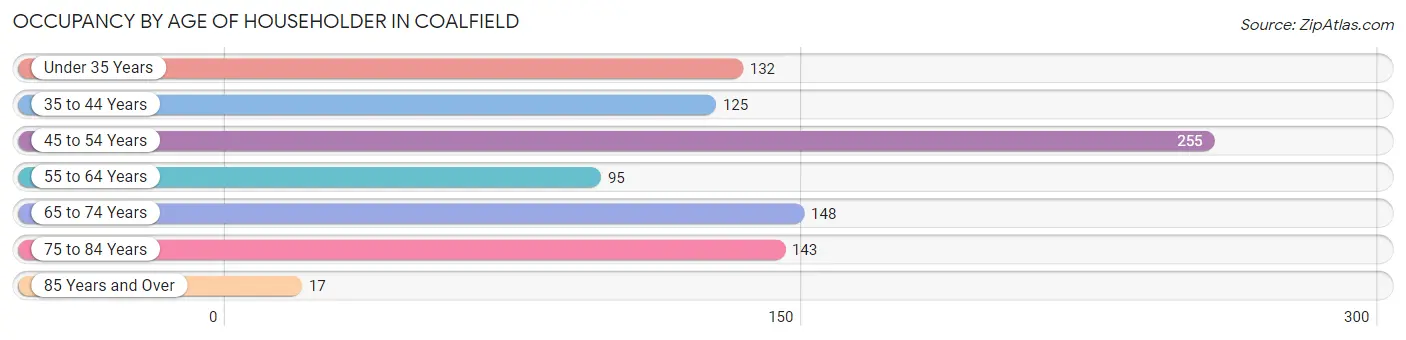
| Age Bracket | # Households | % Households |
| Under 35 Years | 132 | 14.4% |
| 35 to 44 Years | 125 | 13.7% |
| 45 to 54 Years | 255 | 27.9% |
| 55 to 64 Years | 95 | 10.4% |
| 65 to 74 Years | 148 | 16.2% |
| 75 to 84 Years | 143 | 15.6% |
| 85 Years and Over | 17 | 1.9% |
| Total | 915 | 100.0% |
Housing Finances in Coalfield
Median Income by Occupancy in Coalfield
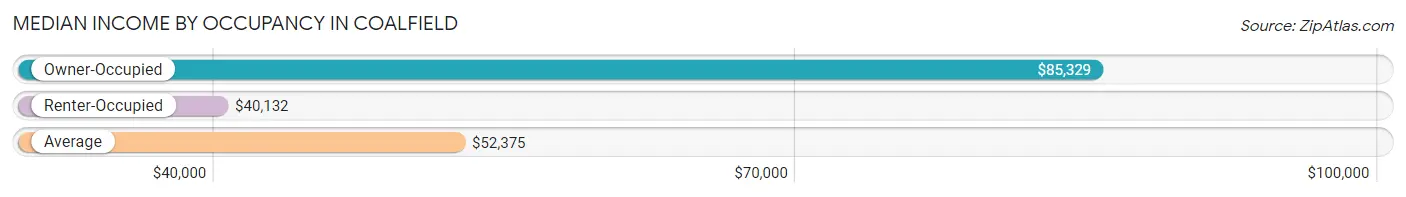
| Occupancy Type | # Households | Median Income |
| Owner-Occupied | 665 (72.7%) | $85,329 |
| Renter-Occupied | 250 (27.3%) | $40,132 |
| Average | 915 (100.0%) | $52,375 |
Occupancy by Householder Income Bracket in Coalfield
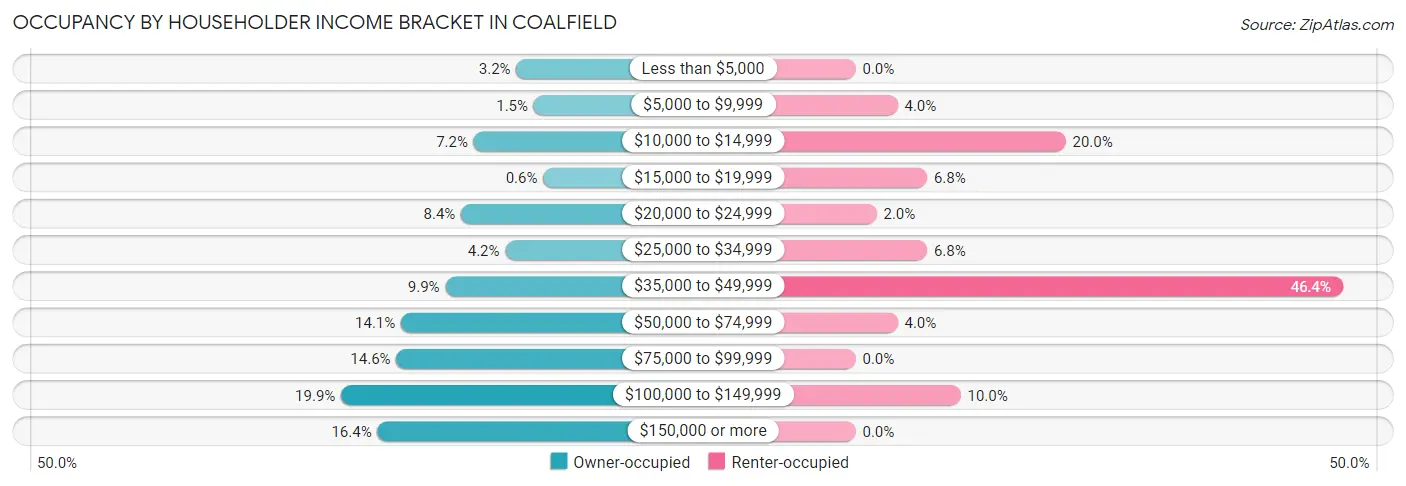
| Income Bracket | Owner-occupied | Renter-occupied |
| Less than $5,000 | 21 (3.2%) | 0 (0.0%) |
| $5,000 to $9,999 | 10 (1.5%) | 10 (4.0%) |
| $10,000 to $14,999 | 48 (7.2%) | 50 (20.0%) |
| $15,000 to $19,999 | 4 (0.6%) | 17 (6.8%) |
| $20,000 to $24,999 | 56 (8.4%) | 5 (2.0%) |
| $25,000 to $34,999 | 28 (4.2%) | 17 (6.8%) |
| $35,000 to $49,999 | 66 (9.9%) | 116 (46.4%) |
| $50,000 to $74,999 | 94 (14.1%) | 10 (4.0%) |
| $75,000 to $99,999 | 97 (14.6%) | 0 (0.0%) |
| $100,000 to $149,999 | 132 (19.9%) | 25 (10.0%) |
| $150,000 or more | 109 (16.4%) | 0 (0.0%) |
| Total | 665 (100.0%) | 250 (100.0%) |
Monthly Housing Cost Tiers in Coalfield
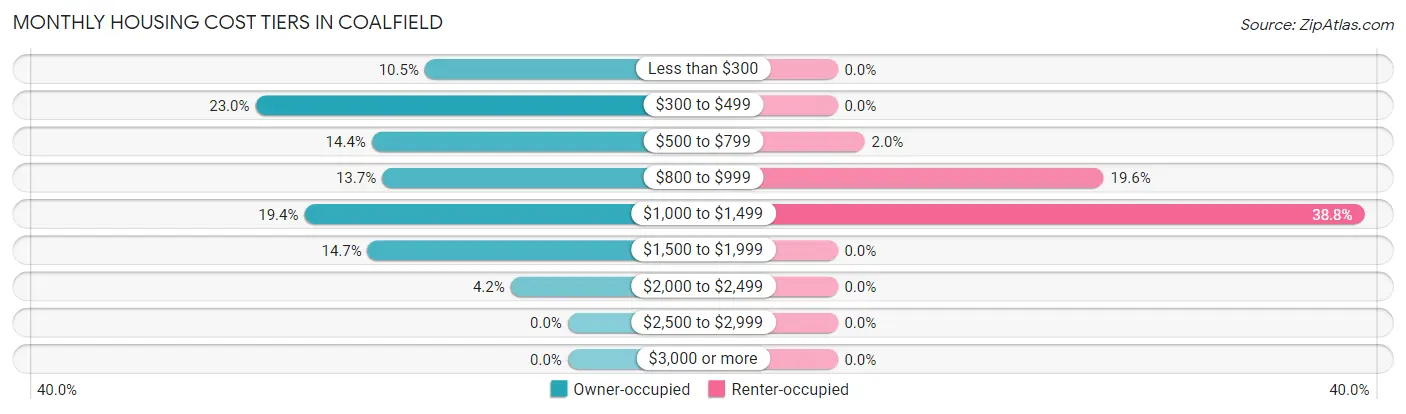
| Monthly Cost | Owner-occupied | Renter-occupied |
| Less than $300 | 70 (10.5%) | 0 (0.0%) |
| $300 to $499 | 153 (23.0%) | 0 (0.0%) |
| $500 to $799 | 96 (14.4%) | 5 (2.0%) |
| $800 to $999 | 91 (13.7%) | 49 (19.6%) |
| $1,000 to $1,499 | 129 (19.4%) | 97 (38.8%) |
| $1,500 to $1,999 | 98 (14.7%) | 0 (0.0%) |
| $2,000 to $2,499 | 28 (4.2%) | 0 (0.0%) |
| $2,500 to $2,999 | 0 (0.0%) | 0 (0.0%) |
| $3,000 or more | 0 (0.0%) | 0 (0.0%) |
| Total | 665 (100.0%) | 250 (100.0%) |
Physical Housing Characteristics in Coalfield
Housing Structures in Coalfield
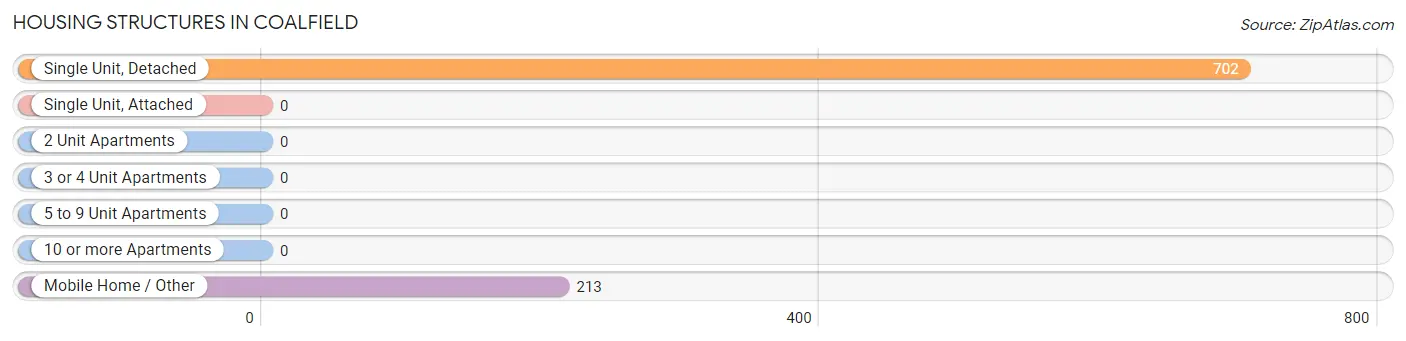
| Structure Type | # Housing Units | % Housing Units |
| Single Unit, Detached | 702 | 76.7% |
| Single Unit, Attached | 0 | 0.0% |
| 2 Unit Apartments | 0 | 0.0% |
| 3 or 4 Unit Apartments | 0 | 0.0% |
| 5 to 9 Unit Apartments | 0 | 0.0% |
| 10 or more Apartments | 0 | 0.0% |
| Mobile Home / Other | 213 | 23.3% |
| Total | 915 | 100.0% |
Housing Structures by Occupancy in Coalfield
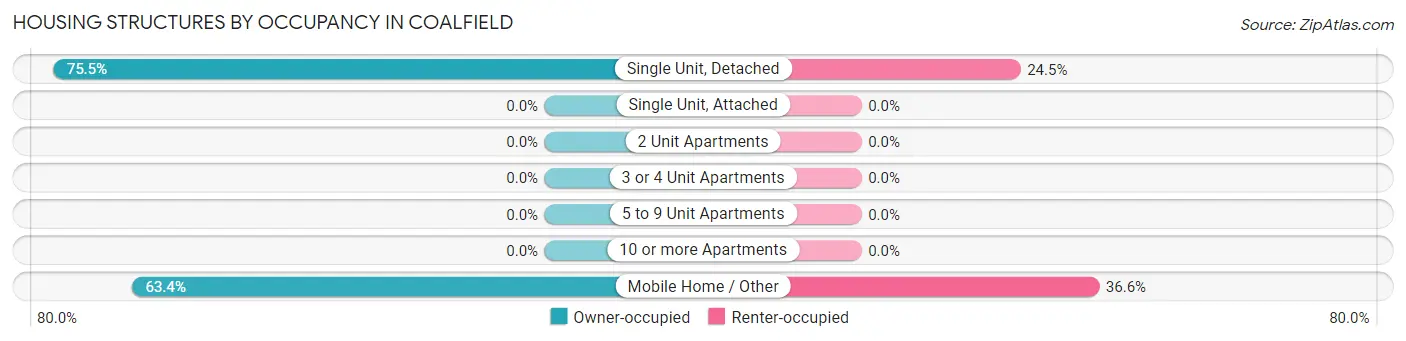
| Structure Type | Owner-occupied | Renter-occupied |
| Single Unit, Detached | 530 (75.5%) | 172 (24.5%) |
| Single Unit, Attached | 0 (0.0%) | 0 (0.0%) |
| 2 Unit Apartments | 0 (0.0%) | 0 (0.0%) |
| 3 or 4 Unit Apartments | 0 (0.0%) | 0 (0.0%) |
| 5 to 9 Unit Apartments | 0 (0.0%) | 0 (0.0%) |
| 10 or more Apartments | 0 (0.0%) | 0 (0.0%) |
| Mobile Home / Other | 135 (63.4%) | 78 (36.6%) |
| Total | 665 (72.7%) | 250 (27.3%) |
Housing Structures by Number of Rooms in Coalfield
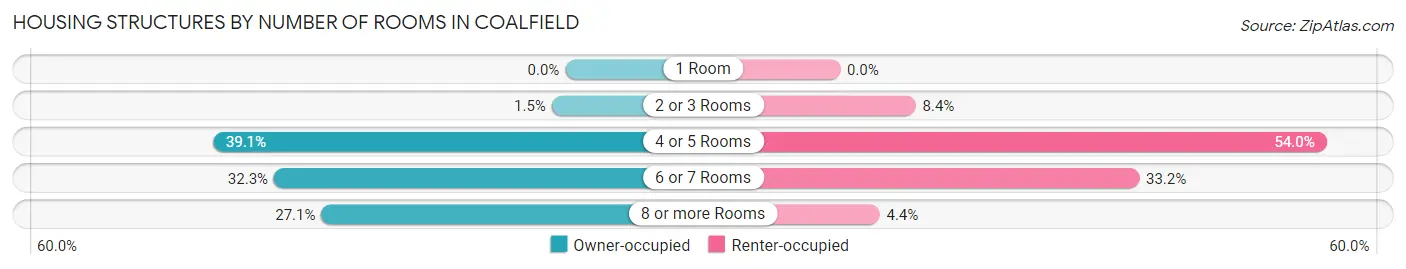
| Number of Rooms | Owner-occupied | Renter-occupied |
| 1 Room | 0 (0.0%) | 0 (0.0%) |
| 2 or 3 Rooms | 10 (1.5%) | 21 (8.4%) |
| 4 or 5 Rooms | 260 (39.1%) | 135 (54.0%) |
| 6 or 7 Rooms | 215 (32.3%) | 83 (33.2%) |
| 8 or more Rooms | 180 (27.1%) | 11 (4.4%) |
| Total | 665 (100.0%) | 250 (100.0%) |
Housing Structure by Heating Type in Coalfield
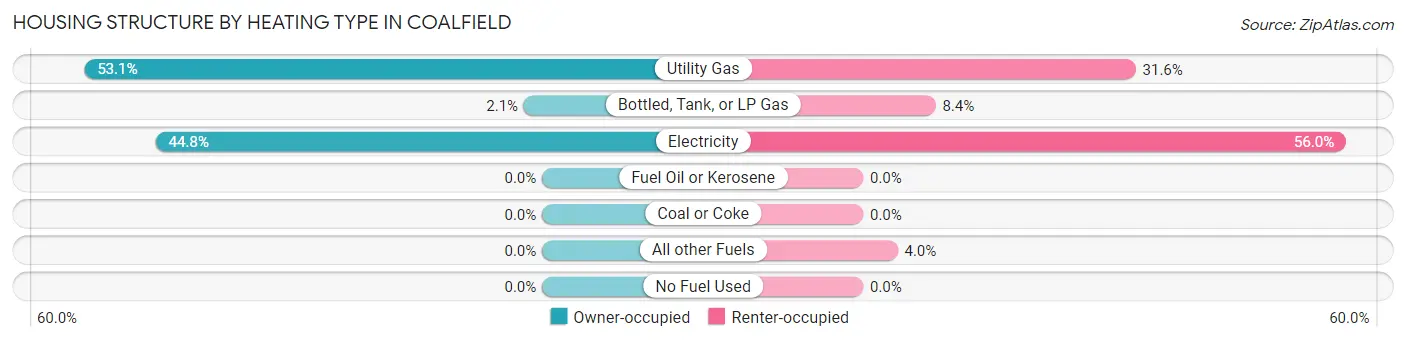
| Heating Type | Owner-occupied | Renter-occupied |
| Utility Gas | 353 (53.1%) | 79 (31.6%) |
| Bottled, Tank, or LP Gas | 14 (2.1%) | 21 (8.4%) |
| Electricity | 298 (44.8%) | 140 (56.0%) |
| Fuel Oil or Kerosene | 0 (0.0%) | 0 (0.0%) |
| Coal or Coke | 0 (0.0%) | 0 (0.0%) |
| All other Fuels | 0 (0.0%) | 10 (4.0%) |
| No Fuel Used | 0 (0.0%) | 0 (0.0%) |
| Total | 665 (100.0%) | 250 (100.0%) |
Household Vehicle Usage in Coalfield
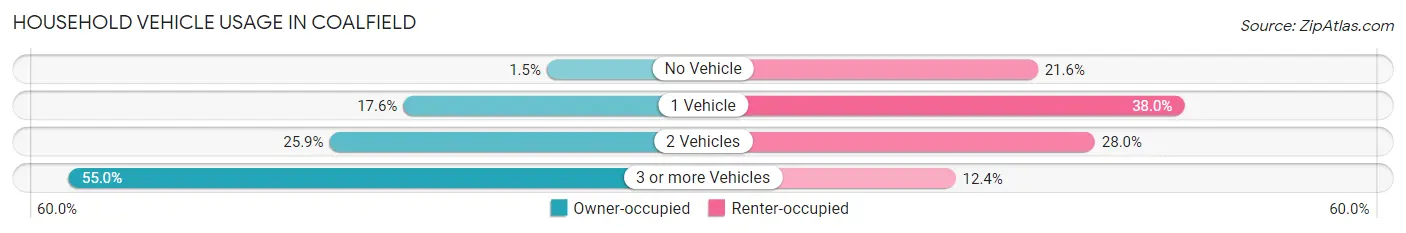
| Vehicles per Household | Owner-occupied | Renter-occupied |
| No Vehicle | 10 (1.5%) | 54 (21.6%) |
| 1 Vehicle | 117 (17.6%) | 95 (38.0%) |
| 2 Vehicles | 172 (25.9%) | 70 (28.0%) |
| 3 or more Vehicles | 366 (55.0%) | 31 (12.4%) |
| Total | 665 (100.0%) | 250 (100.0%) |
Real Estate & Mortgages in Coalfield
Real Estate and Mortgage Overview in Coalfield
| Characteristic | Without Mortgage | With Mortgage |
| Housing Units | 316 | 349 |
| Median Property Value | $193,600 | $159,100 |
| Median Household Income | $45,341 | $78 |
| Monthly Housing Costs | $372 | $0 |
| Real Estate Taxes | $1,008 | $12 |
Property Value by Mortgage Status in Coalfield
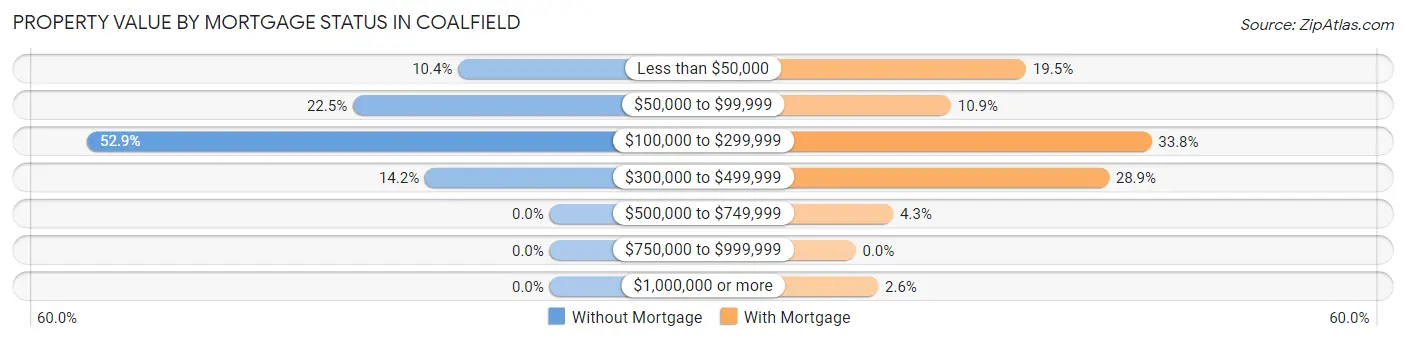
| Property Value | Without Mortgage | With Mortgage |
| Less than $50,000 | 33 (10.4%) | 68 (19.5%) |
| $50,000 to $99,999 | 71 (22.5%) | 38 (10.9%) |
| $100,000 to $299,999 | 167 (52.8%) | 118 (33.8%) |
| $300,000 to $499,999 | 45 (14.2%) | 101 (28.9%) |
| $500,000 to $749,999 | 0 (0.0%) | 15 (4.3%) |
| $750,000 to $999,999 | 0 (0.0%) | 0 (0.0%) |
| $1,000,000 or more | 0 (0.0%) | 9 (2.6%) |
| Total | 316 (100.0%) | 349 (100.0%) |
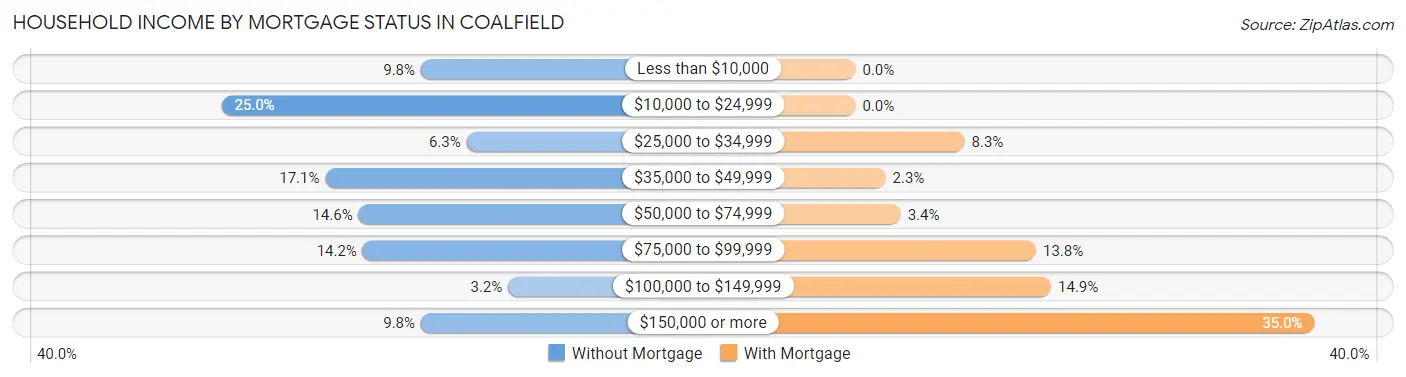
Household Income by Mortgage Status in Coalfield
| Household Income | Without Mortgage | With Mortgage |
| Less than $10,000 | 31 (9.8%) | 0 (0.0%) |
| $10,000 to $24,999 | 79 (25.0%) | 0 (0.0%) |
| $25,000 to $34,999 | 20 (6.3%) | 29 (8.3%) |
| $35,000 to $49,999 | 54 (17.1%) | 8 (2.3%) |
| $50,000 to $74,999 | 46 (14.6%) | 12 (3.4%) |
| $75,000 to $99,999 | 45 (14.2%) | 48 (13.8%) |
| $100,000 to $149,999 | 10 (3.2%) | 52 (14.9%) |
| $150,000 or more | 31 (9.8%) | 122 (35.0%) |
| Total | 316 (100.0%) | 349 (100.0%) |
Property Value to Household Income Ratio in Coalfield
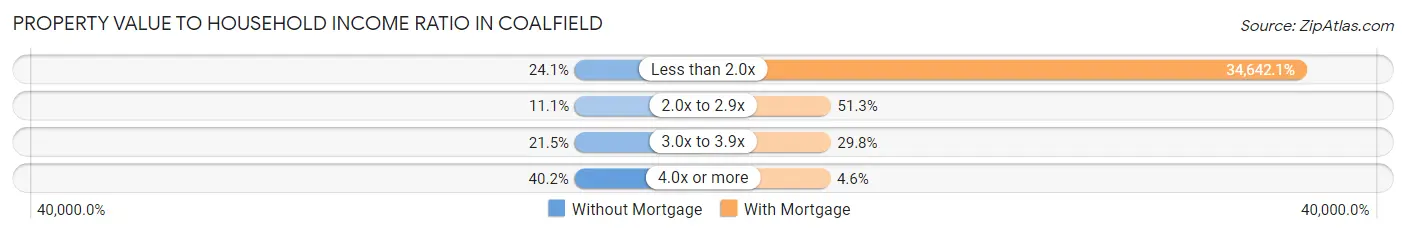
| Value-to-Income Ratio | Without Mortgage | With Mortgage |
| Less than 2.0x | 76 (24.0%) | 120,901 (34,642.1%) |
| 2.0x to 2.9x | 35 (11.1%) | 179 (51.3%) |
| 3.0x to 3.9x | 68 (21.5%) | 104 (29.8%) |
| 4.0x or more | 127 (40.2%) | 16 (4.6%) |
| Total | 316 (100.0%) | 349 (100.0%) |
Real Estate Taxes by Mortgage Status in Coalfield
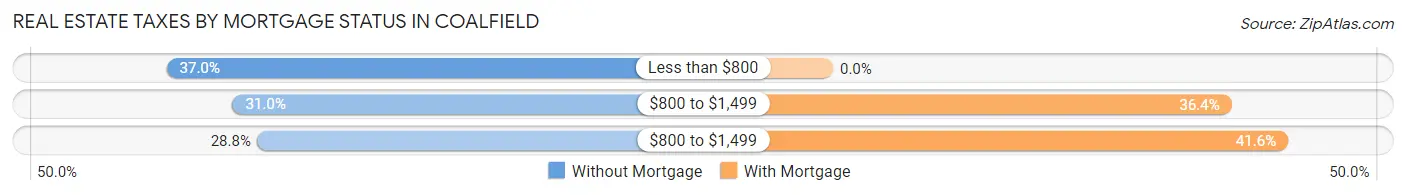
| Property Taxes | Without Mortgage | With Mortgage |
| Less than $800 | 117 (37.0%) | 0 (0.0%) |
| $800 to $1,499 | 98 (31.0%) | 127 (36.4%) |
| $800 to $1,499 | 91 (28.8%) | 145 (41.5%) |
| Total | 316 (100.0%) | 349 (100.0%) |
Health & Disability in Coalfield
Health Insurance Coverage by Age in Coalfield
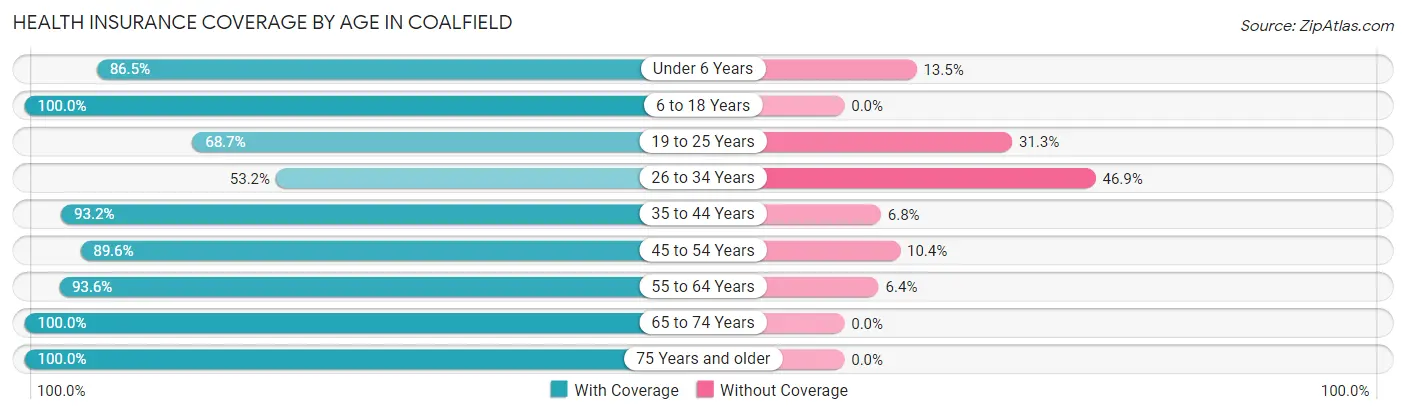
| Age Bracket | With Coverage | Without Coverage |
| Under 6 Years | 180 (86.5%) | 28 (13.5%) |
| 6 to 18 Years | 721 (100.0%) | 0 (0.0%) |
| 19 to 25 Years | 145 (68.7%) | 66 (31.3%) |
| 26 to 34 Years | 152 (53.1%) | 134 (46.9%) |
| 35 to 44 Years | 355 (93.2%) | 26 (6.8%) |
| 45 to 54 Years | 371 (89.6%) | 43 (10.4%) |
| 55 to 64 Years | 146 (93.6%) | 10 (6.4%) |
| 65 to 74 Years | 264 (100.0%) | 0 (0.0%) |
| 75 Years and older | 264 (100.0%) | 0 (0.0%) |
| Total | 2,598 (89.4%) | 307 (10.6%) |
Health Insurance Coverage by Citizenship Status in Coalfield
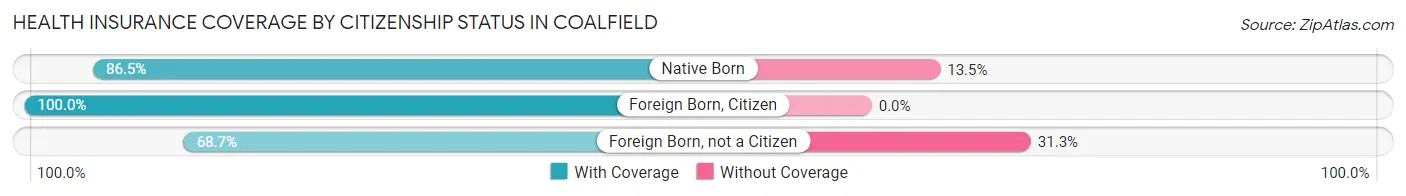
| Citizenship Status | With Coverage | Without Coverage |
| Native Born | 180 (86.5%) | 28 (13.5%) |
| Foreign Born, Citizen | 721 (100.0%) | 0 (0.0%) |
| Foreign Born, not a Citizen | 145 (68.7%) | 66 (31.3%) |
Health Insurance Coverage by Household Income in Coalfield
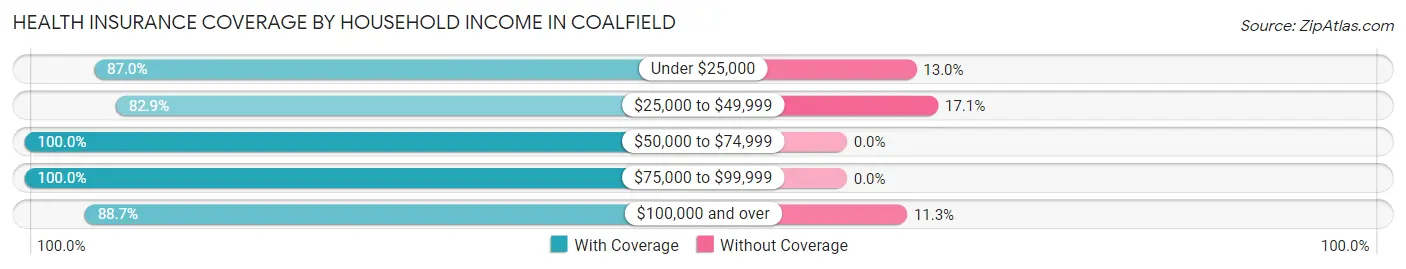
| Household Income | With Coverage | Without Coverage |
| Under $25,000 | 574 (87.0%) | 86 (13.0%) |
| $25,000 to $49,999 | 456 (82.9%) | 94 (17.1%) |
| $50,000 to $74,999 | 223 (100.0%) | 0 (0.0%) |
| $75,000 to $99,999 | 345 (100.0%) | 0 (0.0%) |
| $100,000 and over | 1,000 (88.7%) | 127 (11.3%) |
Public vs Private Health Insurance Coverage by Age in Coalfield
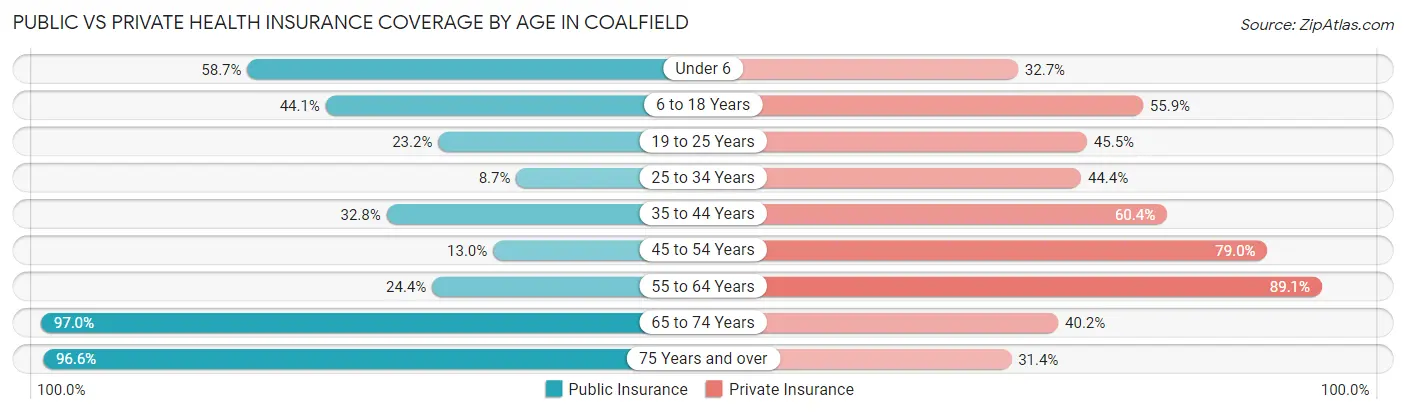
| Age Bracket | Public Insurance | Private Insurance |
| Under 6 | 122 (58.7%) | 68 (32.7%) |
| 6 to 18 Years | 318 (44.1%) | 403 (55.9%) |
| 19 to 25 Years | 49 (23.2%) | 96 (45.5%) |
| 25 to 34 Years | 25 (8.7%) | 127 (44.4%) |
| 35 to 44 Years | 125 (32.8%) | 230 (60.4%) |
| 45 to 54 Years | 54 (13.0%) | 327 (79.0%) |
| 55 to 64 Years | 38 (24.4%) | 139 (89.1%) |
| 65 to 74 Years | 256 (97.0%) | 106 (40.2%) |
| 75 Years and over | 255 (96.6%) | 83 (31.4%) |
| Total | 1,242 (42.7%) | 1,579 (54.3%) |
Disability Status by Sex by Age in Coalfield
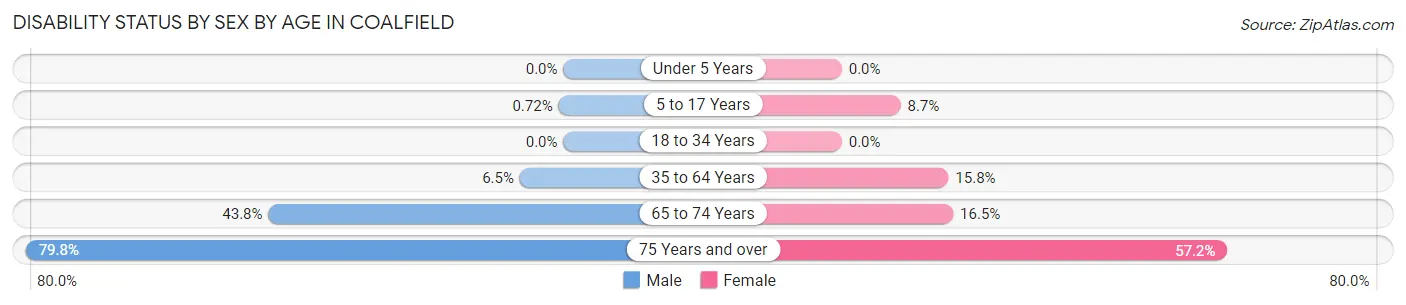
| Age Bracket | Male | Female |
| Under 5 Years | 0 (0.0%) | 0 (0.0%) |
| 5 to 17 Years | 3 (0.7%) | 28 (8.7%) |
| 18 to 34 Years | 0 (0.0%) | 0 (0.0%) |
| 35 to 64 Years | 28 (6.5%) | 82 (15.8%) |
| 65 to 74 Years | 60 (43.8%) | 21 (16.5%) |
| 75 Years and over | 95 (79.8%) | 83 (57.2%) |
Disability Class by Sex by Age in Coalfield
Disability Class: Hearing Difficulty
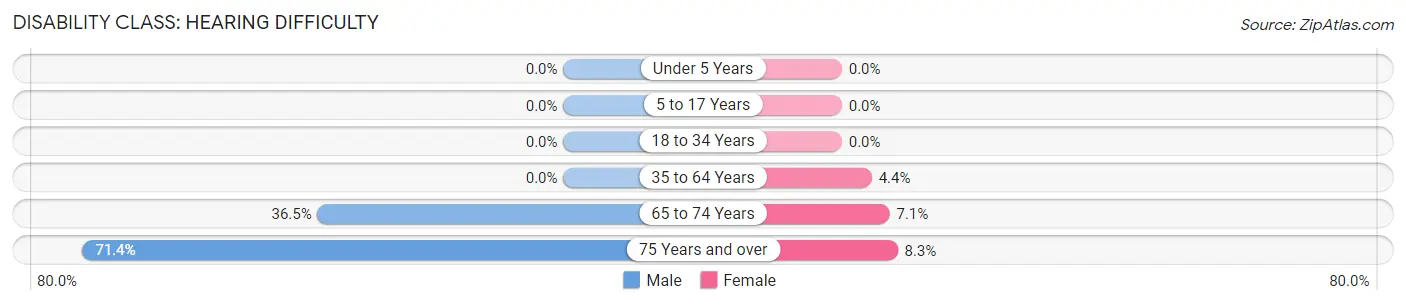
| Age Bracket | Male | Female |
| Under 5 Years | 0 (0.0%) | 0 (0.0%) |
| 5 to 17 Years | 0 (0.0%) | 0 (0.0%) |
| 18 to 34 Years | 0 (0.0%) | 0 (0.0%) |
| 35 to 64 Years | 0 (0.0%) | 23 (4.4%) |
| 65 to 74 Years | 50 (36.5%) | 9 (7.1%) |
| 75 Years and over | 85 (71.4%) | 12 (8.3%) |
Disability Class: Vision Difficulty
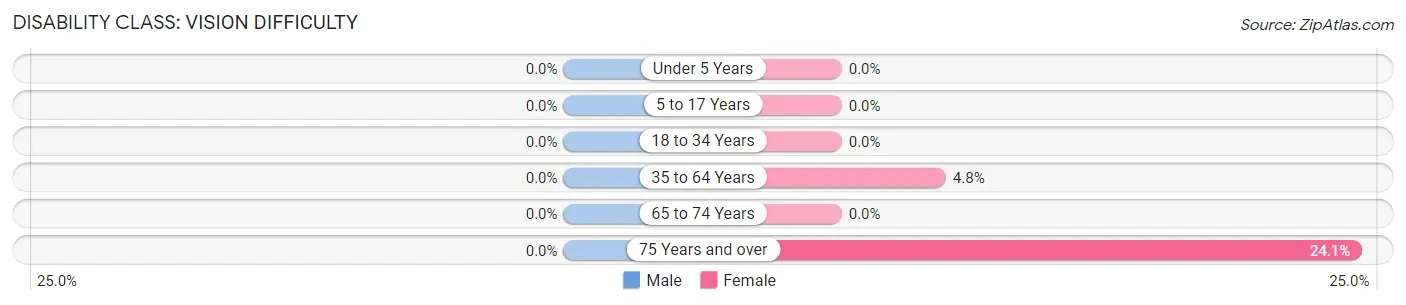
| Age Bracket | Male | Female |
| Under 5 Years | 0 (0.0%) | 0 (0.0%) |
| 5 to 17 Years | 0 (0.0%) | 0 (0.0%) |
| 18 to 34 Years | 0 (0.0%) | 0 (0.0%) |
| 35 to 64 Years | 0 (0.0%) | 25 (4.8%) |
| 65 to 74 Years | 0 (0.0%) | 0 (0.0%) |
| 75 Years and over | 0 (0.0%) | 35 (24.1%) |
Disability Class: Cognitive Difficulty
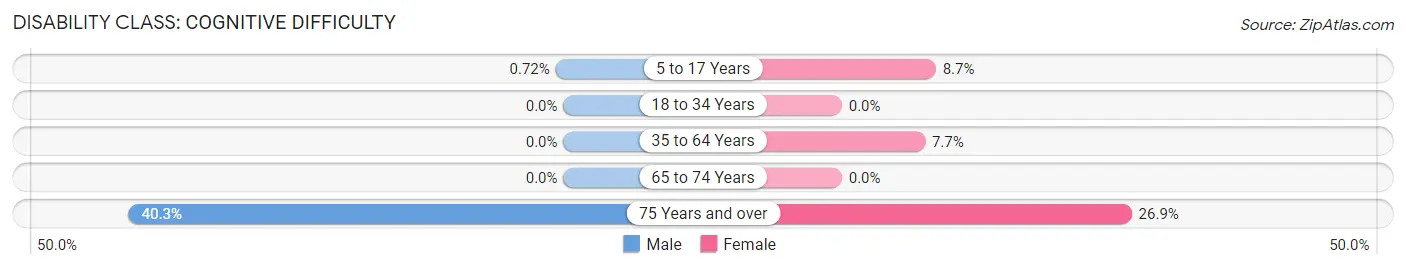
| Age Bracket | Male | Female |
| 5 to 17 Years | 3 (0.7%) | 28 (8.7%) |
| 18 to 34 Years | 0 (0.0%) | 0 (0.0%) |
| 35 to 64 Years | 0 (0.0%) | 40 (7.7%) |
| 65 to 74 Years | 0 (0.0%) | 0 (0.0%) |
| 75 Years and over | 48 (40.3%) | 39 (26.9%) |
Disability Class: Ambulatory Difficulty
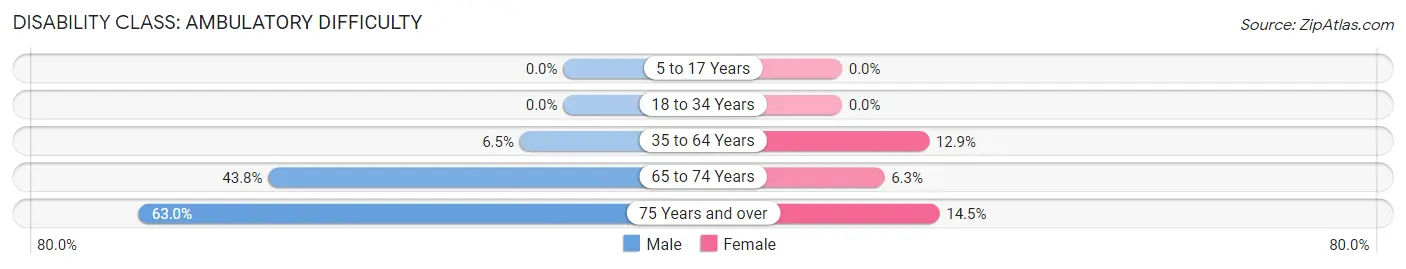
| Age Bracket | Male | Female |
| 5 to 17 Years | 0 (0.0%) | 0 (0.0%) |
| 18 to 34 Years | 0 (0.0%) | 0 (0.0%) |
| 35 to 64 Years | 28 (6.5%) | 67 (12.9%) |
| 65 to 74 Years | 60 (43.8%) | 8 (6.3%) |
| 75 Years and over | 75 (63.0%) | 21 (14.5%) |
Disability Class: Self-Care Difficulty
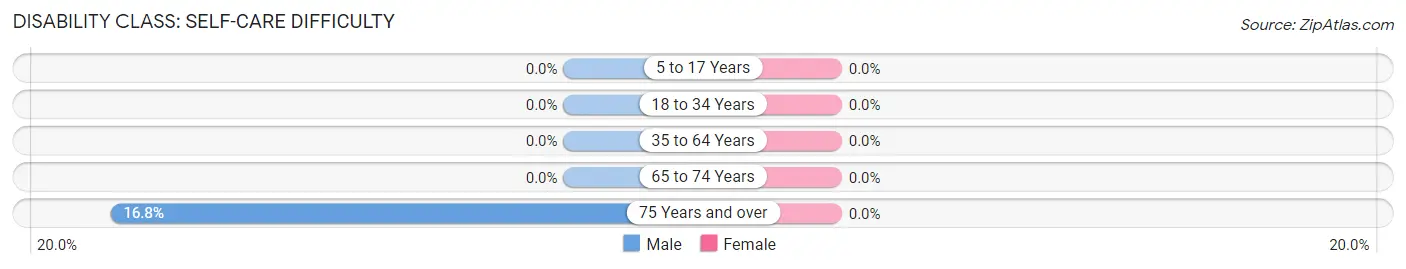
| Age Bracket | Male | Female |
| 5 to 17 Years | 0 (0.0%) | 0 (0.0%) |
| 18 to 34 Years | 0 (0.0%) | 0 (0.0%) |
| 35 to 64 Years | 0 (0.0%) | 0 (0.0%) |
| 65 to 74 Years | 0 (0.0%) | 0 (0.0%) |
| 75 Years and over | 20 (16.8%) | 0 (0.0%) |
Technology Access in Coalfield
Computing Device Access in Coalfield
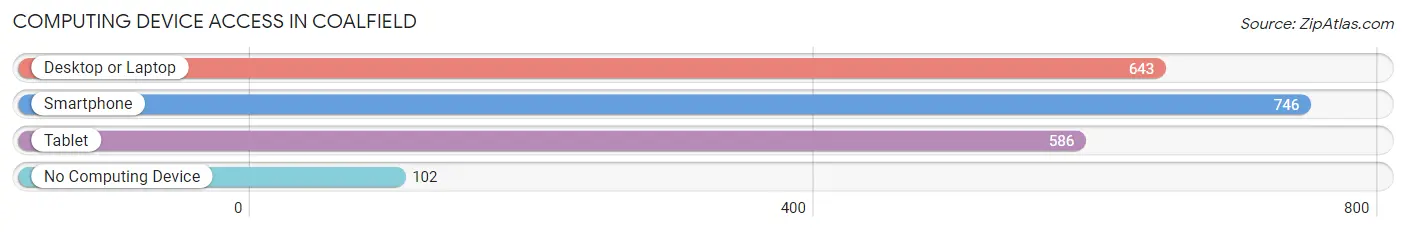
| Device Type | # Households | % Households |
| Desktop or Laptop | 643 | 70.3% |
| Smartphone | 746 | 81.5% |
| Tablet | 586 | 64.0% |
| No Computing Device | 102 | 11.2% |
| Total | 915 | 100.0% |
Internet Access in Coalfield
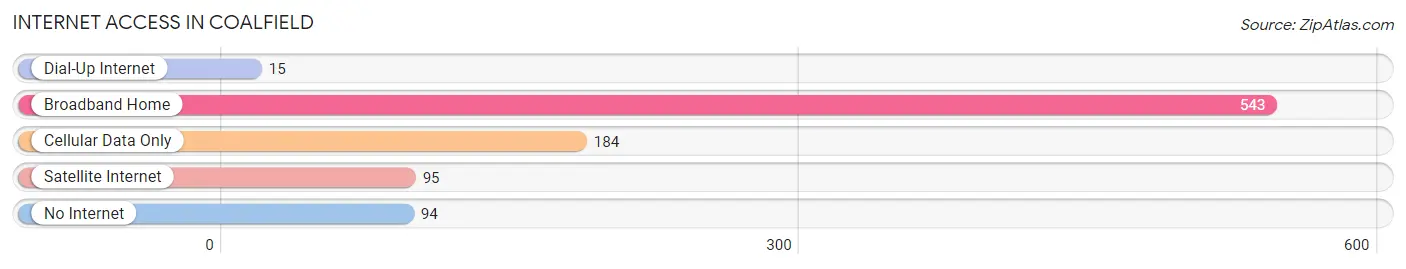
| Internet Type | # Households | % Households |
| Dial-Up Internet | 15 | 1.6% |
| Broadband Home | 543 | 59.3% |
| Cellular Data Only | 184 | 20.1% |
| Satellite Internet | 95 | 10.4% |
| No Internet | 94 | 10.3% |
| Total | 915 | 100.0% |
Coalfield Summary
Coalfield, Tennessee is a small town located in Morgan County, Tennessee. It is situated in the foothills of the Cumberland Mountains, and is part of the Appalachian region. The town was founded in the late 1800s and has a population of approximately 1,000 people.
Geography
Coalfield is located in the foothills of the Cumberland Mountains, and is part of the Appalachian region. The town is situated in a valley, surrounded by hills and mountains. The town is located at an elevation of 1,000 feet above sea level. The climate in Coalfield is temperate, with mild winters and hot summers. The average annual temperature is around 60 degrees Fahrenheit.
The town is located near the Big South Fork National River and Recreation Area, which is a popular destination for outdoor activities such as hiking, camping, fishing, and whitewater rafting. The town is also close to the Obed Wild and Scenic River, which is a popular destination for kayaking and canoeing.
Economy
Coalfield’s economy is largely based on agriculture and tourism. The town is home to several farms, which produce a variety of crops such as corn, soybeans, and hay. The town is also home to several small businesses, including restaurants, stores, and a few manufacturing companies.
Tourism is an important part of the local economy. The town is home to several attractions, including the Big South Fork National River and Recreation Area, the Obed Wild and Scenic River, and the historic Coalfield Depot. The town also hosts several festivals and events throughout the year, such as the Coalfield Days Festival and the Coalfield Music Festival.
Demographics
As of the 2010 census, the population of Coalfield was 1,000 people. The racial makeup of the town was 97.2% White, 0.7% African American, 0.3% Native American, 0.2% Asian, and 1.6% from other races. The median household income was $30,000, and the median age was 40 years.
Conclusion
Coalfield, Tennessee is a small town located in the foothills of the Cumberland Mountains. The town has a population of approximately 1,000 people and is home to several farms and small businesses. The economy of Coalfield is largely based on agriculture and tourism, and the town is home to several attractions, including the Big South Fork National River and Recreation Area and the Obed Wild and Scenic River. The racial makeup of the town is predominantly White, with a small percentage of African American, Native American, and Asian residents. The median household income is $30,000, and the median age is 40 years.
Common Questions
What is Per Capita Income in Coalfield?
Per Capita income in Coalfield is $25,097.
What is the Median Family Income in Coalfield?
Median Family Income in Coalfield is $85,132.
What is the Median Household income in Coalfield?
Median Household Income in Coalfield is $52,375.
What is Income or Wage Gap in Coalfield?
Income or Wage Gap in Coalfield is 39.4%.
Women in Coalfield earn 60.6 cents for every dollar earned by a man.
What is Inequality or Gini Index in Coalfield?
Inequality or Gini Index in Coalfield is 0.42.
What is the Total Population of Coalfield?
Total Population of Coalfield is 2,905.
What is the Total Male Population of Coalfield?
Total Male Population of Coalfield is 1,479.
What is the Total Female Population of Coalfield?
Total Female Population of Coalfield is 1,426.
What is the Ratio of Males per 100 Females in Coalfield?
There are 103.72 Males per 100 Females in Coalfield.
What is the Ratio of Females per 100 Males in Coalfield?
There are 96.42 Females per 100 Males in Coalfield.
What is the Median Population Age in Coalfield?
Median Population Age in Coalfield is 35.3 Years.
What is the Average Family Size in Coalfield
Average Family Size in Coalfield is 3.7 People.
What is the Average Household Size in Coalfield
Average Household Size in Coalfield is 3.2 People.
How Large is the Labor Force in Coalfield?
There are 1,211 People in the Labor Forcein in Coalfield.
What is the Percentage of People in the Labor Force in Coalfield?
59.2% of People are in the Labor Force in Coalfield.
What is the Unemployment Rate in Coalfield?
Unemployment Rate in Coalfield is 4.0%.