Hunter, TN Map & Demographics
Hunter Map
Hunter Overview
$27,461
PER CAPITA INCOME
$63,542
AVG FAMILY INCOME
$40,801
AVG HOUSEHOLD INCOME
5.2%
WAGE / INCOME GAP [ % ]
94.8¢/ $1
WAGE / INCOME GAP [ $ ]
0.41
INEQUALITY / GINI INDEX
2,121
TOTAL POPULATION
933
MALE POPULATION
1,188
FEMALE POPULATION
78.54
MALES / 100 FEMALES
127.33
FEMALES / 100 MALES
39.8
MEDIAN AGE
2.8
AVG FAMILY SIZE
2.3
AVG HOUSEHOLD SIZE
1,069
LABOR FORCE [ PEOPLE ]
62.2%
PERCENT IN LABOR FORCE
0.8%
UNEMPLOYMENT RATE
Income in Hunter
Income Overview in Hunter
Per Capita Income in Hunter is $27,461, while median incomes of families and households are $63,542 and $40,801 respectively.
| Characteristic | Number | Measure |
| Per Capita Income | 2,121 | $27,461 |
| Median Family Income | 613 | $63,542 |
| Mean Family Income | 613 | $78,274 |
| Median Household Income | 929 | $40,801 |
| Mean Household Income | 929 | $60,672 |
| Income Deficit | 613 | $0 |
| Wage / Income Gap (%) | 2,121 | 5.16% |
| Wage / Income Gap ($) | 2,121 | 94.84¢ per $1 |
| Gini / Inequality Index | 2,121 | 0.41 |
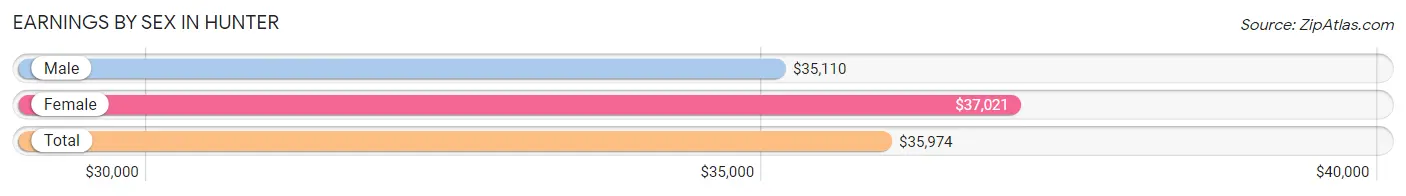
Earnings by Sex in Hunter
Average Earnings in Hunter are $35,974, $35,110 for men and $37,021 for women, a difference of 5.2%.
| Sex | Number | Average Earnings |
| Male | 511 (47.9%) | $35,110 |
| Female | 556 (52.1%) | $37,021 |
| Total | 1,067 (100.0%) | $35,974 |
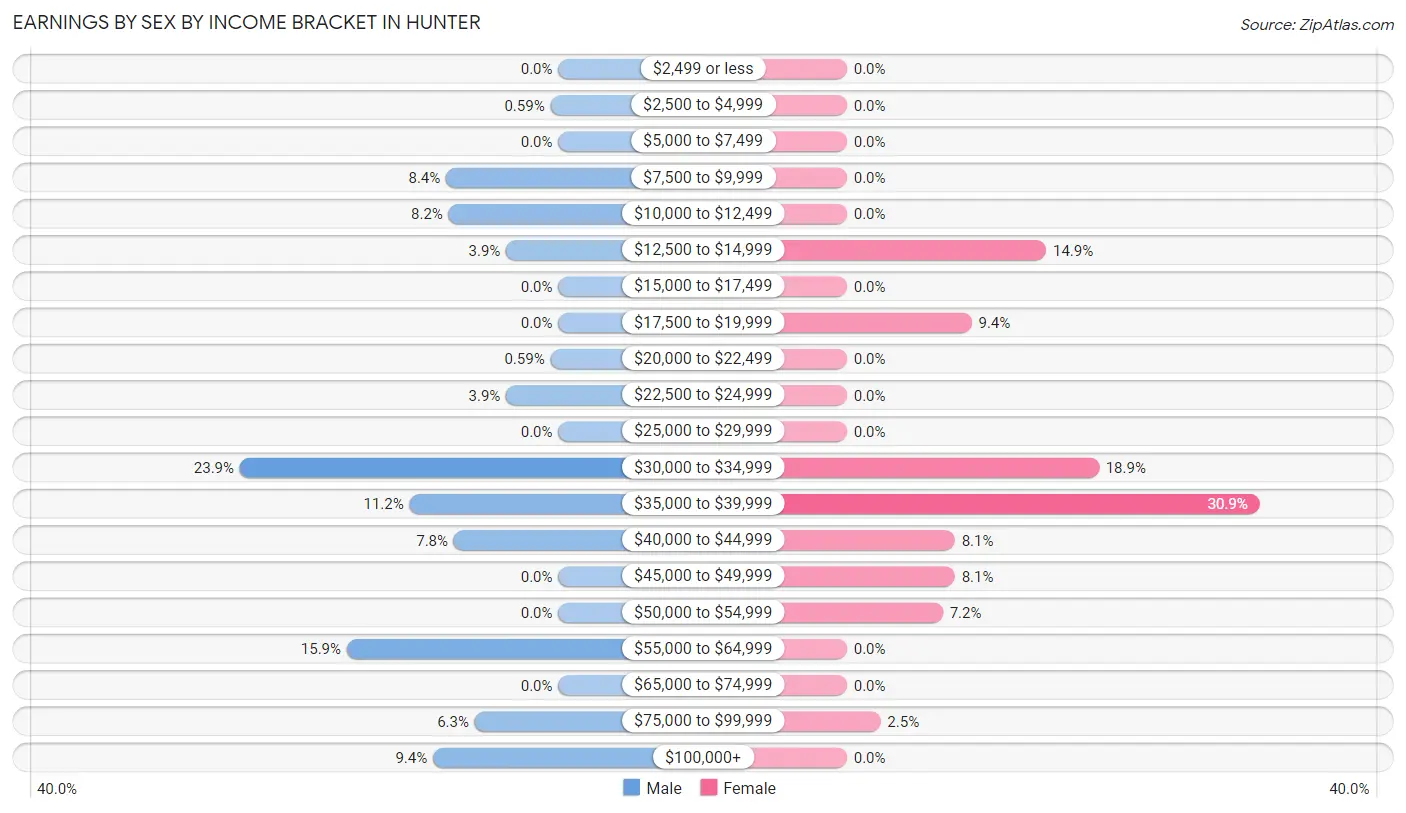
Earnings by Sex by Income Bracket in Hunter
The most common earnings brackets in Hunter are $30,000 to $34,999 for men (122 | 23.9%) and $35,000 to $39,999 for women (172 | 30.9%).
| Income | Male | Female |
| $2,499 or less | 0 (0.0%) | 0 (0.0%) |
| $2,500 to $4,999 | 3 (0.6%) | 0 (0.0%) |
| $5,000 to $7,499 | 0 (0.0%) | 0 (0.0%) |
| $7,500 to $9,999 | 43 (8.4%) | 0 (0.0%) |
| $10,000 to $12,499 | 42 (8.2%) | 0 (0.0%) |
| $12,500 to $14,999 | 20 (3.9%) | 83 (14.9%) |
| $15,000 to $17,499 | 0 (0.0%) | 0 (0.0%) |
| $17,500 to $19,999 | 0 (0.0%) | 52 (9.3%) |
| $20,000 to $22,499 | 3 (0.6%) | 0 (0.0%) |
| $22,500 to $24,999 | 20 (3.9%) | 0 (0.0%) |
| $25,000 to $29,999 | 0 (0.0%) | 0 (0.0%) |
| $30,000 to $34,999 | 122 (23.9%) | 105 (18.9%) |
| $35,000 to $39,999 | 57 (11.2%) | 172 (30.9%) |
| $40,000 to $44,999 | 40 (7.8%) | 45 (8.1%) |
| $45,000 to $49,999 | 0 (0.0%) | 45 (8.1%) |
| $50,000 to $54,999 | 0 (0.0%) | 40 (7.2%) |
| $55,000 to $64,999 | 81 (15.9%) | 0 (0.0%) |
| $65,000 to $74,999 | 0 (0.0%) | 0 (0.0%) |
| $75,000 to $99,999 | 32 (6.3%) | 14 (2.5%) |
| $100,000+ | 48 (9.4%) | 0 (0.0%) |
| Total | 511 (100.0%) | 556 (100.0%) |
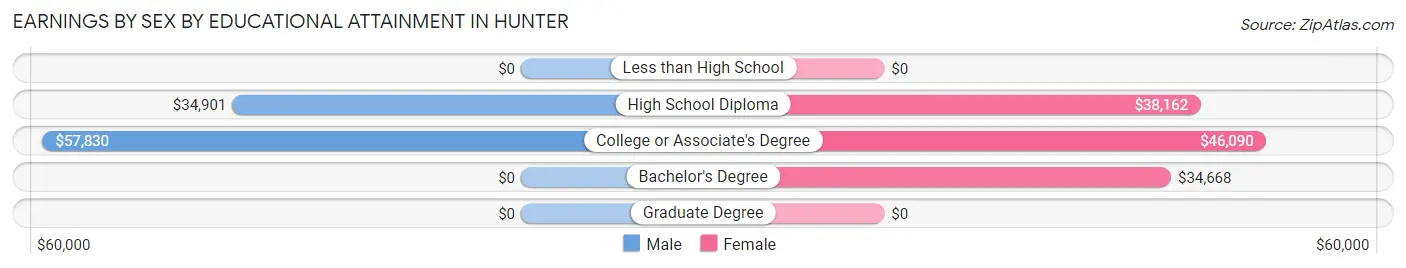
Earnings by Sex by Educational Attainment in Hunter
Average earnings in Hunter are $36,118 for men and $38,210 for women, a difference of 5.5%. Men with an educational attainment of college or associate's degree enjoy the highest average annual earnings of $57,830, while those with high school diploma education earn the least with $34,901. Women with an educational attainment of college or associate's degree earn the most with the average annual earnings of $46,090, while those with bachelor's degree education have the smallest earnings of $34,668.
| Educational Attainment | Male Income | Female Income |
| Less than High School | - | - |
| High School Diploma | $34,901 | $38,162 |
| College or Associate's Degree | $57,830 | $46,090 |
| Bachelor's Degree | - | - |
| Graduate Degree | - | - |
| Total | $36,118 | $38,210 |
Family Income in Hunter
Family Income Brackets in Hunter
According to the Hunter family income data, there are 150 families falling into the $35,000 to $49,999 income range, which is the most common income bracket and makes up 24.5% of all families.
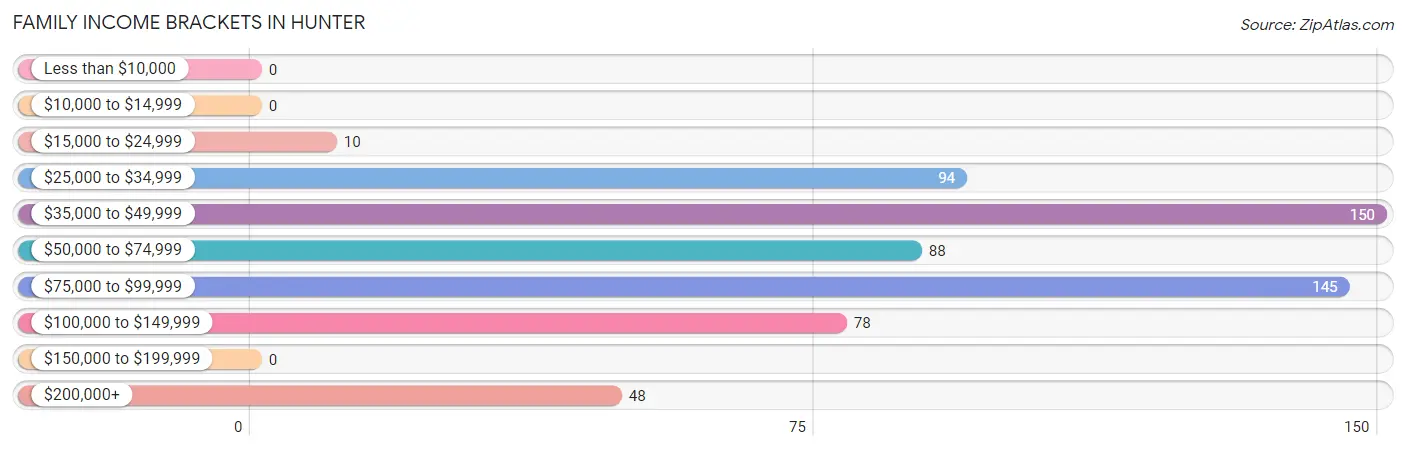
| Income Bracket | # Families | % Families |
| Less than $10,000 | 0 | 0.0% |
| $10,000 to $14,999 | 0 | 0.0% |
| $15,000 to $24,999 | 10 | 1.6% |
| $25,000 to $34,999 | 94 | 15.3% |
| $35,000 to $49,999 | 150 | 24.5% |
| $50,000 to $74,999 | 88 | 14.4% |
| $75,000 to $99,999 | 145 | 23.7% |
| $100,000 to $149,999 | 78 | 12.7% |
| $150,000 to $199,999 | 0 | 0.0% |
| $200,000+ | 48 | 7.8% |
Family Income by Famaliy Size in Hunter
4-person families (161 | 26.3%) account for the highest median family income in Hunter with $98,281 per family, while 2-person families (337 | 55.0%) have the highest median income of $27,847 per family member.
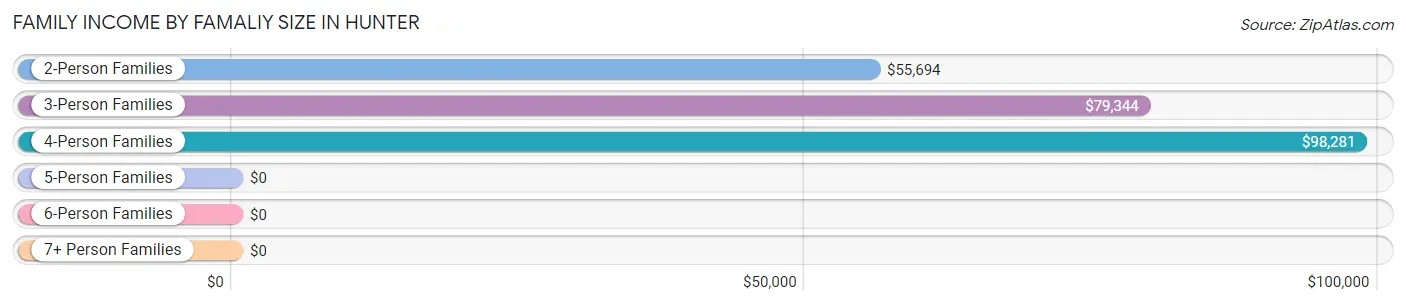
| Income Bracket | # Families | Median Income |
| 2-Person Families | 337 (55.0%) | $55,694 |
| 3-Person Families | 105 (17.1%) | $79,344 |
| 4-Person Families | 161 (26.3%) | $98,281 |
| 5-Person Families | 10 (1.6%) | $0 |
| 6-Person Families | 0 (0.0%) | $0 |
| 7+ Person Families | 0 (0.0%) | $0 |
| Total | 613 (100.0%) | $63,542 |
Family Income by Number of Earners in Hunter
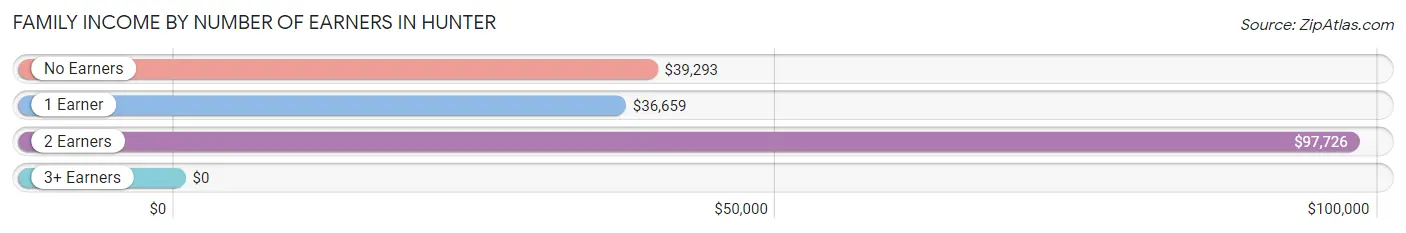
| Number of Earners | # Families | Median Income |
| No Earners | 65 (10.6%) | $39,293 |
| 1 Earner | 245 (40.0%) | $36,659 |
| 2 Earners | 269 (43.9%) | $97,726 |
| 3+ Earners | 34 (5.6%) | $0 |
| Total | 613 (100.0%) | $63,542 |
Household Income in Hunter
Household Income Brackets in Hunter
With 212 households falling in the category, the $15,000 to $24,999 income range is the most frequent in Hunter, accounting for 22.8% of all households.
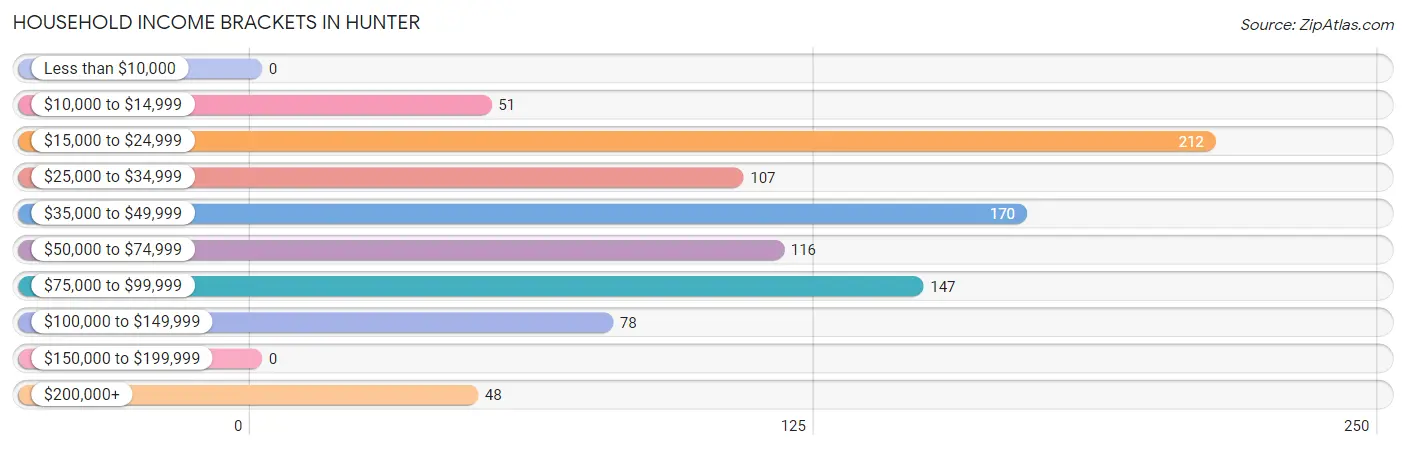
| Income Bracket | # Households | % Households |
| Less than $10,000 | 0 | 0.0% |
| $10,000 to $14,999 | 51 | 5.5% |
| $15,000 to $24,999 | 212 | 22.8% |
| $25,000 to $34,999 | 107 | 11.5% |
| $35,000 to $49,999 | 170 | 18.3% |
| $50,000 to $74,999 | 116 | 12.5% |
| $75,000 to $99,999 | 147 | 15.8% |
| $100,000 to $149,999 | 78 | 8.4% |
| $150,000 to $199,999 | 0 | 0.0% |
| $200,000+ | 48 | 5.2% |
Household Income by Householder Age in Hunter
The median household income in Hunter is $40,801, with the highest median household income of $78,031 found in the 25 to 44 years age bracket for the primary householder. A total of 275 households (29.6%) fall into this category.
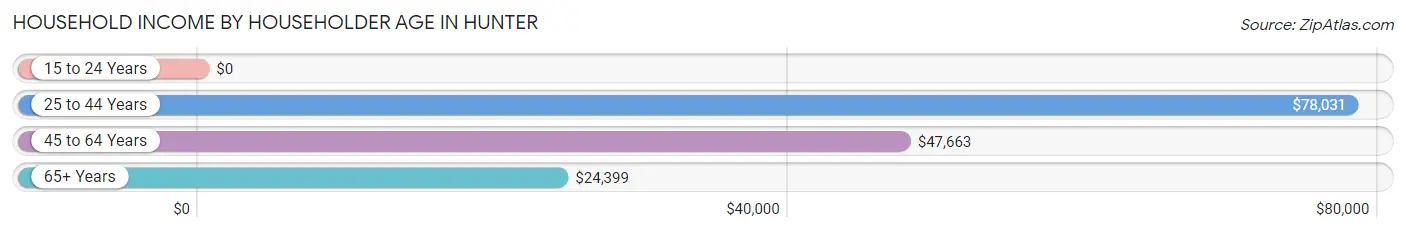
| Income Bracket | # Households | Median Income |
| 15 to 24 Years | 0 (0.0%) | $0 |
| 25 to 44 Years | 275 (29.6%) | $78,031 |
| 45 to 64 Years | 391 (42.1%) | $47,663 |
| 65+ Years | 263 (28.3%) | $24,399 |
| Total | 929 (100.0%) | $40,801 |
Poverty in Hunter
Income Below Poverty by Sex and Age in Hunter
With 8.8% poverty level for males and 5.3% for females among the residents of Hunter, 18 to 24 year old males and 15 year old females are the most vulnerable to poverty, with 43 males (70.5%) and 10 females (100.0%) in their respective age groups living below the poverty level.
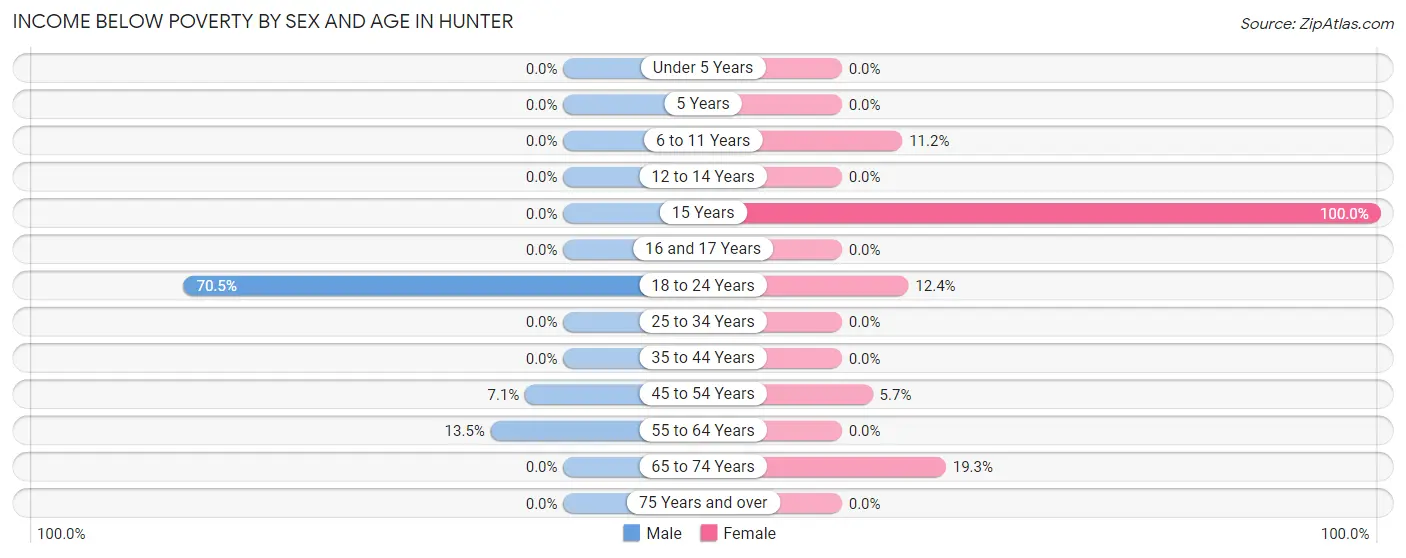
| Age Bracket | Male | Female |
| Under 5 Years | 0 (0.0%) | 0 (0.0%) |
| 5 Years | 0 (0.0%) | 0 (0.0%) |
| 6 to 11 Years | 0 (0.0%) | 11 (11.2%) |
| 12 to 14 Years | 0 (0.0%) | 0 (0.0%) |
| 15 Years | 0 (0.0%) | 10 (100.0%) |
| 16 and 17 Years | 0 (0.0%) | 0 (0.0%) |
| 18 to 24 Years | 43 (70.5%) | 11 (12.4%) |
| 25 to 34 Years | 0 (0.0%) | 0 (0.0%) |
| 35 to 44 Years | 0 (0.0%) | 0 (0.0%) |
| 45 to 54 Years | 10 (7.1%) | 9 (5.7%) |
| 55 to 64 Years | 29 (13.5%) | 0 (0.0%) |
| 65 to 74 Years | 0 (0.0%) | 22 (19.3%) |
| 75 Years and over | 0 (0.0%) | 0 (0.0%) |
| Total | 82 (8.8%) | 63 (5.3%) |
Income Above Poverty by Sex and Age in Hunter
According to the poverty statistics in Hunter, males aged under 5 years and females aged under 5 years are the age groups that are most secure financially, with 100.0% of males and 100.0% of females in these age groups living above the poverty line.
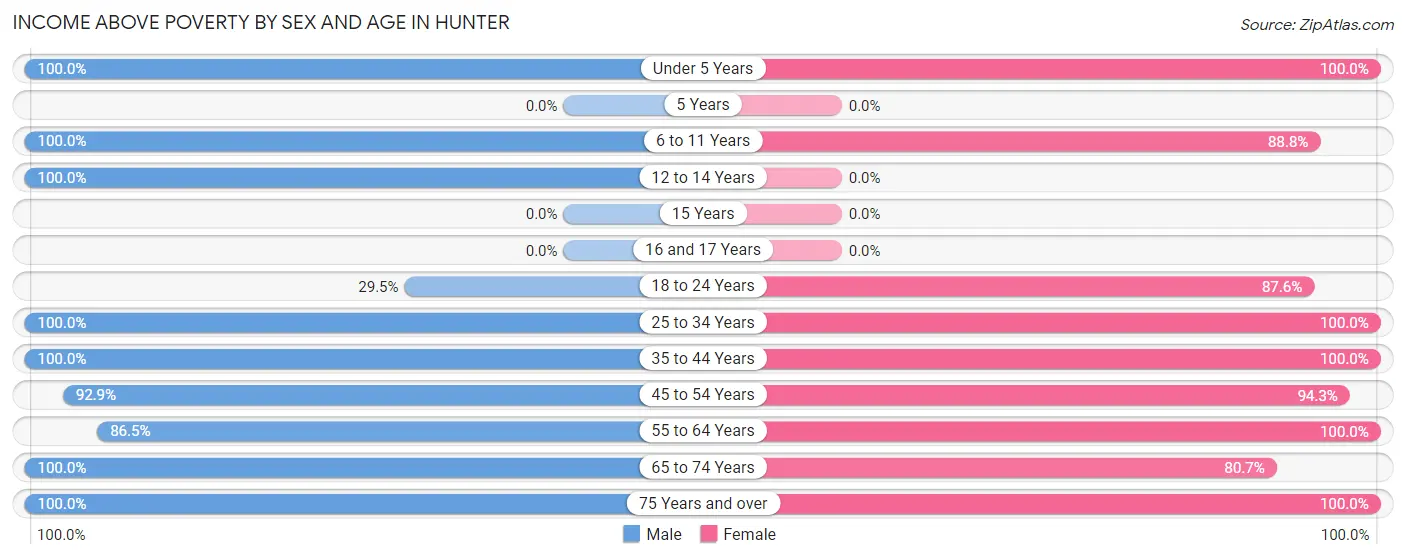
| Age Bracket | Male | Female |
| Under 5 Years | 2 (100.0%) | 102 (100.0%) |
| 5 Years | 0 (0.0%) | 0 (0.0%) |
| 6 to 11 Years | 115 (100.0%) | 87 (88.8%) |
| 12 to 14 Years | 75 (100.0%) | 0 (0.0%) |
| 15 Years | 0 (0.0%) | 0 (0.0%) |
| 16 and 17 Years | 0 (0.0%) | 0 (0.0%) |
| 18 to 24 Years | 18 (29.5%) | 78 (87.6%) |
| 25 to 34 Years | 107 (100.0%) | 247 (100.0%) |
| 35 to 44 Years | 114 (100.0%) | 85 (100.0%) |
| 45 to 54 Years | 131 (92.9%) | 148 (94.3%) |
| 55 to 64 Years | 186 (86.5%) | 144 (100.0%) |
| 65 to 74 Years | 83 (100.0%) | 92 (80.7%) |
| 75 Years and over | 20 (100.0%) | 142 (100.0%) |
| Total | 851 (91.2%) | 1,125 (94.7%) |
Income Below Poverty Among Married-Couple Families in Hunter
The poverty statistics for married-couple families in Hunter show that 2.3% or 10 of the total 434 families live below the poverty line. Families with 1 or 2 children have the highest poverty rate of 5.1%, comprising of 10 families. On the other hand, families with no children have the lowest poverty rate of 0.0%, which includes 0 families.
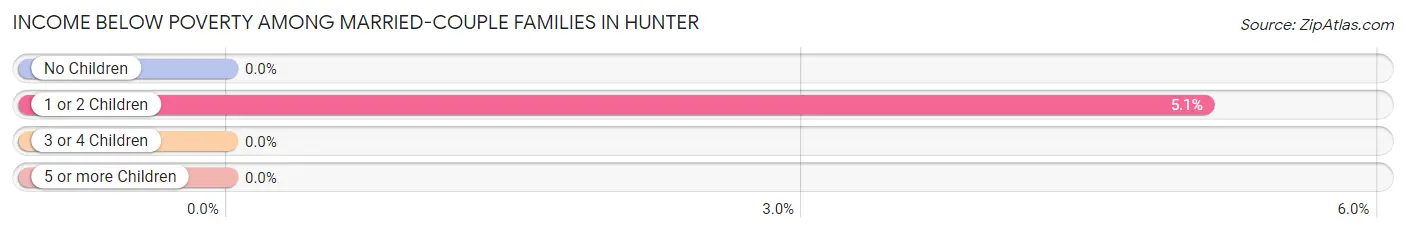
| Children | Above Poverty | Below Poverty |
| No Children | 238 (100.0%) | 0 (0.0%) |
| 1 or 2 Children | 186 (94.9%) | 10 (5.1%) |
| 3 or 4 Children | 0 (0.0%) | 0 (0.0%) |
| 5 or more Children | 0 (0.0%) | 0 (0.0%) |
| Total | 424 (97.7%) | 10 (2.3%) |
Income Below Poverty Among Single-Parent Households in Hunter
| Children | Single Father | Single Mother |
| No Children | 0 (0.0%) | 0 (0.0%) |
| 1 or 2 Children | 0 (0.0%) | 0 (0.0%) |
| 3 or 4 Children | 0 (0.0%) | 0 (0.0%) |
| 5 or more Children | 0 (0.0%) | 0 (0.0%) |
| Total | 0 (0.0%) | 0 (0.0%) |
Income Below Poverty Among Married-Couple vs Single-Parent Households in Hunter
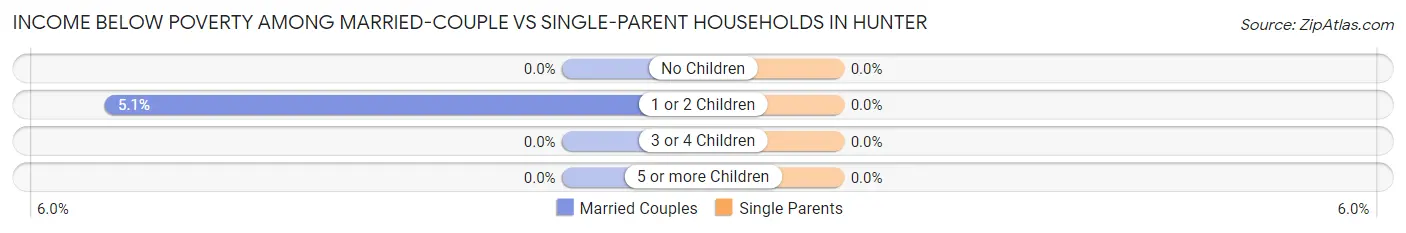
| Children | Married-Couple Families | Single-Parent Households |
| No Children | 0 (0.0%) | 0 (0.0%) |
| 1 or 2 Children | 10 (5.1%) | 0 (0.0%) |
| 3 or 4 Children | 0 (0.0%) | 0 (0.0%) |
| 5 or more Children | 0 (0.0%) | 0 (0.0%) |
| Total | 10 (2.3%) | 0 (0.0%) |
Race in Hunter
The most populous races in Hunter are White / Caucasian (2,066 | 97.4%), Hispanic or Latino (75 | 3.5%), and Two or more Races (55 | 2.6%).
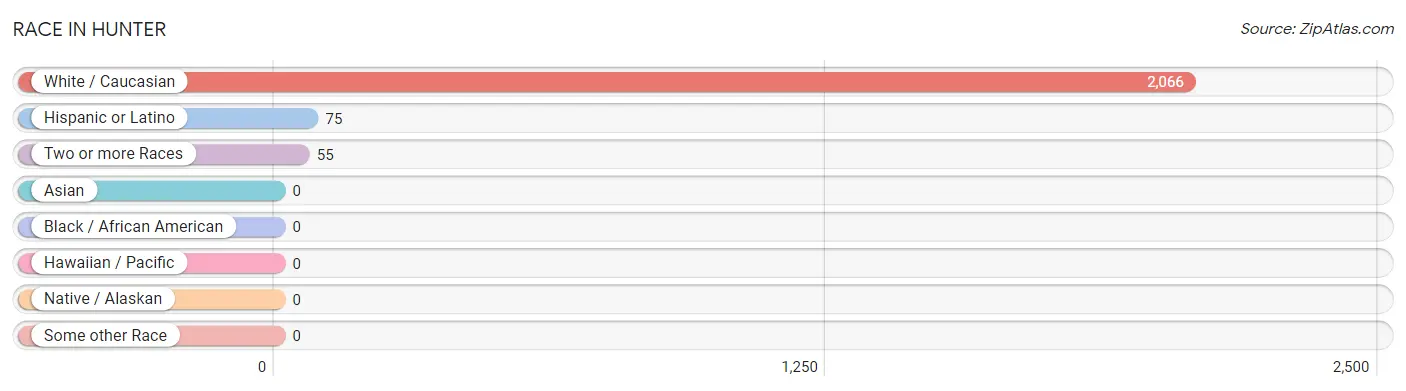
| Race | # Population | % Population |
| Asian | 0 | 0.0% |
| Black / African American | 0 | 0.0% |
| Hawaiian / Pacific | 0 | 0.0% |
| Hispanic or Latino | 75 | 3.5% |
| Native / Alaskan | 0 | 0.0% |
| White / Caucasian | 2,066 | 97.4% |
| Two or more Races | 55 | 2.6% |
| Some other Race | 0 | 0.0% |
| Total | 2,121 | 100.0% |
Ancestry in Hunter
The most populous ancestries reported in Hunter are American (467 | 22.0%), English (432 | 20.4%), German (120 | 5.7%), Norwegian (72 | 3.4%), and Irish (70 | 3.3%), together accounting for 54.7% of all Hunter residents.
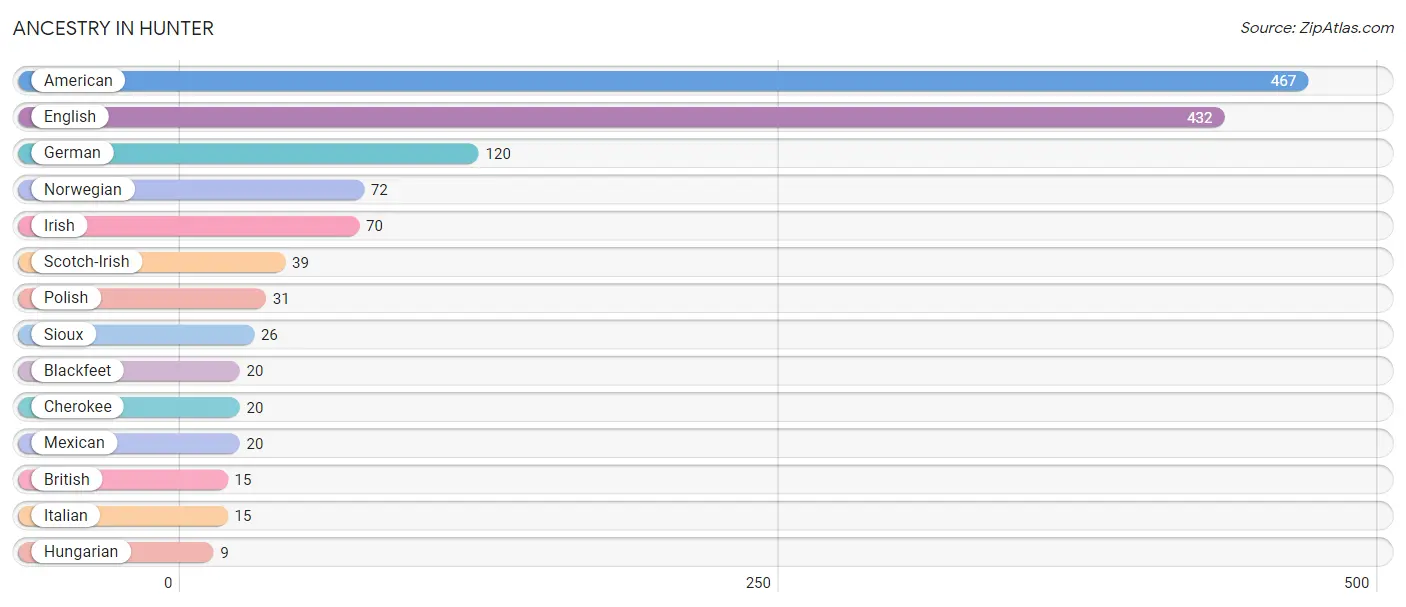
| Ancestry | # Population | % Population |
| American | 467 | 22.0% |
| Blackfeet | 20 | 0.9% |
| British | 15 | 0.7% |
| Cherokee | 20 | 0.9% |
| English | 432 | 20.4% |
| German | 120 | 5.7% |
| Hungarian | 9 | 0.4% |
| Irish | 70 | 3.3% |
| Italian | 15 | 0.7% |
| Mexican | 20 | 0.9% |
| Norwegian | 72 | 3.4% |
| Polish | 31 | 1.5% |
| Scotch-Irish | 39 | 1.8% |
| Sioux | 26 | 1.2% | View All 14 Rows |
Immigrants in Hunter

| Immigration Origin | # Population | % Population | View All 0 Rows |
Sex and Age in Hunter
Sex and Age in Hunter
The most populous age groups in Hunter are 10 to 14 Years (188 | 20.2%) for men and 30 to 34 Years (157 | 13.2%) for women.
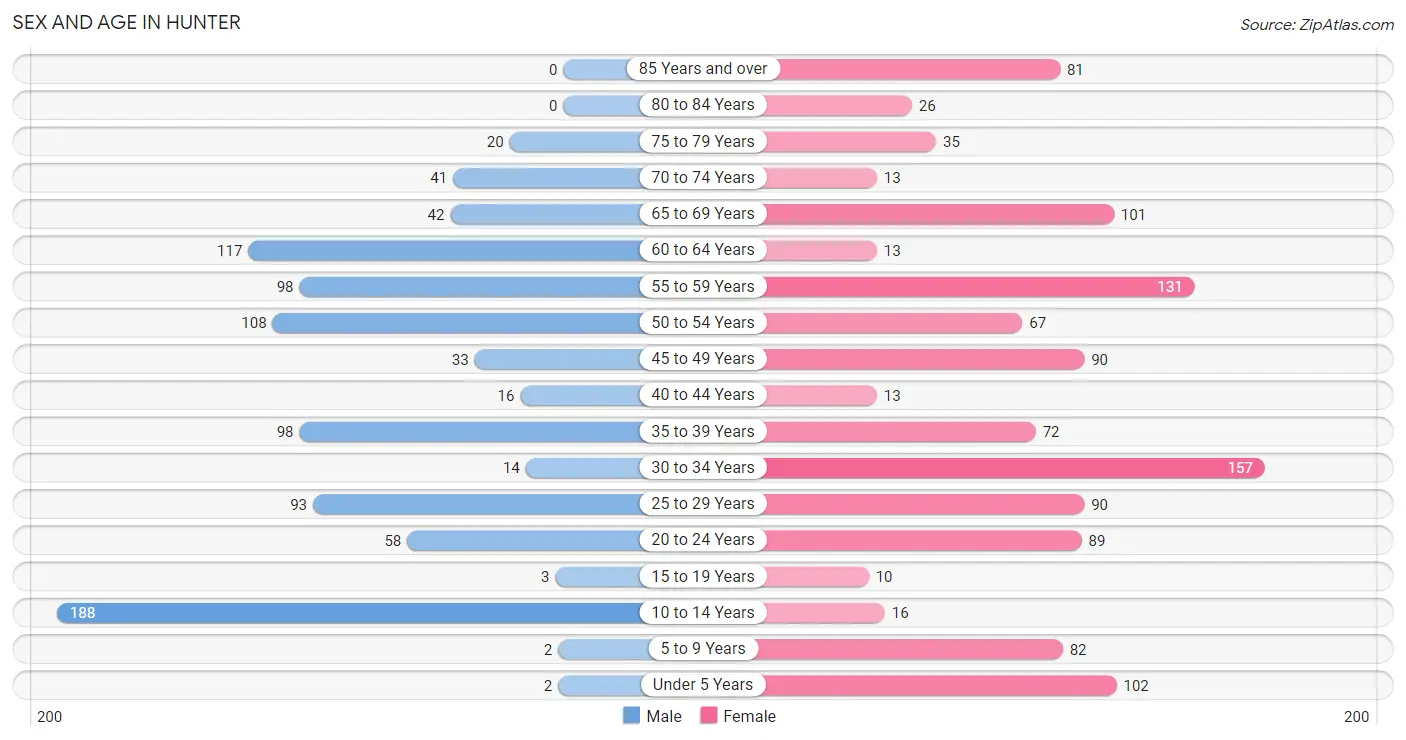
| Age Bracket | Male | Female |
| Under 5 Years | 2 (0.2%) | 102 (8.6%) |
| 5 to 9 Years | 2 (0.2%) | 82 (6.9%) |
| 10 to 14 Years | 188 (20.2%) | 16 (1.3%) |
| 15 to 19 Years | 3 (0.3%) | 10 (0.8%) |
| 20 to 24 Years | 58 (6.2%) | 89 (7.5%) |
| 25 to 29 Years | 93 (10.0%) | 90 (7.6%) |
| 30 to 34 Years | 14 (1.5%) | 157 (13.2%) |
| 35 to 39 Years | 98 (10.5%) | 72 (6.1%) |
| 40 to 44 Years | 16 (1.7%) | 13 (1.1%) |
| 45 to 49 Years | 33 (3.5%) | 90 (7.6%) |
| 50 to 54 Years | 108 (11.6%) | 67 (5.6%) |
| 55 to 59 Years | 98 (10.5%) | 131 (11.0%) |
| 60 to 64 Years | 117 (12.5%) | 13 (1.1%) |
| 65 to 69 Years | 42 (4.5%) | 101 (8.5%) |
| 70 to 74 Years | 41 (4.4%) | 13 (1.1%) |
| 75 to 79 Years | 20 (2.1%) | 35 (2.9%) |
| 80 to 84 Years | 0 (0.0%) | 26 (2.2%) |
| 85 Years and over | 0 (0.0%) | 81 (6.8%) |
| Total | 933 (100.0%) | 1,188 (100.0%) |
Families and Households in Hunter
Median Family Size in Hunter
The median family size in Hunter is 2.83 persons per family, with married-couple families (434 | 70.8%) accounting for the largest median family size of 3.02 persons per family. On the other hand, single male/father families (16 | 2.6%) represent the smallest median family size with 2.25 persons per family.
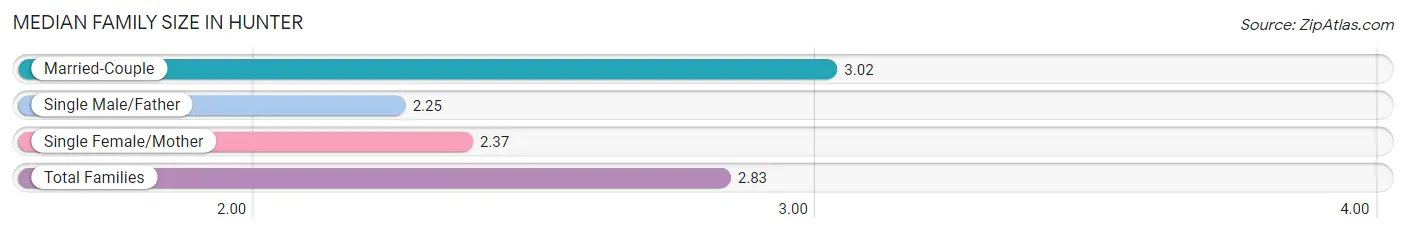
| Family Type | # Families | Family Size |
| Married-Couple | 434 (70.8%) | 3.02 |
| Single Male/Father | 16 (2.6%) | 2.25 |
| Single Female/Mother | 163 (26.6%) | 2.37 |
| Total Families | 613 (100.0%) | 2.83 |
Median Household Size in Hunter
The median household size in Hunter is 2.28 persons per household, with married-couple households (434 | 46.7%) accounting for the largest median household size of 3.02 persons per household. non-family households (316 | 34.0%) represent the smallest median household size with 1.09 persons per household.
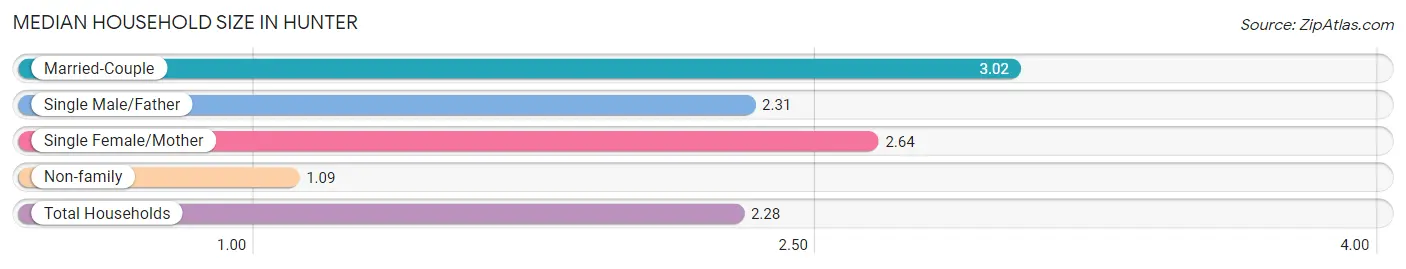
| Household Type | # Households | Household Size |
| Married-Couple | 434 (46.7%) | 3.02 |
| Single Male/Father | 16 (1.7%) | 2.31 |
| Single Female/Mother | 163 (17.5%) | 2.64 |
| Non-family | 316 (34.0%) | 1.09 |
| Total Households | 929 (100.0%) | 2.28 |
Household Size by Marriage Status in Hunter
Out of a total of 929 households in Hunter, 613 (66.0%) are family households, while 316 (34.0%) are nonfamily households. The most numerous type of family households are 2-person households, comprising 295, and the most common type of nonfamily households are 1-person households, comprising 288.
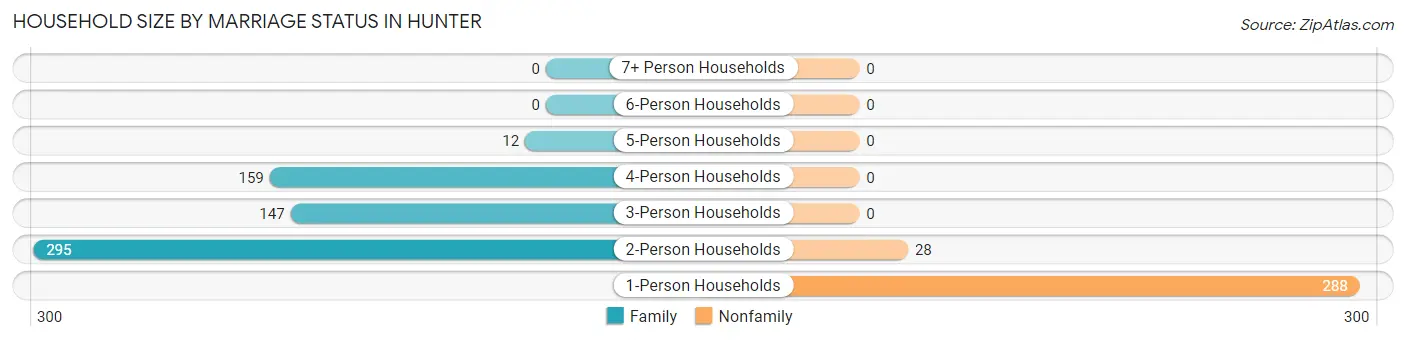
| Household Size | Family Households | Nonfamily Households |
| 1-Person Households | - | 288 (31.0%) |
| 2-Person Households | 295 (31.8%) | 28 (3.0%) |
| 3-Person Households | 147 (15.8%) | 0 (0.0%) |
| 4-Person Households | 159 (17.1%) | 0 (0.0%) |
| 5-Person Households | 12 (1.3%) | 0 (0.0%) |
| 6-Person Households | 0 (0.0%) | 0 (0.0%) |
| 7+ Person Households | 0 (0.0%) | 0 (0.0%) |
| Total | 613 (66.0%) | 316 (34.0%) |
Female Fertility in Hunter
Fertility by Age in Hunter
Average fertility rate in Hunter is 75.0 births per 1,000 women. Women in the age bracket of 20 to 34 years have the highest fertility rate with 119.0 births per 1,000 women. Women in the age bracket of 20 to 34 years acount for 100.0% of all women with births.
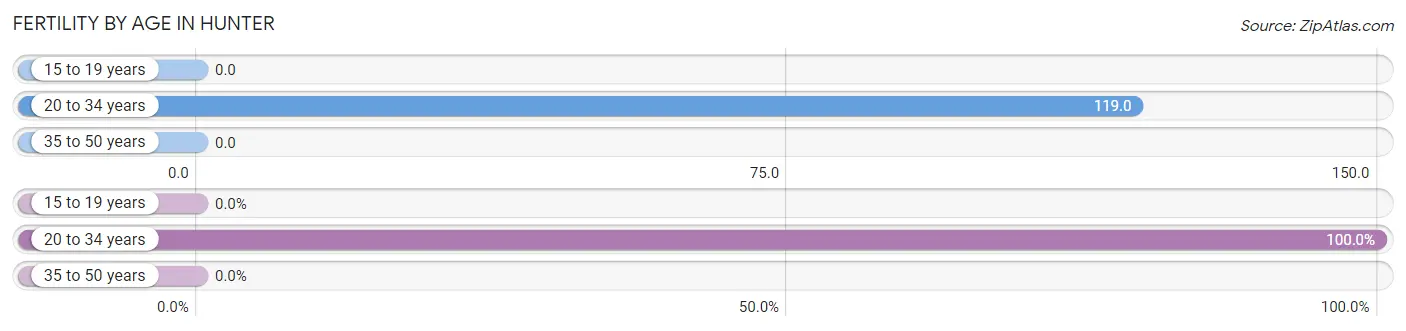
| Age Bracket | Women with Births | Births / 1,000 Women |
| 15 to 19 years | 0 (0.0%) | 0.0 |
| 20 to 34 years | 40 (100.0%) | 119.0 |
| 35 to 50 years | 0 (0.0%) | 0.0 |
| Total | 40 (100.0%) | 75.0 |
Fertility by Age by Marriage Status in Hunter
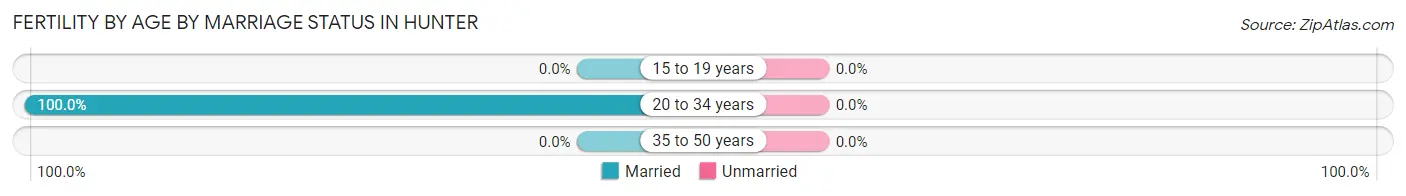
| Age Bracket | Married | Unmarried |
| 15 to 19 years | 0 (0.0%) | 0 (0.0%) |
| 20 to 34 years | 40 (100.0%) | 0 (0.0%) |
| 35 to 50 years | 0 (0.0%) | 0 (0.0%) |
| Total | 40 (100.0%) | 0 (0.0%) |
Fertility by Education in Hunter
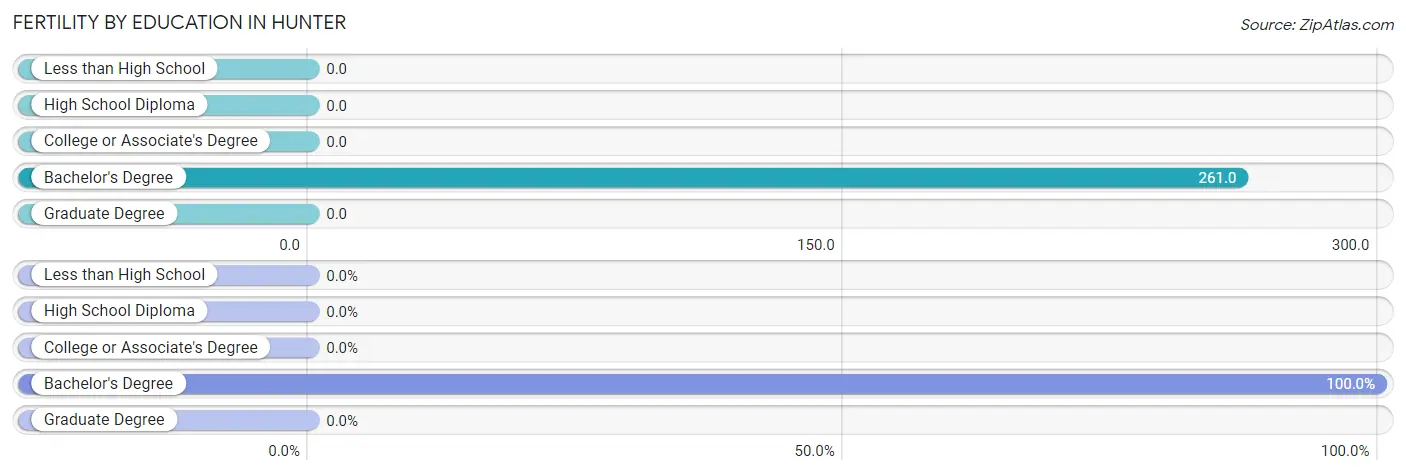
| Educational Attainment | Women with Births | Births / 1,000 Women |
| Less than High School | 0 (0.0%) | 0.0 |
| High School Diploma | 0 (0.0%) | 0.0 |
| College or Associate's Degree | 0 (0.0%) | 0.0 |
| Bachelor's Degree | 40 (100.0%) | 261.0 |
| Graduate Degree | 0 (0.0%) | 0.0 |
| Total | 40 (100.0%) | 75.0 |
Fertility by Education by Marriage Status in Hunter
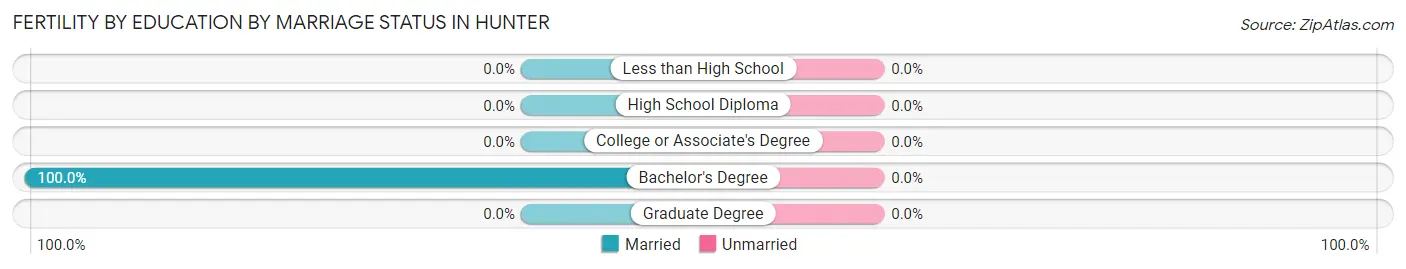
| Educational Attainment | Married | Unmarried |
| Less than High School | 0 (0.0%) | 0 (0.0%) |
| High School Diploma | 0 (0.0%) | 0 (0.0%) |
| College or Associate's Degree | 0 (0.0%) | 0 (0.0%) |
| Bachelor's Degree | 40 (100.0%) | 0 (0.0%) |
| Graduate Degree | 0 (0.0%) | 0 (0.0%) |
| Total | 40 (100.0%) | 0 (0.0%) |
Employment Characteristics in Hunter
Employment by Class of Employer in Hunter
Among the 1,061 employed individuals in Hunter, private company employees (856 | 80.7%), state government employees (73 | 6.9%), and not-for-profit organizations (63 | 5.9%) make up the most common classes of employment.
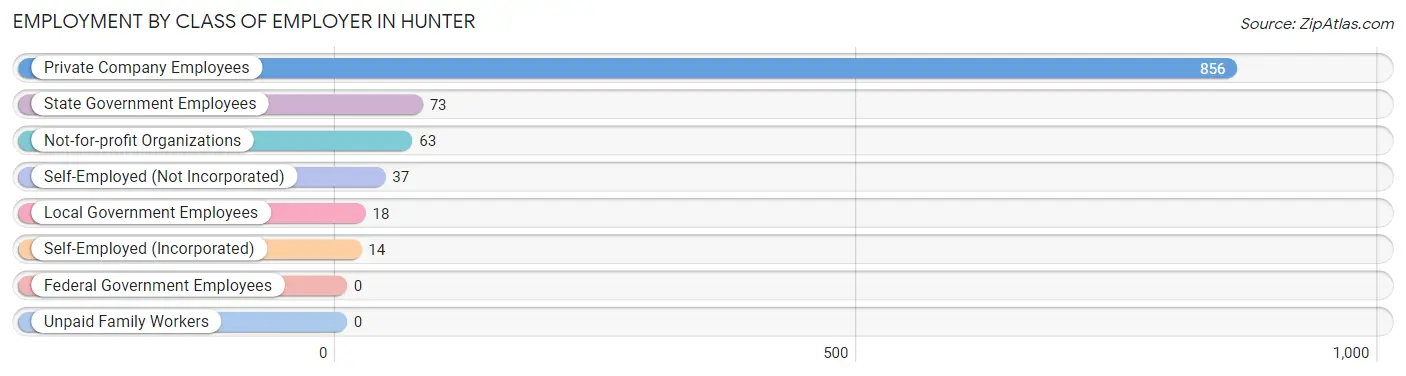
| Employer Class | # Employees | % Employees |
| Private Company Employees | 856 | 80.7% |
| Self-Employed (Incorporated) | 14 | 1.3% |
| Self-Employed (Not Incorporated) | 37 | 3.5% |
| Not-for-profit Organizations | 63 | 5.9% |
| Local Government Employees | 18 | 1.7% |
| State Government Employees | 73 | 6.9% |
| Federal Government Employees | 0 | 0.0% |
| Unpaid Family Workers | 0 | 0.0% |
| Total | 1,061 | 100.0% |
Employment Status by Age in Hunter
According to the labor force statistics for Hunter, out of the total population over 16 years of age (1,719), 62.2% or 1,069 individuals are in the labor force, with 0.8% or 9 of them unemployed. The age group with the highest labor force participation rate is 16 to 19 years, with 100.0% or 3 individuals in the labor force. Within the labor force, the 45 to 54 years age range has the highest percentage of unemployed individuals, with 3.4% or 9 of them being unemployed.
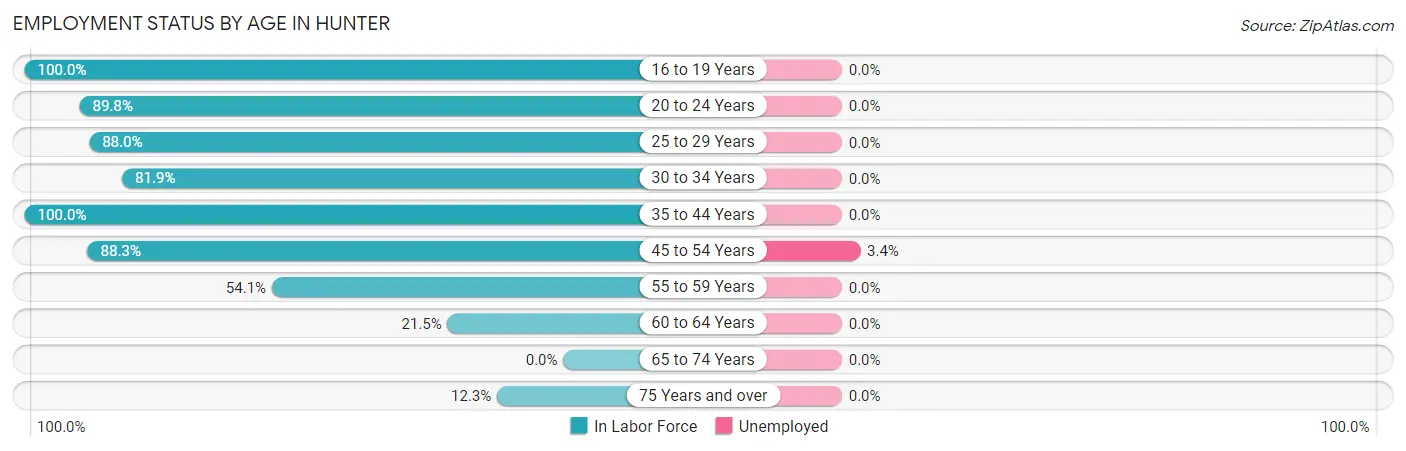
| Age Bracket | In Labor Force | Unemployed |
| 16 to 19 Years | 3 (100.0%) | 0 (0.0%) |
| 20 to 24 Years | 132 (89.8%) | 0 (0.0%) |
| 25 to 29 Years | 161 (88.0%) | 0 (0.0%) |
| 30 to 34 Years | 140 (81.9%) | 0 (0.0%) |
| 35 to 44 Years | 199 (100.0%) | 0 (0.0%) |
| 45 to 54 Years | 263 (88.3%) | 9 (3.4%) |
| 55 to 59 Years | 124 (54.1%) | 0 (0.0%) |
| 60 to 64 Years | 28 (21.5%) | 0 (0.0%) |
| 65 to 74 Years | 0 (0.0%) | 0 (0.0%) |
| 75 Years and over | 20 (12.3%) | 0 (0.0%) |
| Total | 1,069 (62.2%) | 9 (0.8%) |
Employment Status by Educational Attainment in Hunter
According to labor force statistics for Hunter, 75.6% of individuals (915) out of the total population between 25 and 64 years of age (1,210) are in the labor force, with 1.0% or 9 of them being unemployed. The group with the highest labor force participation rate are those with the educational attainment of less than high school, with 100.0% or 24 individuals in the labor force. Within the labor force, individuals with college / associate degree education have the highest percentage of unemployment, with 2.3% or 9 of them being unemployed.
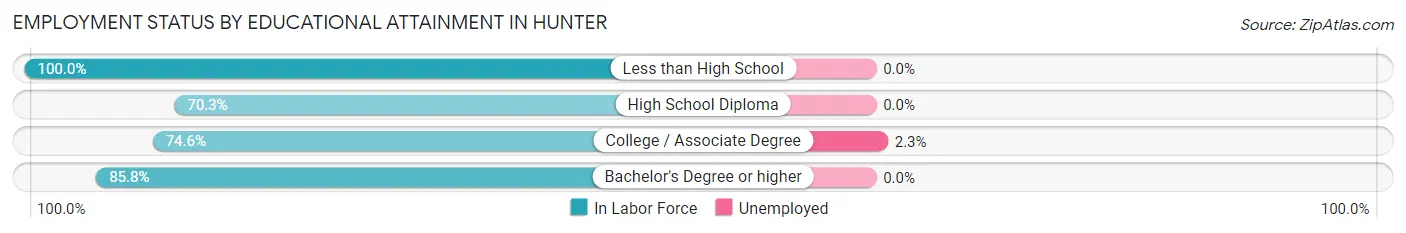
| Educational Attainment | In Labor Force | Unemployed |
| Less than High School | 24 (100.0%) | 0 (0.0%) |
| High School Diploma | 310 (70.3%) | 0 (0.0%) |
| College / Associate Degree | 388 (74.6%) | 12 (2.3%) |
| Bachelor's Degree or higher | 193 (85.8%) | 0 (0.0%) |
| Total | 915 (75.6%) | 12 (1.0%) |
Employment Occupations by Sex in Hunter
Management, Business, Science and Arts Occupations
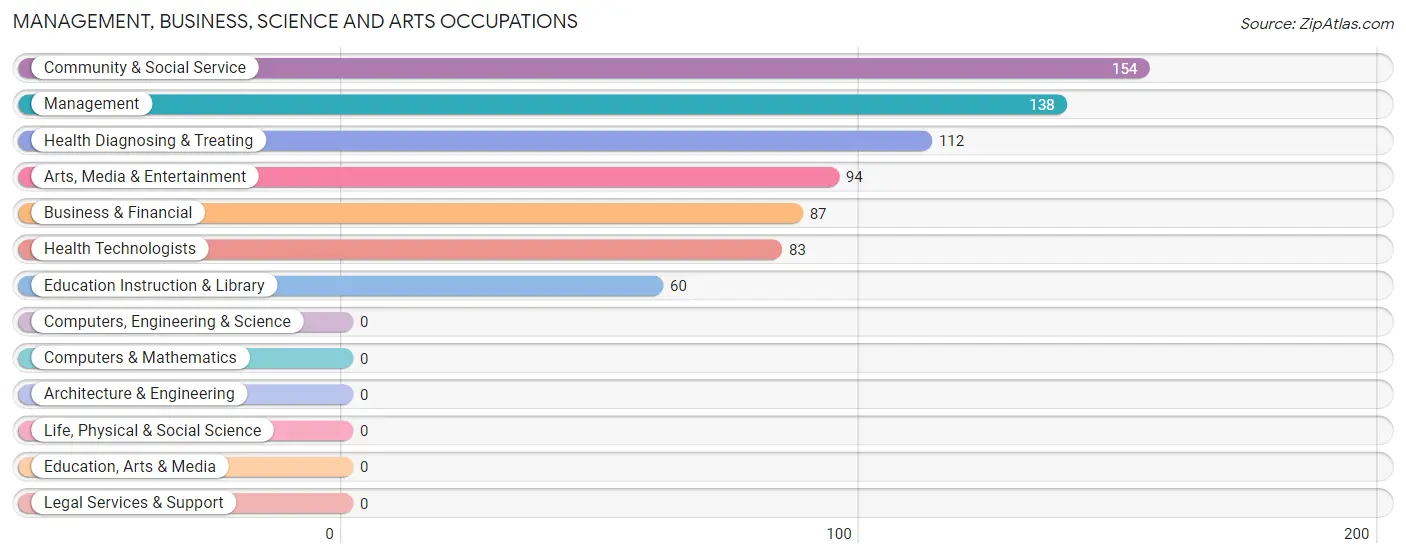
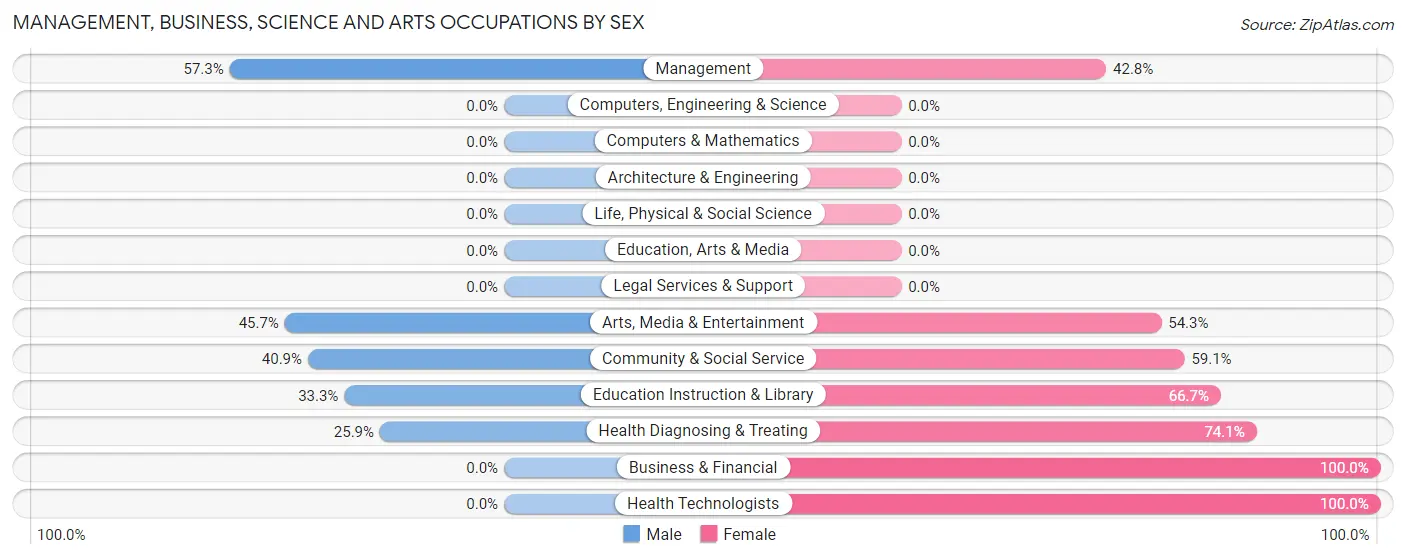
The most common Management, Business, Science and Arts occupations in Hunter are Community & Social Service (154 | 14.5%), Management (138 | 13.0%), Health Diagnosing & Treating (112 | 10.6%), Arts, Media & Entertainment (94 | 8.9%), and Business & Financial (87 | 8.2%).
Management, Business, Science and Arts Occupations by Sex
Within the Management, Business, Science and Arts occupations in Hunter, the most male-oriented occupations are Management (57.3%), Arts, Media & Entertainment (45.7%), and Community & Social Service (40.9%), while the most female-oriented occupations are Business & Financial (100.0%), Health Technologists (100.0%), and Health Diagnosing & Treating (74.1%).
| Occupation | Male | Female |
| Management | 79 (57.3%) | 59 (42.7%) |
| Business & Financial | 0 (0.0%) | 87 (100.0%) |
| Computers, Engineering & Science | 0 (0.0%) | 0 (0.0%) |
| Computers & Mathematics | 0 (0.0%) | 0 (0.0%) |
| Architecture & Engineering | 0 (0.0%) | 0 (0.0%) |
| Life, Physical & Social Science | 0 (0.0%) | 0 (0.0%) |
| Community & Social Service | 63 (40.9%) | 91 (59.1%) |
| Education, Arts & Media | 0 (0.0%) | 0 (0.0%) |
| Legal Services & Support | 0 (0.0%) | 0 (0.0%) |
| Education Instruction & Library | 20 (33.3%) | 40 (66.7%) |
| Arts, Media & Entertainment | 43 (45.7%) | 51 (54.3%) |
| Health Diagnosing & Treating | 29 (25.9%) | 83 (74.1%) |
| Health Technologists | 0 (0.0%) | 83 (100.0%) |
| Total (Category) | 171 (34.8%) | 320 (65.2%) |
| Total (Overall) | 505 (47.6%) | 556 (52.4%) |
Services Occupations
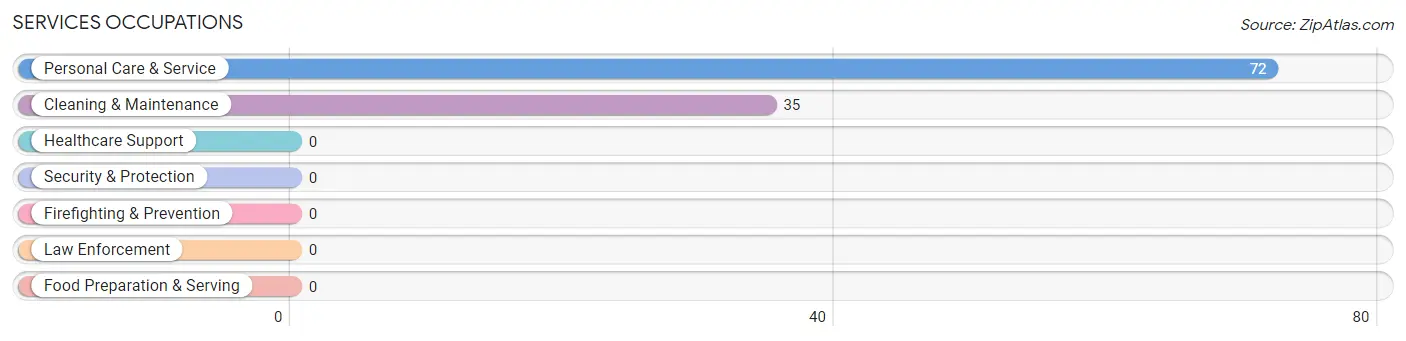
The most common Services occupations in Hunter are Personal Care & Service (72 | 6.8%), and Cleaning & Maintenance (35 | 3.3%).
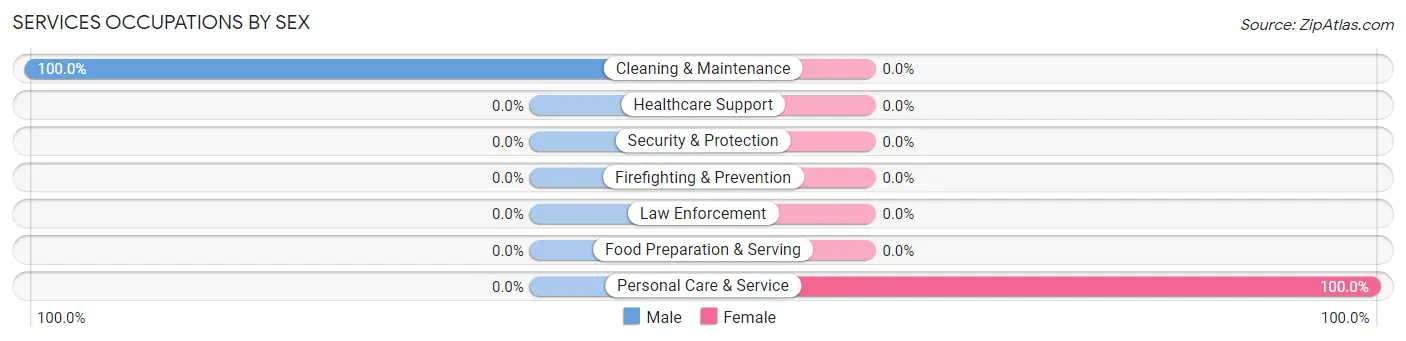
Services Occupations by Sex
| Occupation | Male | Female |
| Healthcare Support | 0 (0.0%) | 0 (0.0%) |
| Security & Protection | 0 (0.0%) | 0 (0.0%) |
| Firefighting & Prevention | 0 (0.0%) | 0 (0.0%) |
| Law Enforcement | 0 (0.0%) | 0 (0.0%) |
| Food Preparation & Serving | 0 (0.0%) | 0 (0.0%) |
| Cleaning & Maintenance | 35 (100.0%) | 0 (0.0%) |
| Personal Care & Service | 0 (0.0%) | 72 (100.0%) |
| Total (Category) | 35 (32.7%) | 72 (67.3%) |
| Total (Overall) | 505 (47.6%) | 556 (52.4%) |
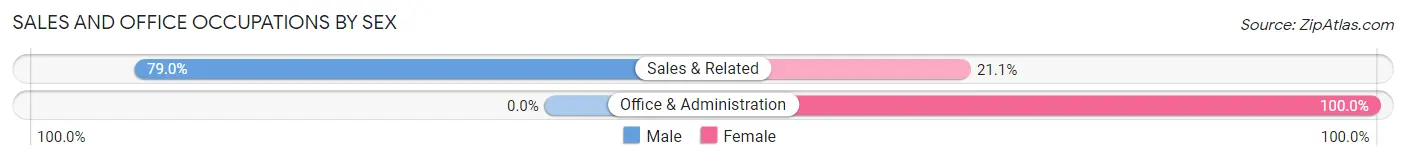
Sales and Office Occupations
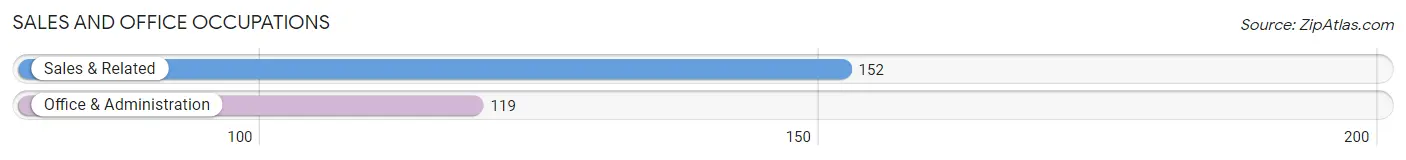
The most common Sales and Office occupations in Hunter are Sales & Related (152 | 14.3%), and Office & Administration (119 | 11.2%).
Sales and Office Occupations by Sex
| Occupation | Male | Female |
| Sales & Related | 120 (78.9%) | 32 (21.0%) |
| Office & Administration | 0 (0.0%) | 119 (100.0%) |
| Total (Category) | 120 (44.3%) | 151 (55.7%) |
| Total (Overall) | 505 (47.6%) | 556 (52.4%) |
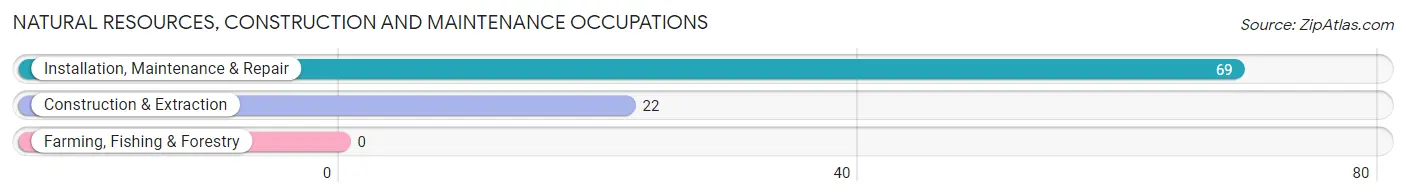
Natural Resources, Construction and Maintenance Occupations
The most common Natural Resources, Construction and Maintenance occupations in Hunter are Installation, Maintenance & Repair (69 | 6.5%), and Construction & Extraction (22 | 2.1%).
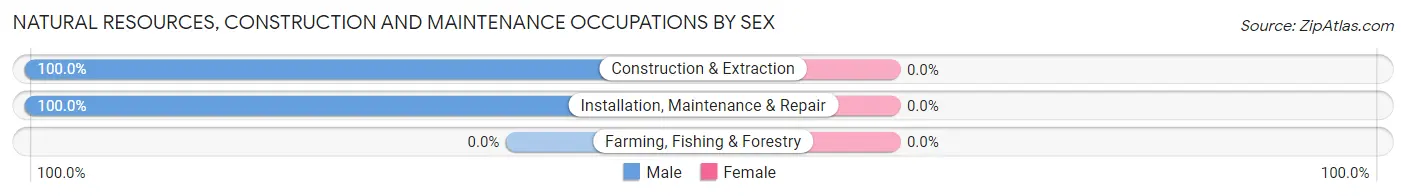
Natural Resources, Construction and Maintenance Occupations by Sex
| Occupation | Male | Female |
| Farming, Fishing & Forestry | 0 (0.0%) | 0 (0.0%) |
| Construction & Extraction | 22 (100.0%) | 0 (0.0%) |
| Installation, Maintenance & Repair | 69 (100.0%) | 0 (0.0%) |
| Total (Category) | 91 (100.0%) | 0 (0.0%) |
| Total (Overall) | 505 (47.6%) | 556 (52.4%) |
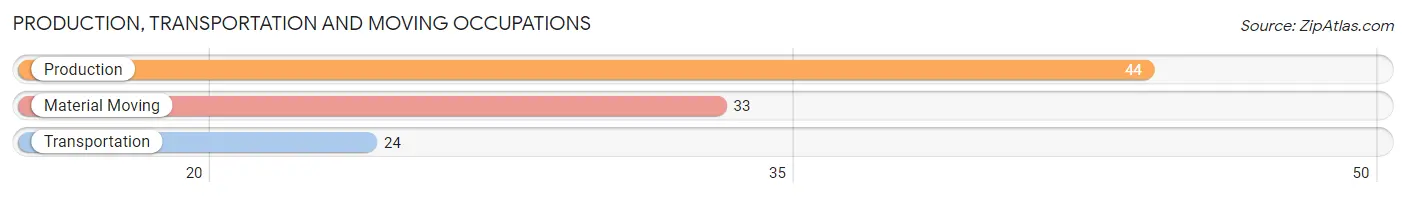
Production, Transportation and Moving Occupations
The most common Production, Transportation and Moving occupations in Hunter are Production (44 | 4.2%), Material Moving (33 | 3.1%), and Transportation (24 | 2.3%).
Production, Transportation and Moving Occupations by Sex
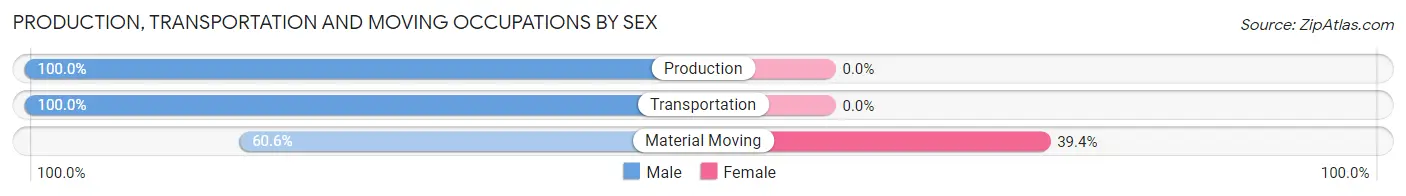
| Occupation | Male | Female |
| Production | 44 (100.0%) | 0 (0.0%) |
| Transportation | 24 (100.0%) | 0 (0.0%) |
| Material Moving | 20 (60.6%) | 13 (39.4%) |
| Total (Category) | 88 (87.1%) | 13 (12.9%) |
| Total (Overall) | 505 (47.6%) | 556 (52.4%) |
Employment Industries by Sex in Hunter
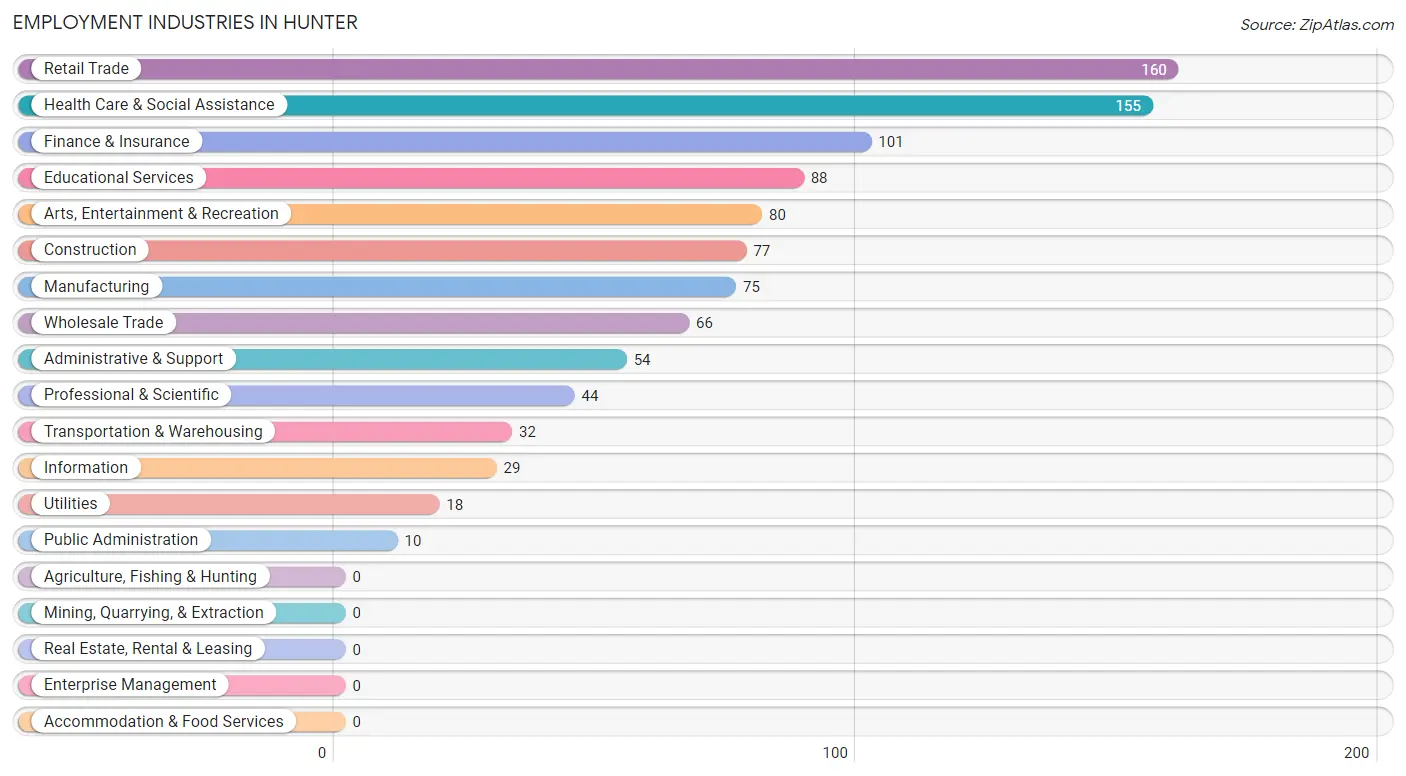
Employment Industries in Hunter
The major employment industries in Hunter include Retail Trade (160 | 15.1%), Health Care & Social Assistance (155 | 14.6%), Finance & Insurance (101 | 9.5%), Educational Services (88 | 8.3%), and Arts, Entertainment & Recreation (80 | 7.5%).
Employment Industries by Sex in Hunter
The Hunter industries that see more men than women are Construction (100.0%), Transportation & Warehousing (100.0%), and Utilities (100.0%), whereas the industries that tend to have a higher number of women are Finance & Insurance (100.0%), Professional & Scientific (93.2%), and Health Care & Social Assistance (81.3%).
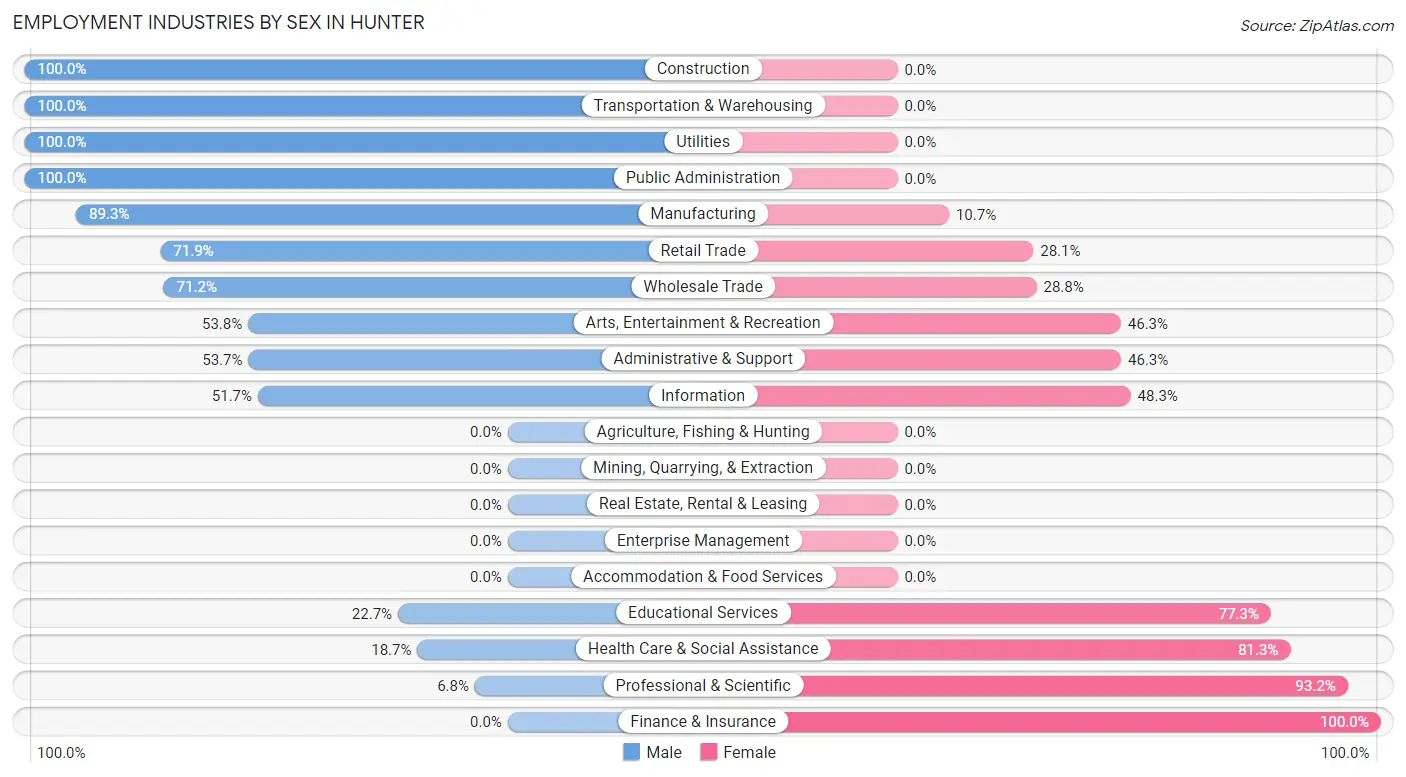
| Industry | Male | Female |
| Agriculture, Fishing & Hunting | 0 (0.0%) | 0 (0.0%) |
| Mining, Quarrying, & Extraction | 0 (0.0%) | 0 (0.0%) |
| Construction | 77 (100.0%) | 0 (0.0%) |
| Manufacturing | 67 (89.3%) | 8 (10.7%) |
| Wholesale Trade | 47 (71.2%) | 19 (28.8%) |
| Retail Trade | 115 (71.9%) | 45 (28.1%) |
| Transportation & Warehousing | 32 (100.0%) | 0 (0.0%) |
| Utilities | 18 (100.0%) | 0 (0.0%) |
| Information | 15 (51.7%) | 14 (48.3%) |
| Finance & Insurance | 0 (0.0%) | 101 (100.0%) |
| Real Estate, Rental & Leasing | 0 (0.0%) | 0 (0.0%) |
| Professional & Scientific | 3 (6.8%) | 41 (93.2%) |
| Enterprise Management | 0 (0.0%) | 0 (0.0%) |
| Administrative & Support | 29 (53.7%) | 25 (46.3%) |
| Educational Services | 20 (22.7%) | 68 (77.3%) |
| Health Care & Social Assistance | 29 (18.7%) | 126 (81.3%) |
| Arts, Entertainment & Recreation | 43 (53.7%) | 37 (46.3%) |
| Accommodation & Food Services | 0 (0.0%) | 0 (0.0%) |
| Public Administration | 10 (100.0%) | 0 (0.0%) |
| Total | 505 (47.6%) | 556 (52.4%) |
Education in Hunter
School Enrollment in Hunter
The most common levels of schooling among the 495 students in Hunter are elementary school (195 | 39.4%), college / undergraduate (168 | 33.9%), and middle school (91 | 18.4%).
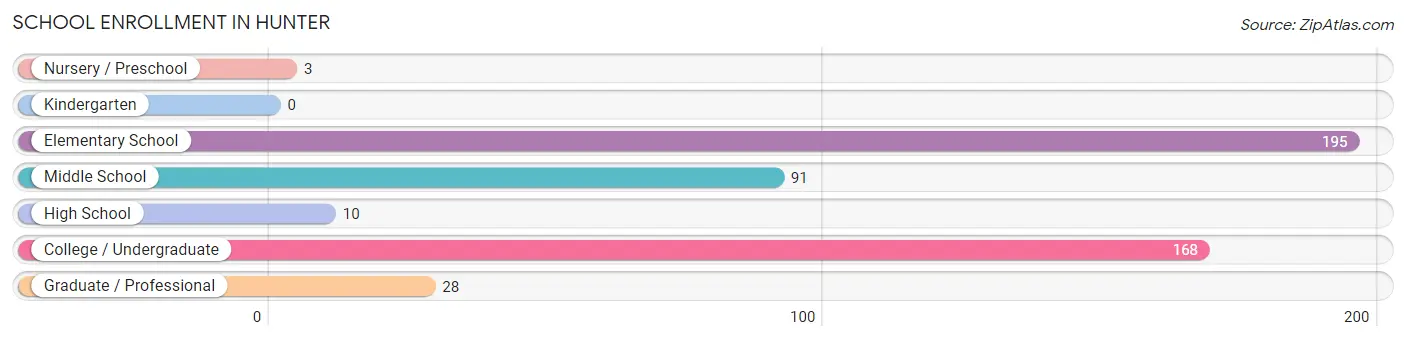
| School Level | # Students | % Students |
| Nursery / Preschool | 3 | 0.6% |
| Kindergarten | 0 | 0.0% |
| Elementary School | 195 | 39.4% |
| Middle School | 91 | 18.4% |
| High School | 10 | 2.0% |
| College / Undergraduate | 168 | 33.9% |
| Graduate / Professional | 28 | 5.7% |
| Total | 495 | 100.0% |
School Enrollment by Age by Funding Source in Hunter
Out of a total of 495 students who are enrolled in schools in Hunter, 41 (8.3%) attend a private institution, while the remaining 454 (91.7%) are enrolled in public schools. The age group of 35 years and over has the highest likelihood of being enrolled in private schools, with 26 (100.0% in the age bracket) enrolled. Conversely, the age group of 3 to 4 year olds has the lowest likelihood of being enrolled in a private school, with 1 (100.0% in the age bracket) attending a public institution.
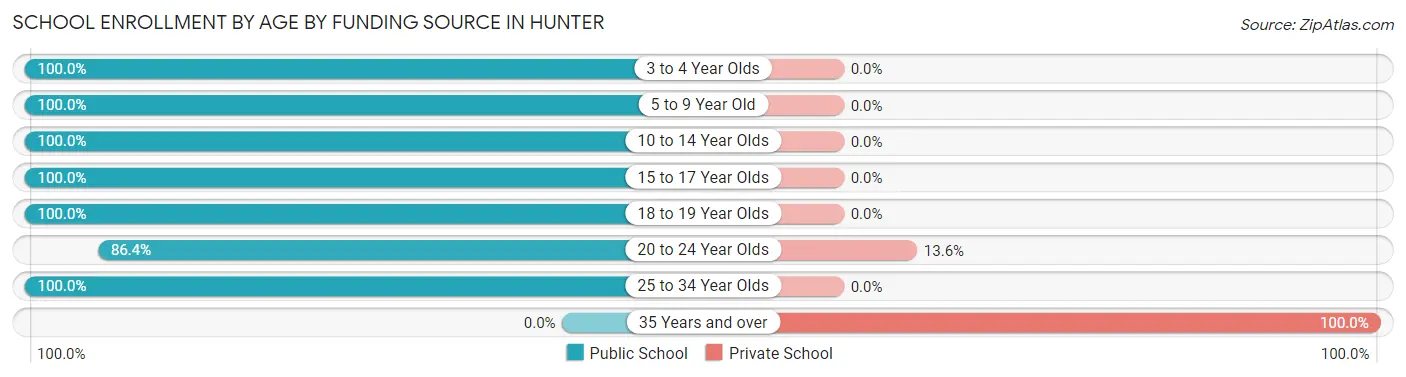
| Age Bracket | Public School | Private School |
| 3 to 4 Year Olds | 1 (100.0%) | 0 (0.0%) |
| 5 to 9 Year Old | 84 (100.0%) | 0 (0.0%) |
| 10 to 14 Year Olds | 204 (100.0%) | 0 (0.0%) |
| 15 to 17 Year Olds | 10 (100.0%) | 0 (0.0%) |
| 18 to 19 Year Olds | 3 (100.0%) | 0 (0.0%) |
| 20 to 24 Year Olds | 95 (86.4%) | 15 (13.6%) |
| 25 to 34 Year Olds | 57 (100.0%) | 0 (0.0%) |
| 35 Years and over | 0 (0.0%) | 26 (100.0%) |
| Total | 454 (91.7%) | 41 (8.3%) |
Educational Attainment by Field of Study in Hunter
Communications (64 | 26.1%), psychology (57 | 23.3%), arts & humanities (49 | 20.0%), education (40 | 16.3%), and liberal arts & history (20 | 8.2%) are the most common fields of study among 245 individuals in Hunter who have obtained a bachelor's degree or higher.
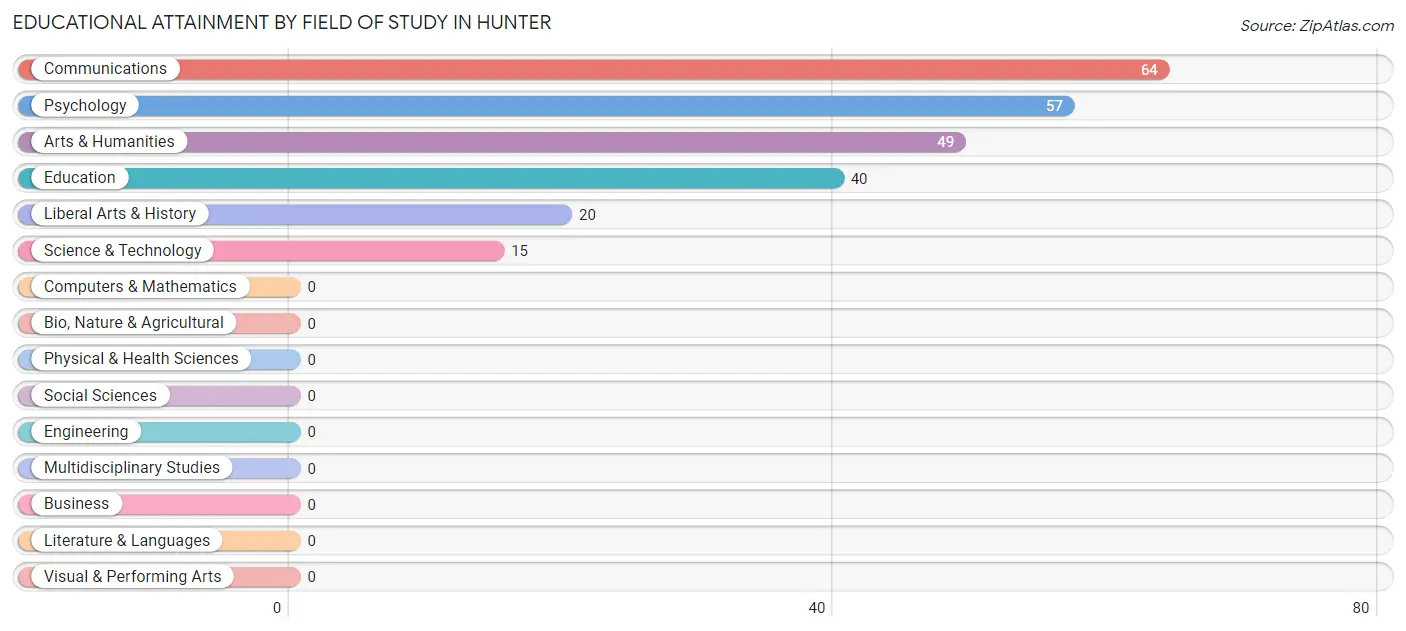
| Field of Study | # Graduates | % Graduates |
| Computers & Mathematics | 0 | 0.0% |
| Bio, Nature & Agricultural | 0 | 0.0% |
| Physical & Health Sciences | 0 | 0.0% |
| Psychology | 57 | 23.3% |
| Social Sciences | 0 | 0.0% |
| Engineering | 0 | 0.0% |
| Multidisciplinary Studies | 0 | 0.0% |
| Science & Technology | 15 | 6.1% |
| Business | 0 | 0.0% |
| Education | 40 | 16.3% |
| Literature & Languages | 0 | 0.0% |
| Liberal Arts & History | 20 | 8.2% |
| Visual & Performing Arts | 0 | 0.0% |
| Communications | 64 | 26.1% |
| Arts & Humanities | 49 | 20.0% |
| Total | 245 | 100.0% |
Transportation & Commute in Hunter
Vehicle Availability by Sex in Hunter
The most prevalent vehicle ownership categories in Hunter are males with 2 vehicles (245, accounting for 48.5%) and females with 2 vehicles (187, making up 44.1%).
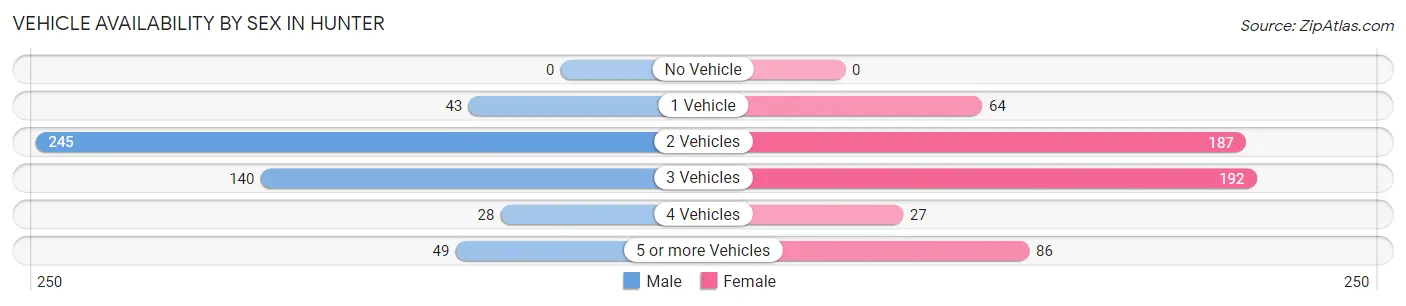
| Vehicles Available | Male | Female |
| No Vehicle | 0 (0.0%) | 0 (0.0%) |
| 1 Vehicle | 43 (8.5%) | 64 (11.5%) |
| 2 Vehicles | 245 (48.5%) | 187 (33.6%) |
| 3 Vehicles | 140 (27.7%) | 192 (34.5%) |
| 4 Vehicles | 28 (5.5%) | 27 (4.9%) |
| 5 or more Vehicles | 49 (9.7%) | 86 (15.5%) |
| Total | 505 (100.0%) | 556 (100.0%) |
Commute Time in Hunter
The most frequently occuring commute durations in Hunter are 30 to 34 minutes (231 commuters, 23.8%), 45 to 59 minutes (169 commuters, 17.4%), and 10 to 14 minutes (126 commuters, 13.0%).
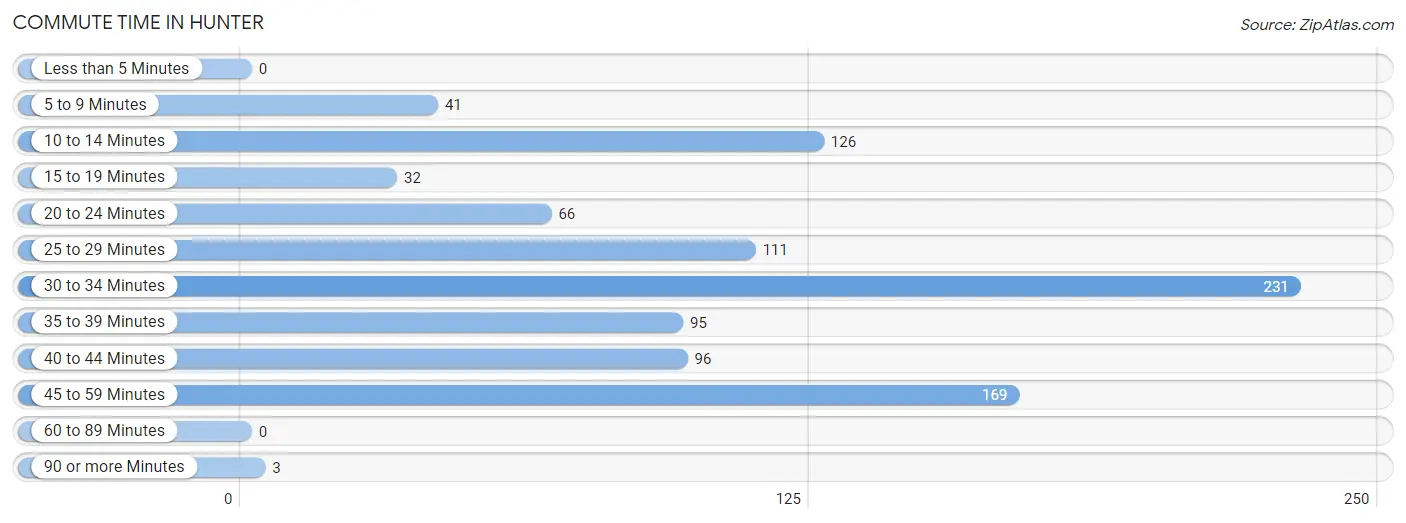
| Commute Time | # Commuters | % Commuters |
| Less than 5 Minutes | 0 | 0.0% |
| 5 to 9 Minutes | 41 | 4.2% |
| 10 to 14 Minutes | 126 | 13.0% |
| 15 to 19 Minutes | 32 | 3.3% |
| 20 to 24 Minutes | 66 | 6.8% |
| 25 to 29 Minutes | 111 | 11.4% |
| 30 to 34 Minutes | 231 | 23.8% |
| 35 to 39 Minutes | 95 | 9.8% |
| 40 to 44 Minutes | 96 | 9.9% |
| 45 to 59 Minutes | 169 | 17.4% |
| 60 to 89 Minutes | 0 | 0.0% |
| 90 or more Minutes | 3 | 0.3% |
Commute Time by Sex in Hunter
The most common commute times in Hunter are 30 to 34 minutes (136 commuters, 27.8%) for males and 45 to 59 minutes (136 commuters, 28.3%) for females.
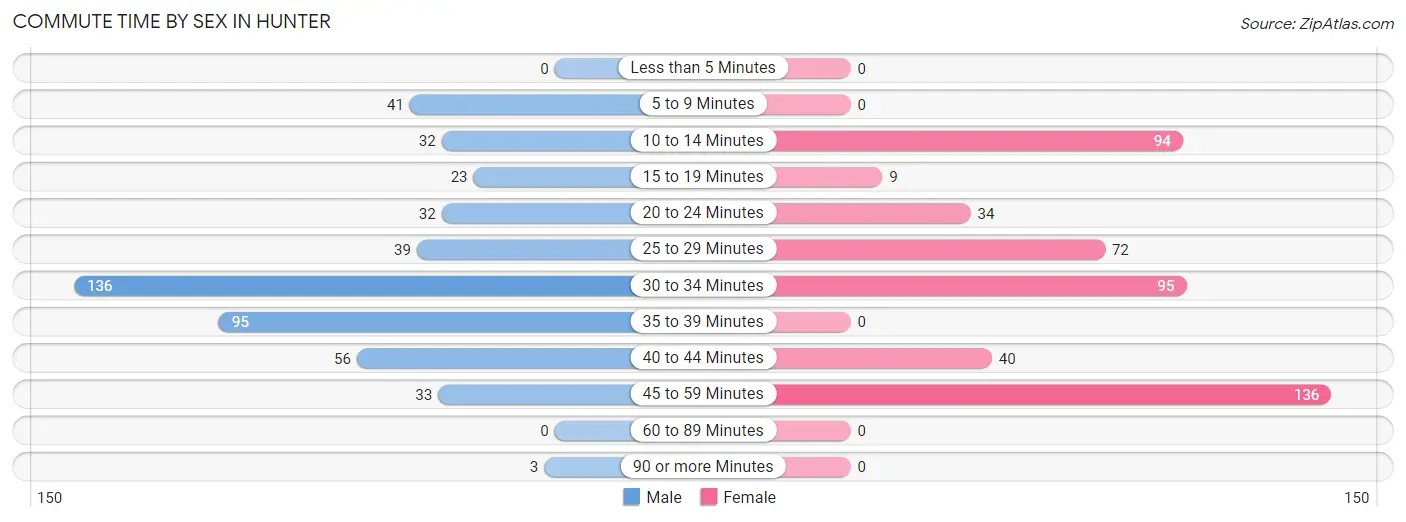
| Commute Time | Male | Female |
| Less than 5 Minutes | 0 (0.0%) | 0 (0.0%) |
| 5 to 9 Minutes | 41 (8.4%) | 0 (0.0%) |
| 10 to 14 Minutes | 32 (6.5%) | 94 (19.6%) |
| 15 to 19 Minutes | 23 (4.7%) | 9 (1.9%) |
| 20 to 24 Minutes | 32 (6.5%) | 34 (7.1%) |
| 25 to 29 Minutes | 39 (8.0%) | 72 (15.0%) |
| 30 to 34 Minutes | 136 (27.8%) | 95 (19.8%) |
| 35 to 39 Minutes | 95 (19.4%) | 0 (0.0%) |
| 40 to 44 Minutes | 56 (11.4%) | 40 (8.3%) |
| 45 to 59 Minutes | 33 (6.7%) | 136 (28.3%) |
| 60 to 89 Minutes | 0 (0.0%) | 0 (0.0%) |
| 90 or more Minutes | 3 (0.6%) | 0 (0.0%) |
Time of Departure to Work by Sex in Hunter
The most frequent times of departure to work in Hunter are 7:00 AM to 7:29 AM (238, 48.6%) for males and 7:30 AM to 7:59 AM (81, 16.9%) for females.
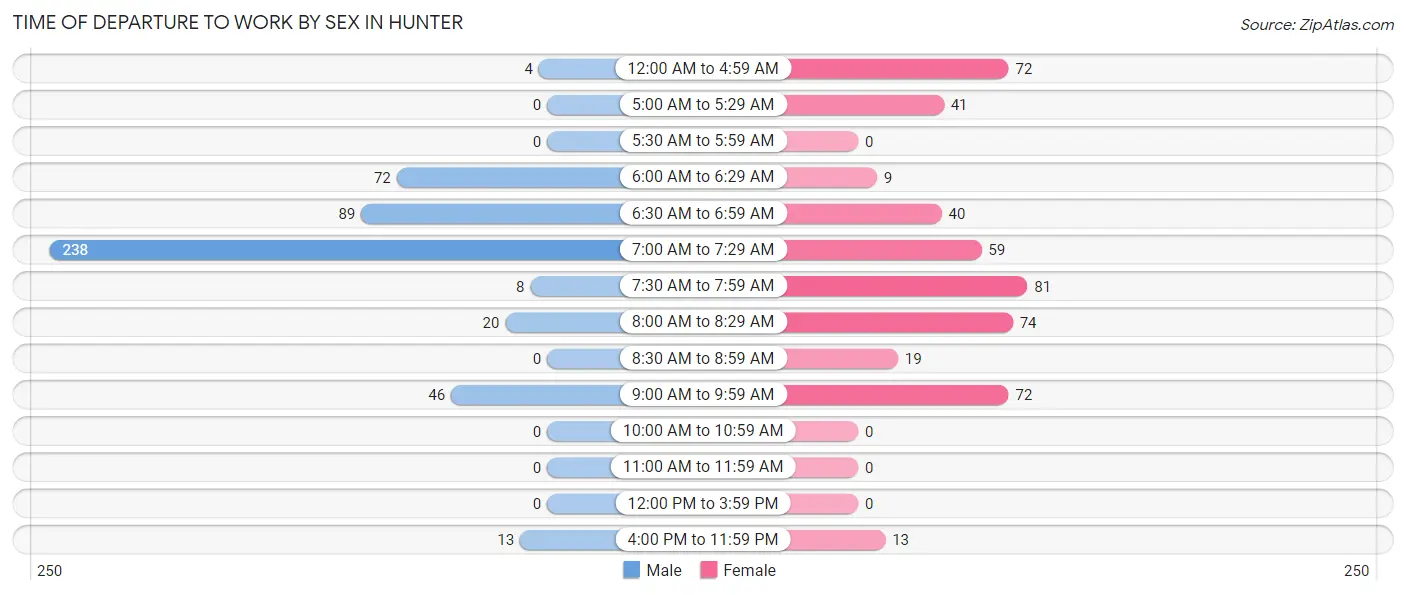
| Time of Departure | Male | Female |
| 12:00 AM to 4:59 AM | 4 (0.8%) | 72 (15.0%) |
| 5:00 AM to 5:29 AM | 0 (0.0%) | 41 (8.5%) |
| 5:30 AM to 5:59 AM | 0 (0.0%) | 0 (0.0%) |
| 6:00 AM to 6:29 AM | 72 (14.7%) | 9 (1.9%) |
| 6:30 AM to 6:59 AM | 89 (18.2%) | 40 (8.3%) |
| 7:00 AM to 7:29 AM | 238 (48.6%) | 59 (12.3%) |
| 7:30 AM to 7:59 AM | 8 (1.6%) | 81 (16.9%) |
| 8:00 AM to 8:29 AM | 20 (4.1%) | 74 (15.4%) |
| 8:30 AM to 8:59 AM | 0 (0.0%) | 19 (4.0%) |
| 9:00 AM to 9:59 AM | 46 (9.4%) | 72 (15.0%) |
| 10:00 AM to 10:59 AM | 0 (0.0%) | 0 (0.0%) |
| 11:00 AM to 11:59 AM | 0 (0.0%) | 0 (0.0%) |
| 12:00 PM to 3:59 PM | 0 (0.0%) | 0 (0.0%) |
| 4:00 PM to 11:59 PM | 13 (2.6%) | 13 (2.7%) |
| Total | 490 (100.0%) | 480 (100.0%) |
Housing Occupancy in Hunter
Occupancy by Ownership in Hunter
Of the total 929 dwellings in Hunter, owner-occupied units account for 774 (83.3%), while renter-occupied units make up 155 (16.7%).
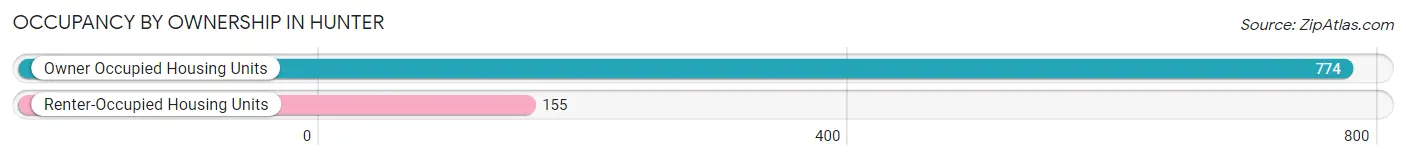
| Occupancy | # Housing Units | % Housing Units |
| Owner Occupied Housing Units | 774 | 83.3% |
| Renter-Occupied Housing Units | 155 | 16.7% |
| Total Occupied Housing Units | 929 | 100.0% |
Occupancy by Household Size in Hunter
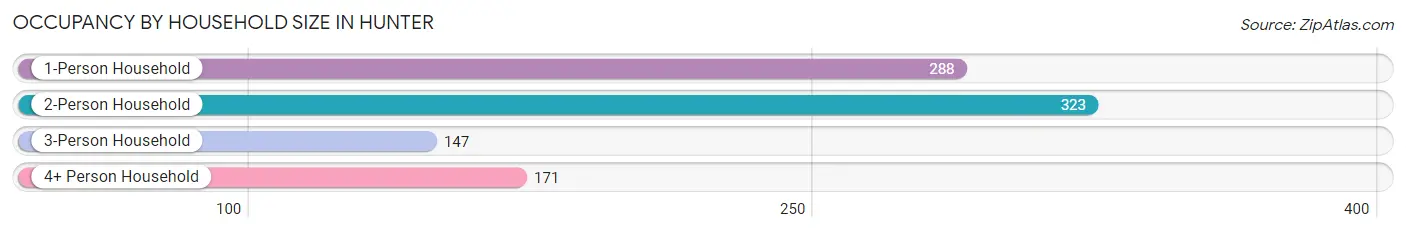
| Household Size | # Housing Units | % Housing Units |
| 1-Person Household | 288 | 31.0% |
| 2-Person Household | 323 | 34.8% |
| 3-Person Household | 147 | 15.8% |
| 4+ Person Household | 171 | 18.4% |
| Total Housing Units | 929 | 100.0% |
Occupancy by Ownership by Household Size in Hunter
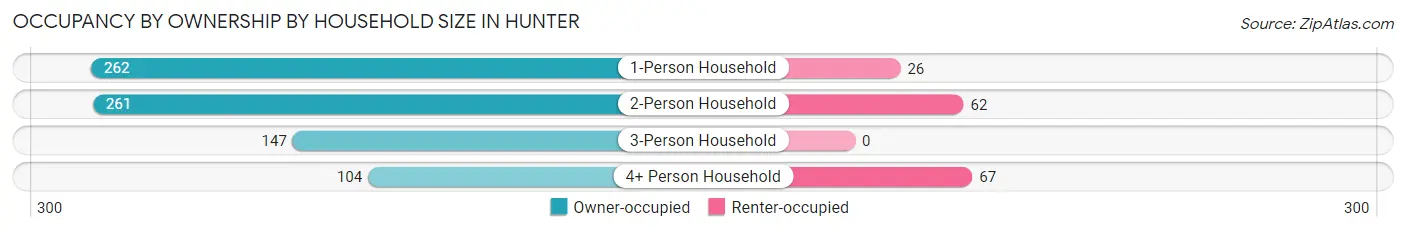
| Household Size | Owner-occupied | Renter-occupied |
| 1-Person Household | 262 (91.0%) | 26 (9.0%) |
| 2-Person Household | 261 (80.8%) | 62 (19.2%) |
| 3-Person Household | 147 (100.0%) | 0 (0.0%) |
| 4+ Person Household | 104 (60.8%) | 67 (39.2%) |
| Total Housing Units | 774 (83.3%) | 155 (16.7%) |
Occupancy by Educational Attainment in Hunter
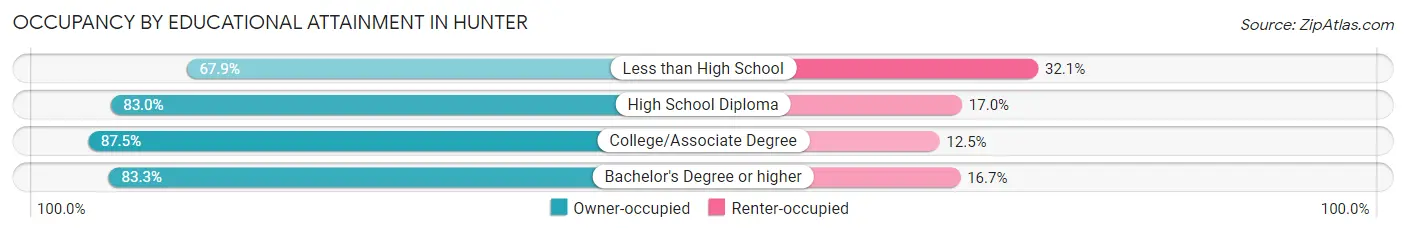
| Household Size | Owner-occupied | Renter-occupied |
| Less than High School | 55 (67.9%) | 26 (32.1%) |
| High School Diploma | 293 (83.0%) | 60 (17.0%) |
| College/Associate Degree | 286 (87.5%) | 41 (12.5%) |
| Bachelor's Degree or higher | 140 (83.3%) | 28 (16.7%) |
Occupancy by Age of Householder in Hunter
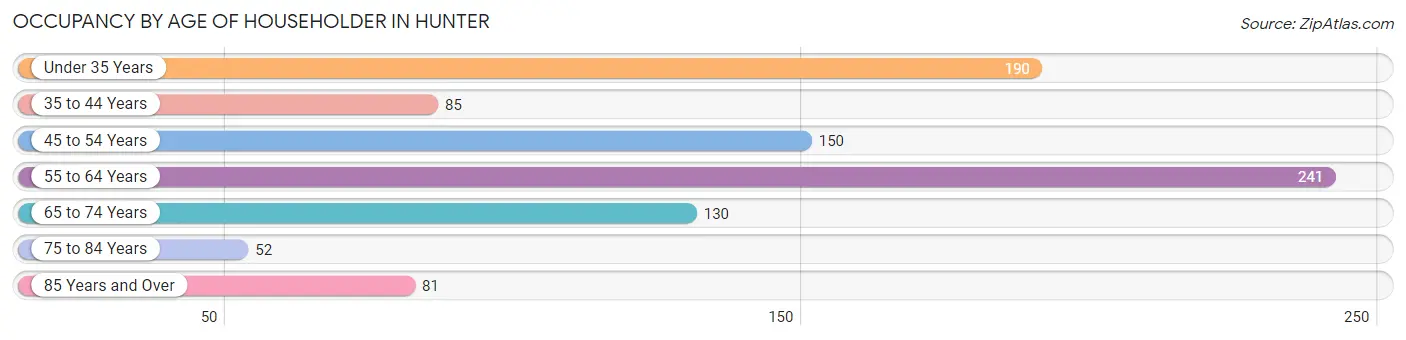
| Age Bracket | # Households | % Households |
| Under 35 Years | 190 | 20.4% |
| 35 to 44 Years | 85 | 9.1% |
| 45 to 54 Years | 150 | 16.2% |
| 55 to 64 Years | 241 | 25.9% |
| 65 to 74 Years | 130 | 14.0% |
| 75 to 84 Years | 52 | 5.6% |
| 85 Years and Over | 81 | 8.7% |
| Total | 929 | 100.0% |
Housing Finances in Hunter
Median Income by Occupancy in Hunter
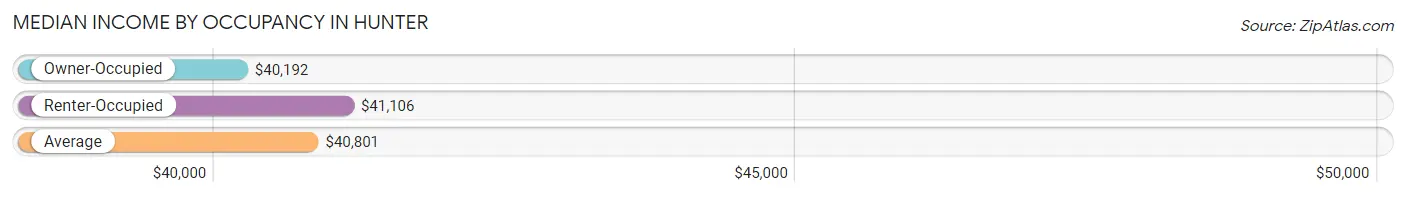
| Occupancy Type | # Households | Median Income |
| Owner-Occupied | 774 (83.3%) | $40,192 |
| Renter-Occupied | 155 (16.7%) | $41,106 |
| Average | 929 (100.0%) | $40,801 |
Occupancy by Householder Income Bracket in Hunter
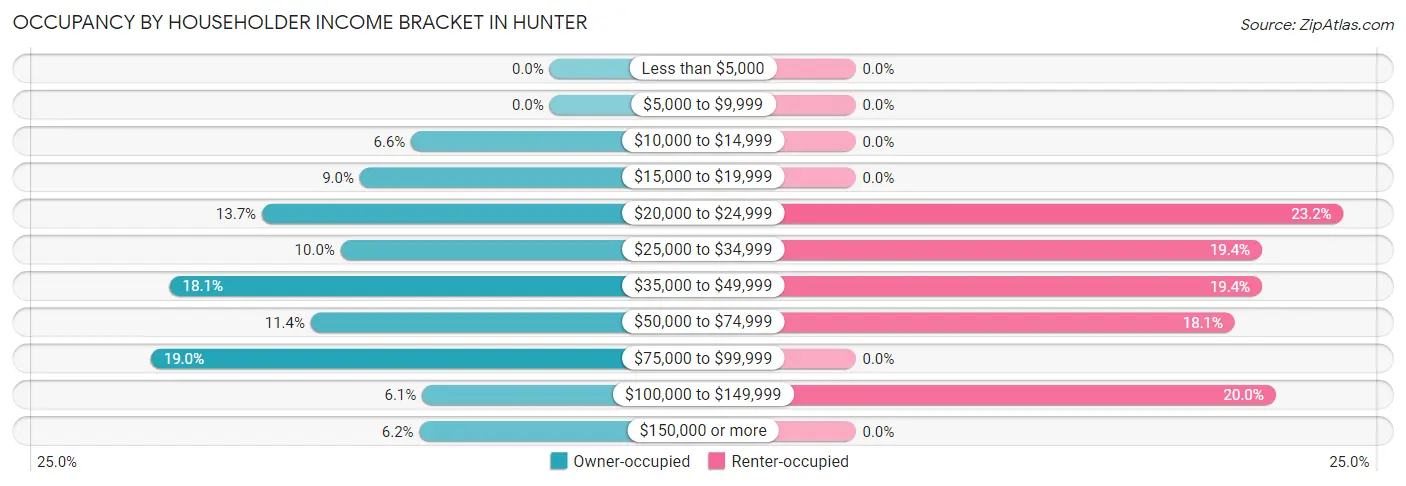
| Income Bracket | Owner-occupied | Renter-occupied |
| Less than $5,000 | 0 (0.0%) | 0 (0.0%) |
| $5,000 to $9,999 | 0 (0.0%) | 0 (0.0%) |
| $10,000 to $14,999 | 51 (6.6%) | 0 (0.0%) |
| $15,000 to $19,999 | 70 (9.0%) | 0 (0.0%) |
| $20,000 to $24,999 | 106 (13.7%) | 36 (23.2%) |
| $25,000 to $34,999 | 77 (10.0%) | 30 (19.4%) |
| $35,000 to $49,999 | 140 (18.1%) | 30 (19.4%) |
| $50,000 to $74,999 | 88 (11.4%) | 28 (18.1%) |
| $75,000 to $99,999 | 147 (19.0%) | 0 (0.0%) |
| $100,000 to $149,999 | 47 (6.1%) | 31 (20.0%) |
| $150,000 or more | 48 (6.2%) | 0 (0.0%) |
| Total | 774 (100.0%) | 155 (100.0%) |
Monthly Housing Cost Tiers in Hunter
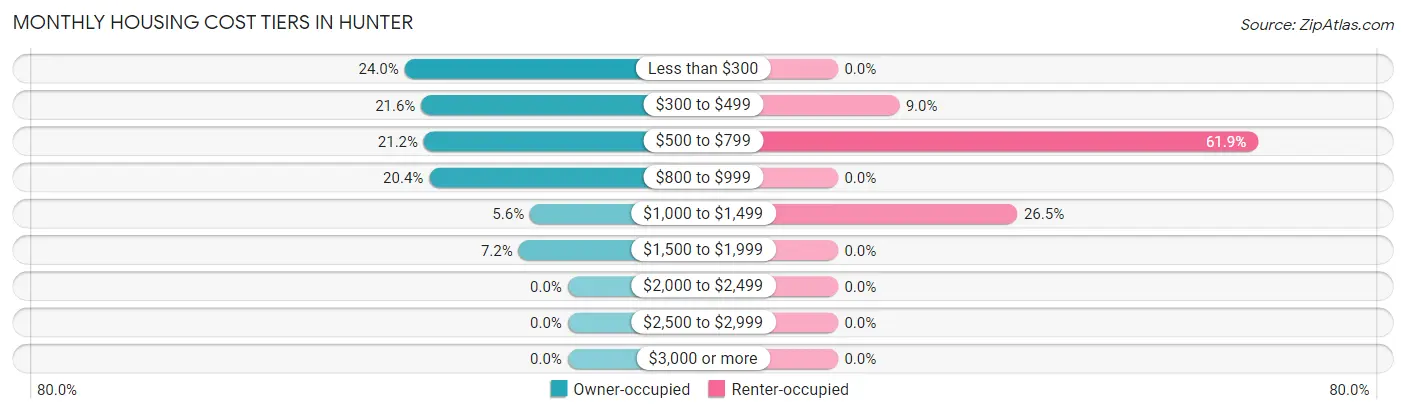
| Monthly Cost | Owner-occupied | Renter-occupied |
| Less than $300 | 186 (24.0%) | 0 (0.0%) |
| $300 to $499 | 167 (21.6%) | 14 (9.0%) |
| $500 to $799 | 164 (21.2%) | 96 (61.9%) |
| $800 to $999 | 158 (20.4%) | 0 (0.0%) |
| $1,000 to $1,499 | 43 (5.6%) | 41 (26.5%) |
| $1,500 to $1,999 | 56 (7.2%) | 0 (0.0%) |
| $2,000 to $2,499 | 0 (0.0%) | 0 (0.0%) |
| $2,500 to $2,999 | 0 (0.0%) | 0 (0.0%) |
| $3,000 or more | 0 (0.0%) | 0 (0.0%) |
| Total | 774 (100.0%) | 155 (100.0%) |
Physical Housing Characteristics in Hunter
Housing Structures in Hunter
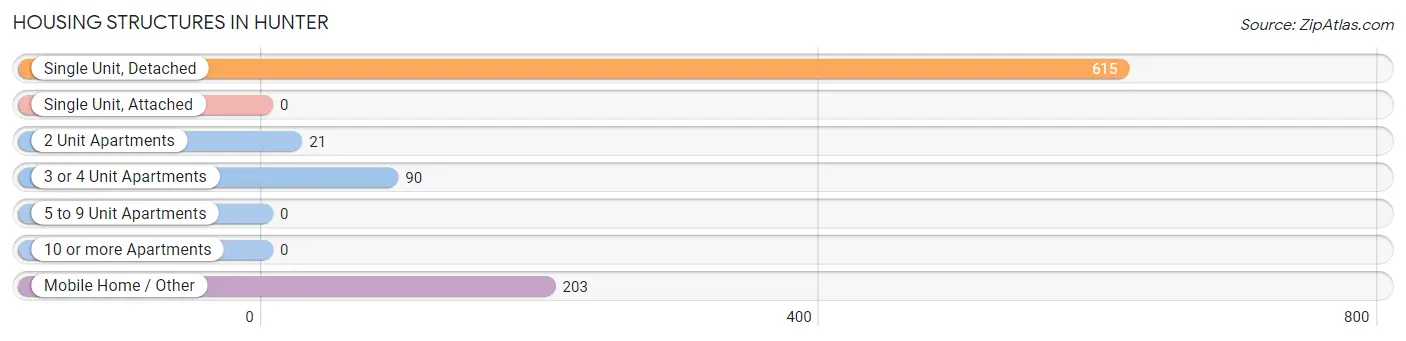
| Structure Type | # Housing Units | % Housing Units |
| Single Unit, Detached | 615 | 66.2% |
| Single Unit, Attached | 0 | 0.0% |
| 2 Unit Apartments | 21 | 2.3% |
| 3 or 4 Unit Apartments | 90 | 9.7% |
| 5 to 9 Unit Apartments | 0 | 0.0% |
| 10 or more Apartments | 0 | 0.0% |
| Mobile Home / Other | 203 | 21.8% |
| Total | 929 | 100.0% |
Housing Structures by Occupancy in Hunter
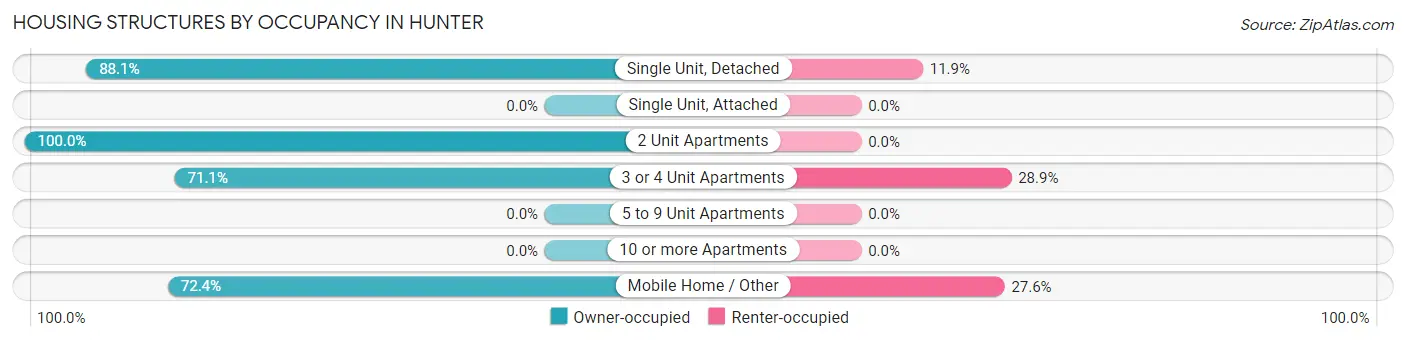
| Structure Type | Owner-occupied | Renter-occupied |
| Single Unit, Detached | 542 (88.1%) | 73 (11.9%) |
| Single Unit, Attached | 0 (0.0%) | 0 (0.0%) |
| 2 Unit Apartments | 21 (100.0%) | 0 (0.0%) |
| 3 or 4 Unit Apartments | 64 (71.1%) | 26 (28.9%) |
| 5 to 9 Unit Apartments | 0 (0.0%) | 0 (0.0%) |
| 10 or more Apartments | 0 (0.0%) | 0 (0.0%) |
| Mobile Home / Other | 147 (72.4%) | 56 (27.6%) |
| Total | 774 (83.3%) | 155 (16.7%) |
Housing Structures by Number of Rooms in Hunter
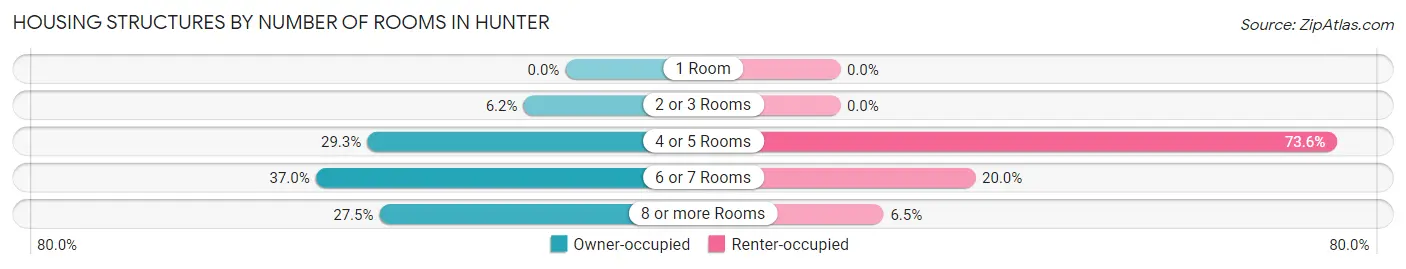
| Number of Rooms | Owner-occupied | Renter-occupied |
| 1 Room | 0 (0.0%) | 0 (0.0%) |
| 2 or 3 Rooms | 48 (6.2%) | 0 (0.0%) |
| 4 or 5 Rooms | 227 (29.3%) | 114 (73.6%) |
| 6 or 7 Rooms | 286 (36.9%) | 31 (20.0%) |
| 8 or more Rooms | 213 (27.5%) | 10 (6.5%) |
| Total | 774 (100.0%) | 155 (100.0%) |
Housing Structure by Heating Type in Hunter
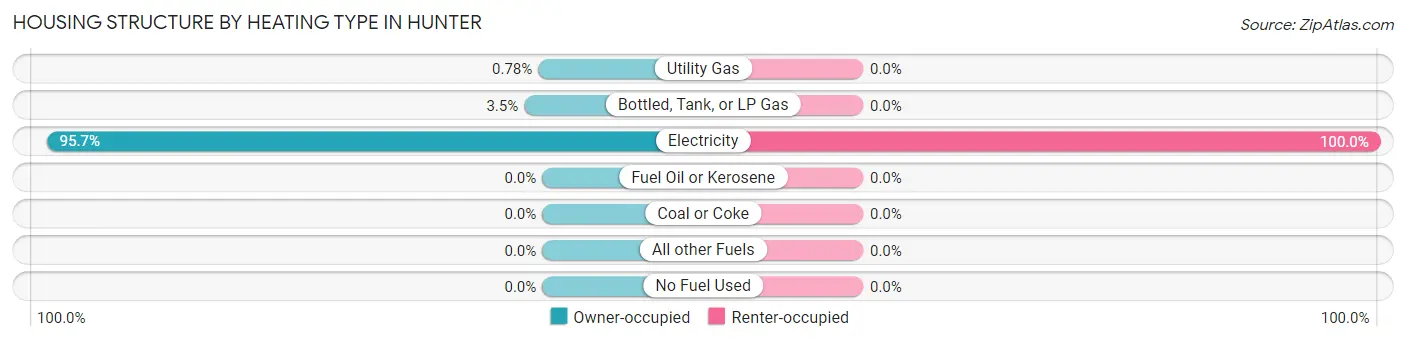
| Heating Type | Owner-occupied | Renter-occupied |
| Utility Gas | 6 (0.8%) | 0 (0.0%) |
| Bottled, Tank, or LP Gas | 27 (3.5%) | 0 (0.0%) |
| Electricity | 741 (95.7%) | 155 (100.0%) |
| Fuel Oil or Kerosene | 0 (0.0%) | 0 (0.0%) |
| Coal or Coke | 0 (0.0%) | 0 (0.0%) |
| All other Fuels | 0 (0.0%) | 0 (0.0%) |
| No Fuel Used | 0 (0.0%) | 0 (0.0%) |
| Total | 774 (100.0%) | 155 (100.0%) |
Household Vehicle Usage in Hunter
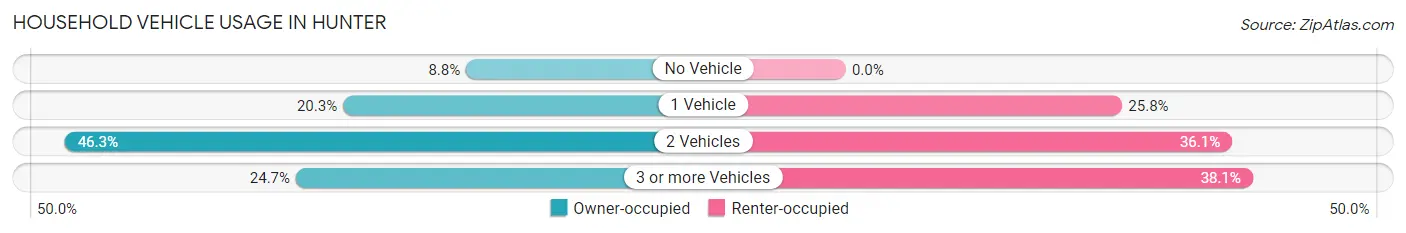
| Vehicles per Household | Owner-occupied | Renter-occupied |
| No Vehicle | 68 (8.8%) | 0 (0.0%) |
| 1 Vehicle | 157 (20.3%) | 40 (25.8%) |
| 2 Vehicles | 358 (46.3%) | 56 (36.1%) |
| 3 or more Vehicles | 191 (24.7%) | 59 (38.1%) |
| Total | 774 (100.0%) | 155 (100.0%) |
Real Estate & Mortgages in Hunter
Real Estate and Mortgage Overview in Hunter
| Characteristic | Without Mortgage | With Mortgage |
| Housing Units | 360 | 414 |
| Median Property Value | $116,000 | $153,300 |
| Median Household Income | $34,141 | $48 |
| Monthly Housing Costs | $360 | $0 |
| Real Estate Taxes | $692 | $42 |
Property Value by Mortgage Status in Hunter
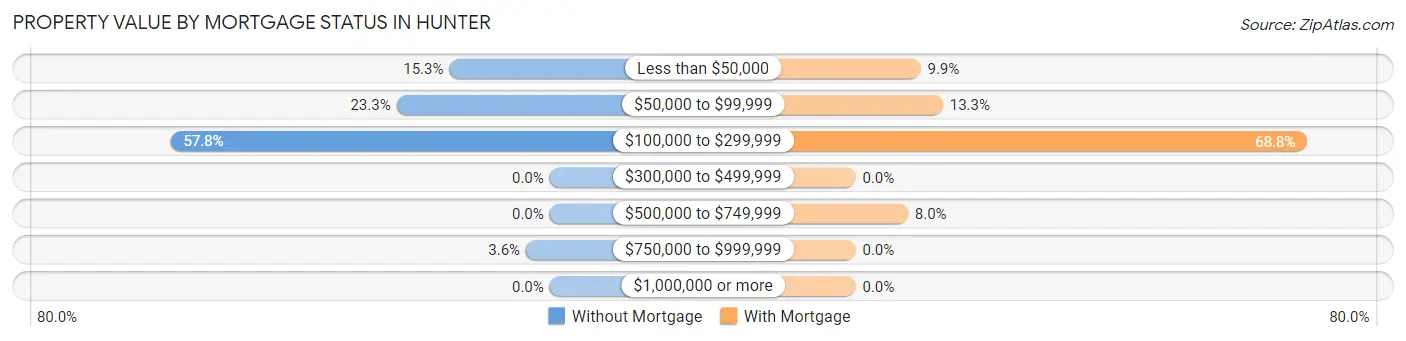
| Property Value | Without Mortgage | With Mortgage |
| Less than $50,000 | 55 (15.3%) | 41 (9.9%) |
| $50,000 to $99,999 | 84 (23.3%) | 55 (13.3%) |
| $100,000 to $299,999 | 208 (57.8%) | 285 (68.8%) |
| $300,000 to $499,999 | 0 (0.0%) | 0 (0.0%) |
| $500,000 to $749,999 | 0 (0.0%) | 33 (8.0%) |
| $750,000 to $999,999 | 13 (3.6%) | 0 (0.0%) |
| $1,000,000 or more | 0 (0.0%) | 0 (0.0%) |
| Total | 360 (100.0%) | 414 (100.0%) |
Household Income by Mortgage Status in Hunter
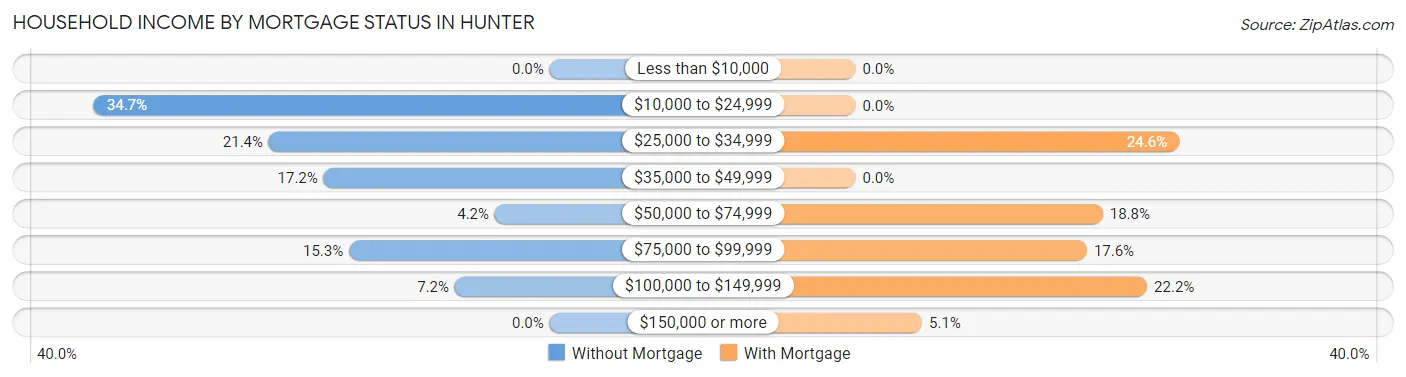
| Household Income | Without Mortgage | With Mortgage |
| Less than $10,000 | 0 (0.0%) | 0 (0.0%) |
| $10,000 to $24,999 | 125 (34.7%) | 0 (0.0%) |
| $25,000 to $34,999 | 77 (21.4%) | 102 (24.6%) |
| $35,000 to $49,999 | 62 (17.2%) | 0 (0.0%) |
| $50,000 to $74,999 | 15 (4.2%) | 78 (18.8%) |
| $75,000 to $99,999 | 55 (15.3%) | 73 (17.6%) |
| $100,000 to $149,999 | 26 (7.2%) | 92 (22.2%) |
| $150,000 or more | 0 (0.0%) | 21 (5.1%) |
| Total | 360 (100.0%) | 414 (100.0%) |
Property Value to Household Income Ratio in Hunter
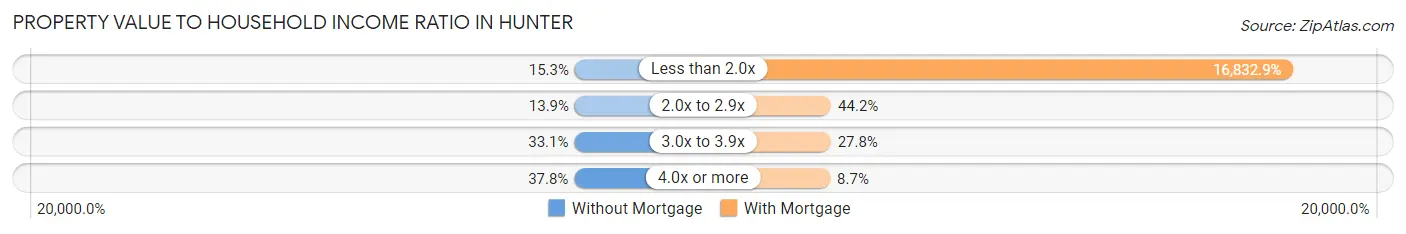
| Value-to-Income Ratio | Without Mortgage | With Mortgage |
| Less than 2.0x | 55 (15.3%) | 69,688 (16,832.8%) |
| 2.0x to 2.9x | 50 (13.9%) | 183 (44.2%) |
| 3.0x to 3.9x | 119 (33.1%) | 115 (27.8%) |
| 4.0x or more | 136 (37.8%) | 36 (8.7%) |
| Total | 360 (100.0%) | 414 (100.0%) |
Real Estate Taxes by Mortgage Status in Hunter
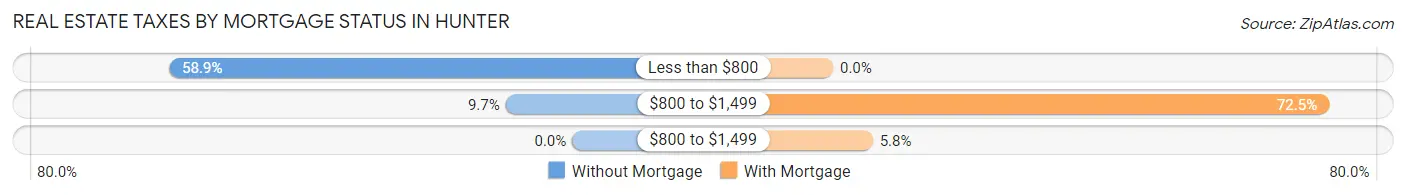
| Property Taxes | Without Mortgage | With Mortgage |
| Less than $800 | 212 (58.9%) | 0 (0.0%) |
| $800 to $1,499 | 35 (9.7%) | 300 (72.5%) |
| $800 to $1,499 | 0 (0.0%) | 24 (5.8%) |
| Total | 360 (100.0%) | 414 (100.0%) |
Health & Disability in Hunter
Health Insurance Coverage by Age in Hunter
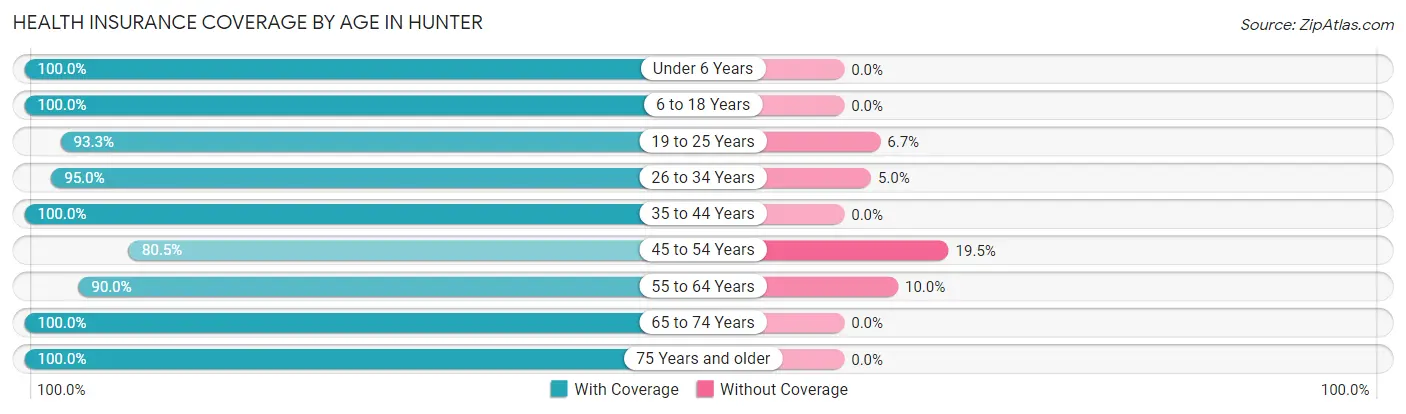
| Age Bracket | With Coverage | Without Coverage |
| Under 6 Years | 104 (100.0%) | 0 (0.0%) |
| 6 to 18 Years | 298 (100.0%) | 0 (0.0%) |
| 19 to 25 Years | 208 (93.3%) | 15 (6.7%) |
| 26 to 34 Years | 267 (95.0%) | 14 (5.0%) |
| 35 to 44 Years | 199 (100.0%) | 0 (0.0%) |
| 45 to 54 Years | 240 (80.5%) | 58 (19.5%) |
| 55 to 64 Years | 323 (90.0%) | 36 (10.0%) |
| 65 to 74 Years | 197 (100.0%) | 0 (0.0%) |
| 75 Years and older | 162 (100.0%) | 0 (0.0%) |
| Total | 1,998 (94.2%) | 123 (5.8%) |
Health Insurance Coverage by Citizenship Status in Hunter
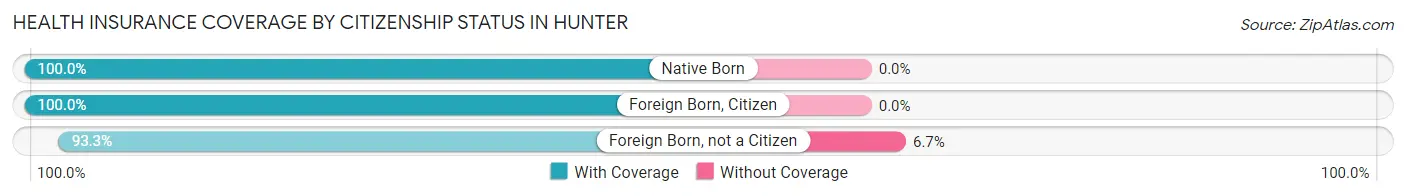
| Citizenship Status | With Coverage | Without Coverage |
| Native Born | 104 (100.0%) | 0 (0.0%) |
| Foreign Born, Citizen | 298 (100.0%) | 0 (0.0%) |
| Foreign Born, not a Citizen | 208 (93.3%) | 15 (6.7%) |
Health Insurance Coverage by Household Income in Hunter
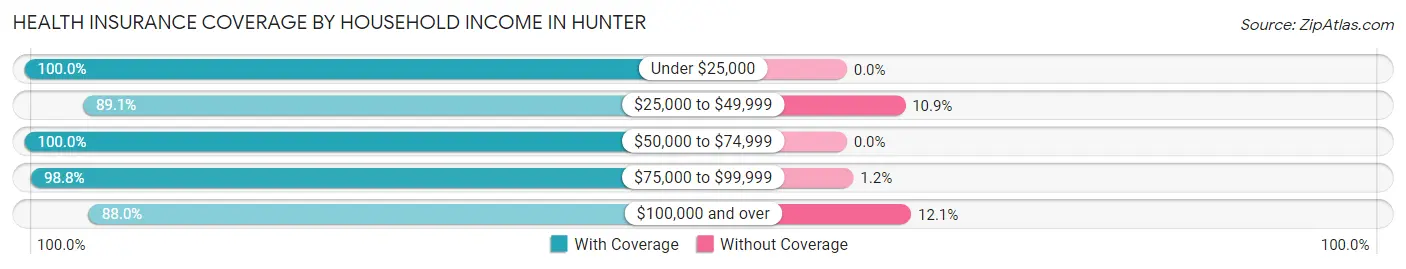
| Household Income | With Coverage | Without Coverage |
| Under $25,000 | 304 (100.0%) | 0 (0.0%) |
| $25,000 to $49,999 | 570 (89.1%) | 70 (10.9%) |
| $50,000 to $74,999 | 305 (100.0%) | 0 (0.0%) |
| $75,000 to $99,999 | 476 (98.8%) | 6 (1.2%) |
| $100,000 and over | 343 (87.9%) | 47 (12.0%) |
Public vs Private Health Insurance Coverage by Age in Hunter
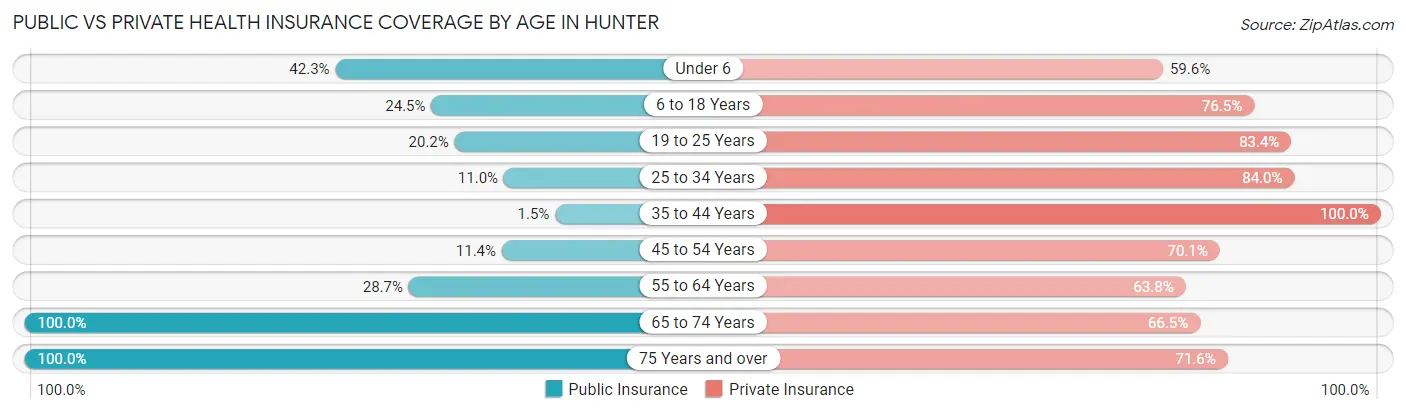
| Age Bracket | Public Insurance | Private Insurance |
| Under 6 | 44 (42.3%) | 62 (59.6%) |
| 6 to 18 Years | 73 (24.5%) | 228 (76.5%) |
| 19 to 25 Years | 45 (20.2%) | 186 (83.4%) |
| 25 to 34 Years | 31 (11.0%) | 236 (84.0%) |
| 35 to 44 Years | 3 (1.5%) | 199 (100.0%) |
| 45 to 54 Years | 34 (11.4%) | 209 (70.1%) |
| 55 to 64 Years | 103 (28.7%) | 229 (63.8%) |
| 65 to 74 Years | 197 (100.0%) | 131 (66.5%) |
| 75 Years and over | 162 (100.0%) | 116 (71.6%) |
| Total | 692 (32.6%) | 1,596 (75.2%) |
Disability Status by Sex by Age in Hunter
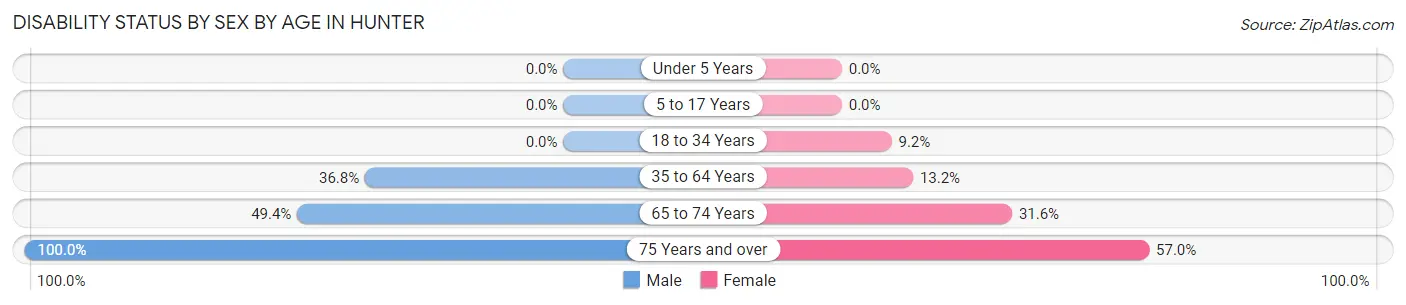
| Age Bracket | Male | Female |
| Under 5 Years | 0 (0.0%) | 0 (0.0%) |
| 5 to 17 Years | 0 (0.0%) | 0 (0.0%) |
| 18 to 34 Years | 0 (0.0%) | 31 (9.2%) |
| 35 to 64 Years | 173 (36.8%) | 51 (13.2%) |
| 65 to 74 Years | 41 (49.4%) | 36 (31.6%) |
| 75 Years and over | 20 (100.0%) | 81 (57.0%) |
Disability Class by Sex by Age in Hunter
Disability Class: Hearing Difficulty
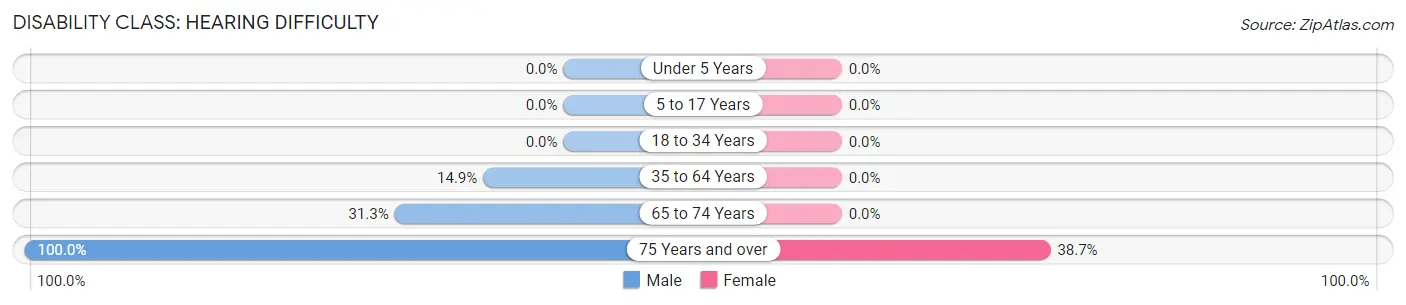
| Age Bracket | Male | Female |
| Under 5 Years | 0 (0.0%) | 0 (0.0%) |
| 5 to 17 Years | 0 (0.0%) | 0 (0.0%) |
| 18 to 34 Years | 0 (0.0%) | 0 (0.0%) |
| 35 to 64 Years | 70 (14.9%) | 0 (0.0%) |
| 65 to 74 Years | 26 (31.3%) | 0 (0.0%) |
| 75 Years and over | 20 (100.0%) | 55 (38.7%) |
Disability Class: Vision Difficulty
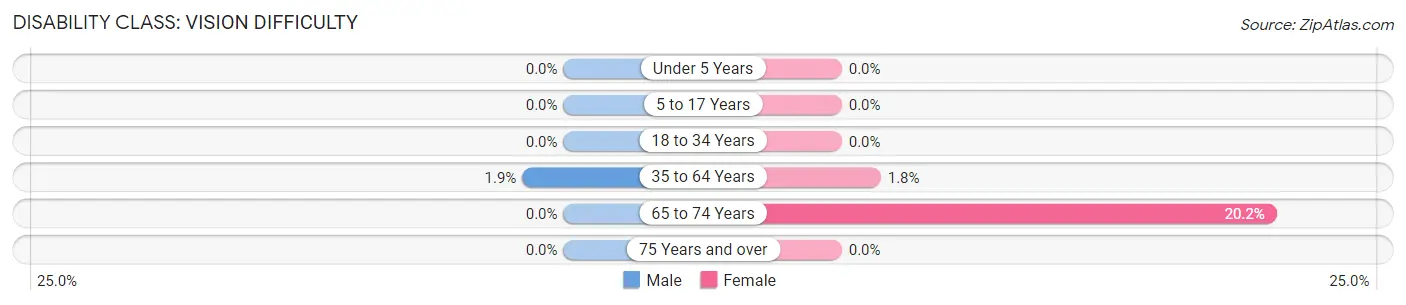
| Age Bracket | Male | Female |
| Under 5 Years | 0 (0.0%) | 0 (0.0%) |
| 5 to 17 Years | 0 (0.0%) | 0 (0.0%) |
| 18 to 34 Years | 0 (0.0%) | 0 (0.0%) |
| 35 to 64 Years | 9 (1.9%) | 7 (1.8%) |
| 65 to 74 Years | 0 (0.0%) | 23 (20.2%) |
| 75 Years and over | 0 (0.0%) | 0 (0.0%) |
Disability Class: Cognitive Difficulty
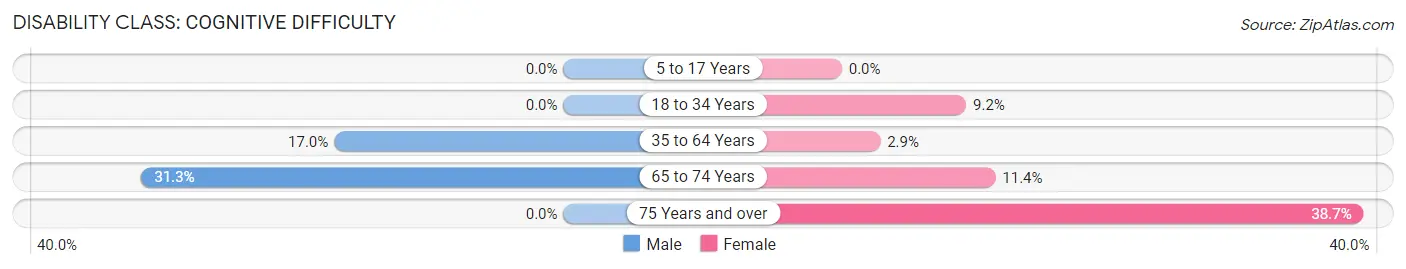
| Age Bracket | Male | Female |
| 5 to 17 Years | 0 (0.0%) | 0 (0.0%) |
| 18 to 34 Years | 0 (0.0%) | 31 (9.2%) |
| 35 to 64 Years | 80 (17.0%) | 11 (2.9%) |
| 65 to 74 Years | 26 (31.3%) | 13 (11.4%) |
| 75 Years and over | 0 (0.0%) | 55 (38.7%) |
Disability Class: Ambulatory Difficulty
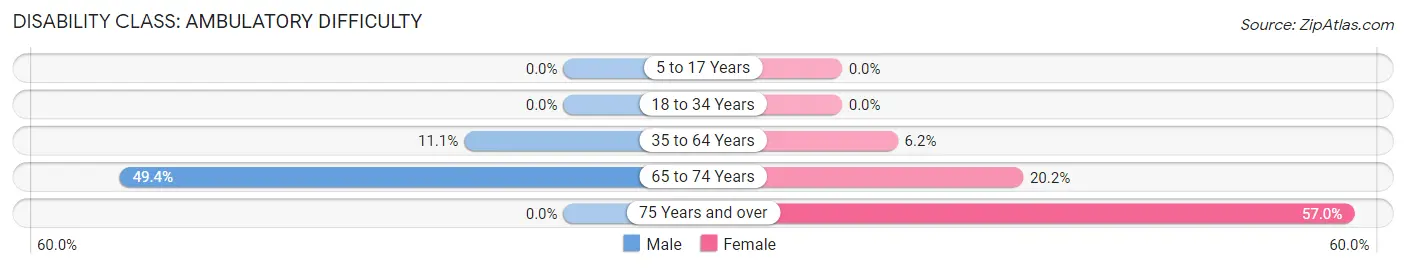
| Age Bracket | Male | Female |
| 5 to 17 Years | 0 (0.0%) | 0 (0.0%) |
| 18 to 34 Years | 0 (0.0%) | 0 (0.0%) |
| 35 to 64 Years | 52 (11.1%) | 24 (6.2%) |
| 65 to 74 Years | 41 (49.4%) | 23 (20.2%) |
| 75 Years and over | 0 (0.0%) | 81 (57.0%) |
Disability Class: Self-Care Difficulty
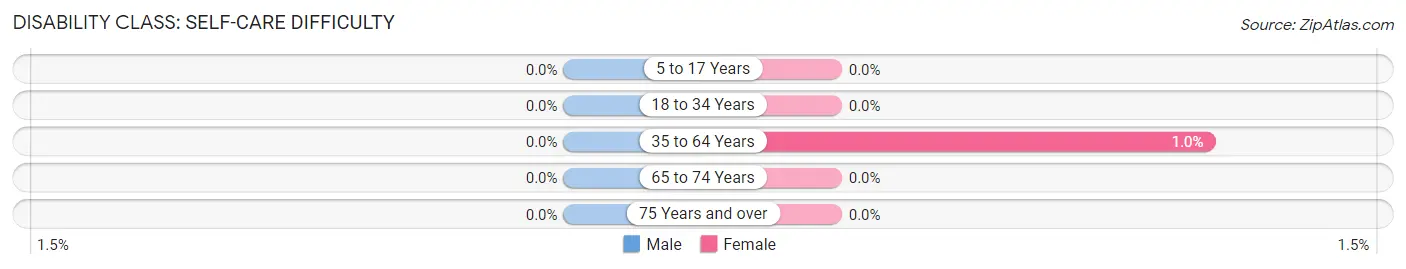
| Age Bracket | Male | Female |
| 5 to 17 Years | 0 (0.0%) | 0 (0.0%) |
| 18 to 34 Years | 0 (0.0%) | 0 (0.0%) |
| 35 to 64 Years | 0 (0.0%) | 4 (1.0%) |
| 65 to 74 Years | 0 (0.0%) | 0 (0.0%) |
| 75 Years and over | 0 (0.0%) | 0 (0.0%) |
Technology Access in Hunter
Computing Device Access in Hunter
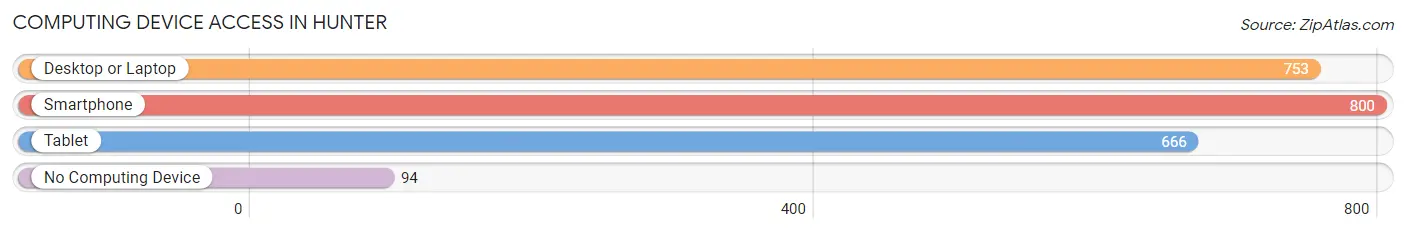
| Device Type | # Households | % Households |
| Desktop or Laptop | 753 | 81.0% |
| Smartphone | 800 | 86.1% |
| Tablet | 666 | 71.7% |
| No Computing Device | 94 | 10.1% |
| Total | 929 | 100.0% |
Internet Access in Hunter
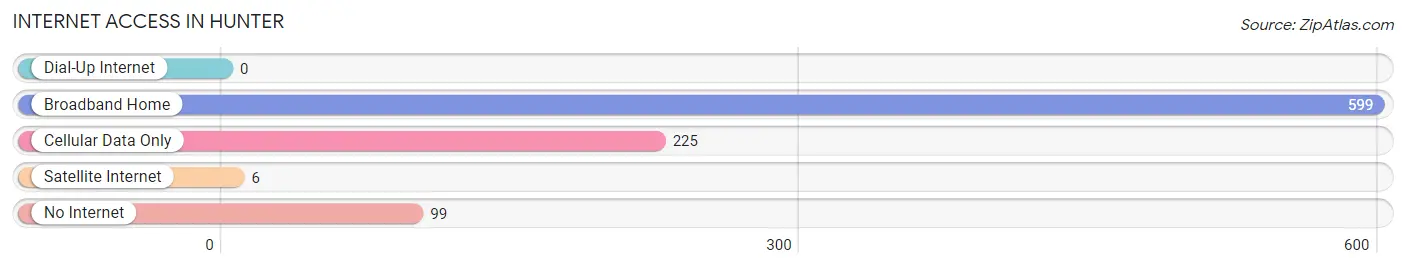
| Internet Type | # Households | % Households |
| Dial-Up Internet | 0 | 0.0% |
| Broadband Home | 599 | 64.5% |
| Cellular Data Only | 225 | 24.2% |
| Satellite Internet | 6 | 0.6% |
| No Internet | 99 | 10.7% |
| Total | 929 | 100.0% |
Hunter Summary
Hunter, Tennessee is a small town located in the foothills of the Appalachian Mountains in the eastern part of the state. It is situated in the Sequatchie Valley, which is a narrow valley that runs through the Cumberland Plateau. The town is located in Bledsoe County and is part of the Chattanooga, TN-GA Metropolitan Statistical Area. The population of Hunter was estimated to be 1,072 in 2019.
Geography
Hunter is located in the Sequatchie Valley, which is a narrow valley that runs through the Cumberland Plateau. The town is situated at an elevation of 1,068 feet above sea level. The town is located in the eastern part of the state, about 30 miles from Chattanooga, Tennessee. The town is surrounded by the Sequatchie River, which is a tributary of the Tennessee River. The town is also located near the Cumberland Plateau, which is a large plateau that runs through the eastern part of the state.
The climate in Hunter is humid subtropical, with hot summers and mild winters. The average annual temperature is around 63 degrees Fahrenheit. The average annual precipitation is around 48 inches.
Economy
The economy of Hunter is largely based on agriculture and forestry. The town is home to several farms, which produce a variety of crops, including corn, soybeans, wheat, and hay. The town is also home to several timber companies, which harvest timber from the surrounding forests.
The town is also home to several small businesses, including restaurants, convenience stores, and gas stations. The town is also home to a few manufacturing companies, which produce a variety of products, including furniture, clothing, and automotive parts.
Demographics
The population of Hunter was estimated to be 1,072 in 2019. The town is predominantly white, with about 95% of the population being white. The remaining 5% of the population is made up of African Americans, Hispanics, and other races.
The median household income in Hunter is around $35,000, which is lower than the national average. The median home value in the town is around $90,000, which is also lower than the national average.
The town has a high rate of poverty, with about 25% of the population living below the poverty line. The town also has a high rate of unemployment, with about 10% of the population being unemployed.
Conclusion
Hunter, Tennessee is a small town located in the foothills of the Appalachian Mountains in the eastern part of the state. The town is situated in the Sequatchie Valley and is part of the Chattanooga, TN-GA Metropolitan Statistical Area. The economy of Hunter is largely based on agriculture and forestry, and the town is home to several small businesses. The population of Hunter was estimated to be 1,072 in 2019, and the town is predominantly white. The median household income in Hunter is around $35,000, and the median home value is around $90,000. The town has a high rate of poverty and unemployment.
Common Questions
What is Per Capita Income in Hunter?
Per Capita income in Hunter is $27,461.
What is the Median Family Income in Hunter?
Median Family Income in Hunter is $63,542.
What is the Median Household income in Hunter?
Median Household Income in Hunter is $40,801.
What is Income or Wage Gap in Hunter?
Income or Wage Gap in Hunter is 5.2%.
Women in Hunter earn 94.8 cents for every dollar earned by a man.
What is Inequality or Gini Index in Hunter?
Inequality or Gini Index in Hunter is 0.41.
What is the Total Population of Hunter?
Total Population of Hunter is 2,121.
What is the Total Male Population of Hunter?
Total Male Population of Hunter is 933.
What is the Total Female Population of Hunter?
Total Female Population of Hunter is 1,188.
What is the Ratio of Males per 100 Females in Hunter?
There are 78.54 Males per 100 Females in Hunter.
What is the Ratio of Females per 100 Males in Hunter?
There are 127.33 Females per 100 Males in Hunter.
What is the Median Population Age in Hunter?
Median Population Age in Hunter is 39.8 Years.
What is the Average Family Size in Hunter
Average Family Size in Hunter is 2.8 People.
What is the Average Household Size in Hunter
Average Household Size in Hunter is 2.3 People.
How Large is the Labor Force in Hunter?
There are 1,069 People in the Labor Forcein in Hunter.
What is the Percentage of People in the Labor Force in Hunter?
62.2% of People are in the Labor Force in Hunter.
What is the Unemployment Rate in Hunter?
Unemployment Rate in Hunter is 0.8%.