Banner Hill, TN Map & Demographics
Banner Hill Map
Banner Hill Overview
$34,404
PER CAPITA INCOME
$80,972
AVG FAMILY INCOME
$72,176
AVG HOUSEHOLD INCOME
7.2%
WAGE / INCOME GAP [ % ]
92.8¢/ $1
WAGE / INCOME GAP [ $ ]
0.39
INEQUALITY / GINI INDEX
1,571
TOTAL POPULATION
802
MALE POPULATION
769
FEMALE POPULATION
104.29
MALES / 100 FEMALES
95.89
FEMALES / 100 MALES
42.9
MEDIAN AGE
2.9
AVG FAMILY SIZE
2.6
AVG HOUSEHOLD SIZE
746
LABOR FORCE [ PEOPLE ]
61.8%
PERCENT IN LABOR FORCE
7.9%
UNEMPLOYMENT RATE
Income in Banner Hill
Income Overview in Banner Hill
Per Capita Income in Banner Hill is $34,404, while median incomes of families and households are $80,972 and $72,176 respectively.
| Characteristic | Number | Measure |
| Per Capita Income | 1,571 | $34,404 |
| Median Family Income | 459 | $80,972 |
| Mean Family Income | 459 | $94,566 |
| Median Household Income | 561 | $72,176 |
| Mean Household Income | 561 | $89,872 |
| Income Deficit | 459 | $0 |
| Wage / Income Gap (%) | 1,571 | 7.18% |
| Wage / Income Gap ($) | 1,571 | 92.82¢ per $1 |
| Gini / Inequality Index | 1,571 | 0.39 |
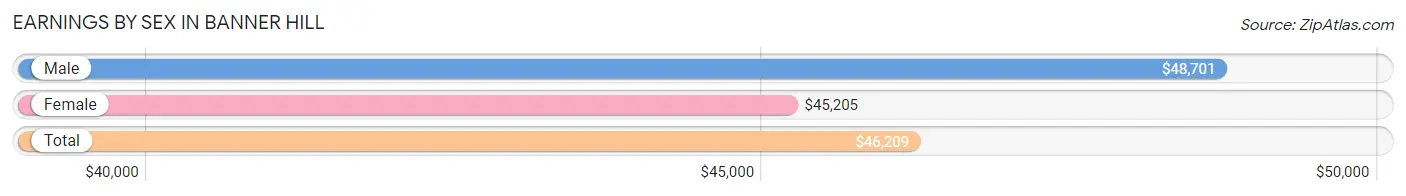
Earnings by Sex in Banner Hill
Average Earnings in Banner Hill are $46,209, $48,701 for men and $45,205 for women, a difference of 7.2%.
| Sex | Number | Average Earnings |
| Male | 475 (67.6%) | $48,701 |
| Female | 228 (32.4%) | $45,205 |
| Total | 703 (100.0%) | $46,209 |
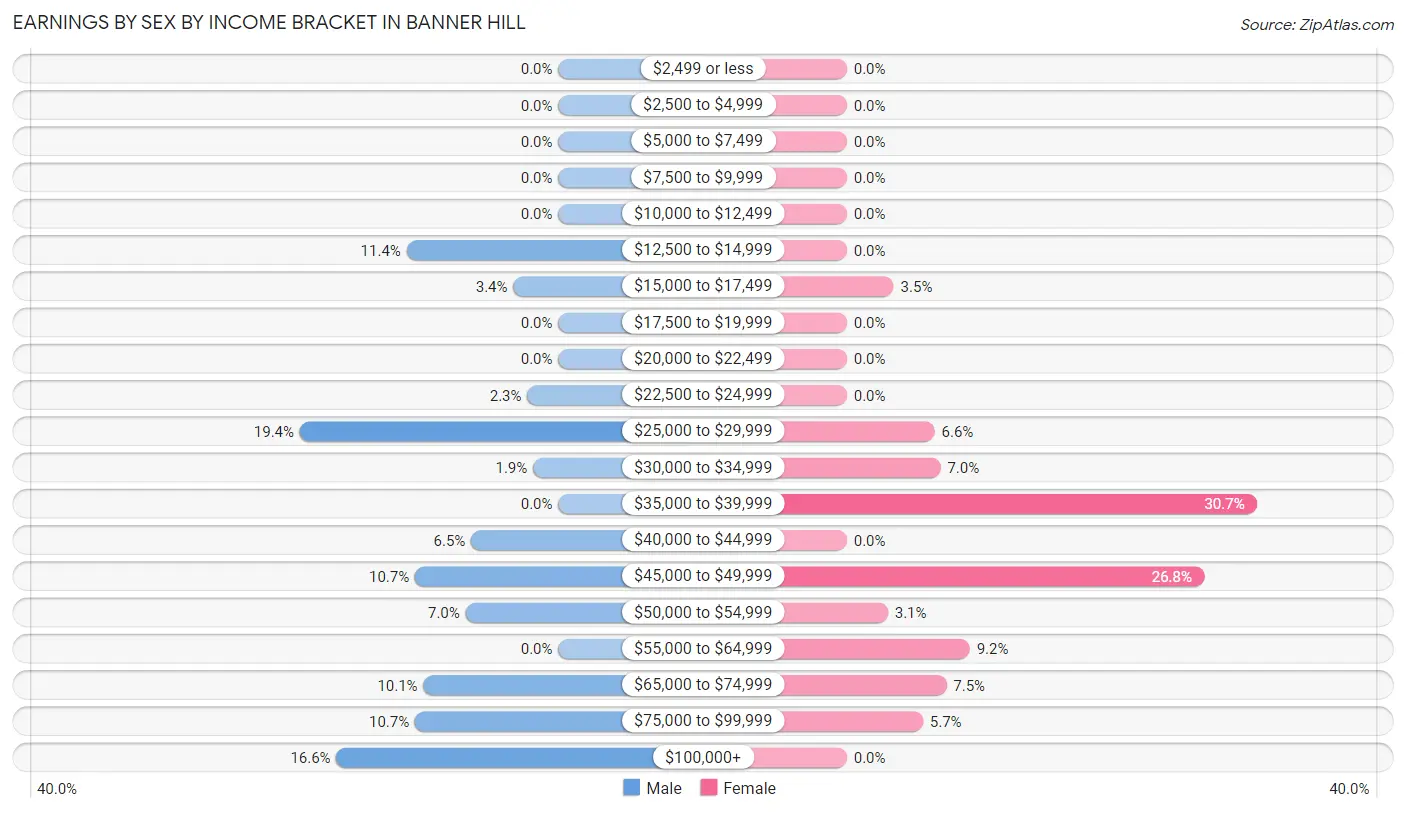
Earnings by Sex by Income Bracket in Banner Hill
The most common earnings brackets in Banner Hill are $25,000 to $29,999 for men (92 | 19.4%) and $35,000 to $39,999 for women (70 | 30.7%).
| Income | Male | Female |
| $2,499 or less | 0 (0.0%) | 0 (0.0%) |
| $2,500 to $4,999 | 0 (0.0%) | 0 (0.0%) |
| $5,000 to $7,499 | 0 (0.0%) | 0 (0.0%) |
| $7,500 to $9,999 | 0 (0.0%) | 0 (0.0%) |
| $10,000 to $12,499 | 0 (0.0%) | 0 (0.0%) |
| $12,500 to $14,999 | 54 (11.4%) | 0 (0.0%) |
| $15,000 to $17,499 | 16 (3.4%) | 8 (3.5%) |
| $17,500 to $19,999 | 0 (0.0%) | 0 (0.0%) |
| $20,000 to $22,499 | 0 (0.0%) | 0 (0.0%) |
| $22,500 to $24,999 | 11 (2.3%) | 0 (0.0%) |
| $25,000 to $29,999 | 92 (19.4%) | 15 (6.6%) |
| $30,000 to $34,999 | 9 (1.9%) | 16 (7.0%) |
| $35,000 to $39,999 | 0 (0.0%) | 70 (30.7%) |
| $40,000 to $44,999 | 31 (6.5%) | 0 (0.0%) |
| $45,000 to $49,999 | 51 (10.7%) | 61 (26.8%) |
| $50,000 to $54,999 | 33 (7.0%) | 7 (3.1%) |
| $55,000 to $64,999 | 0 (0.0%) | 21 (9.2%) |
| $65,000 to $74,999 | 48 (10.1%) | 17 (7.5%) |
| $75,000 to $99,999 | 51 (10.7%) | 13 (5.7%) |
| $100,000+ | 79 (16.6%) | 0 (0.0%) |
| Total | 475 (100.0%) | 228 (100.0%) |
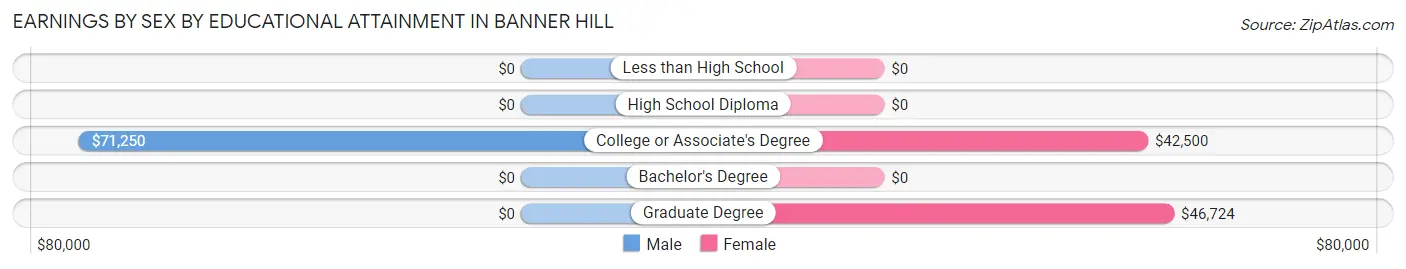
Earnings by Sex by Educational Attainment in Banner Hill
Average earnings in Banner Hill are $49,583 for men and $45,205 for women, a difference of 8.8%. Men with an educational attainment of college or associate's degree enjoy the highest average annual earnings of $71,250, while those with college or associate's degree education earn the least with $71,250. Women with an educational attainment of graduate degree earn the most with the average annual earnings of $46,724, while those with college or associate's degree education have the smallest earnings of $42,500.
| Educational Attainment | Male Income | Female Income |
| Less than High School | - | - |
| High School Diploma | - | - |
| College or Associate's Degree | $71,250 | $42,500 |
| Bachelor's Degree | - | - |
| Graduate Degree | - | - |
| Total | $49,583 | $45,205 |
Family Income in Banner Hill
Family Income Brackets in Banner Hill
According to the Banner Hill family income data, there are 109 families falling into the $100,000 to $149,999 income range, which is the most common income bracket and makes up 23.7% of all families.
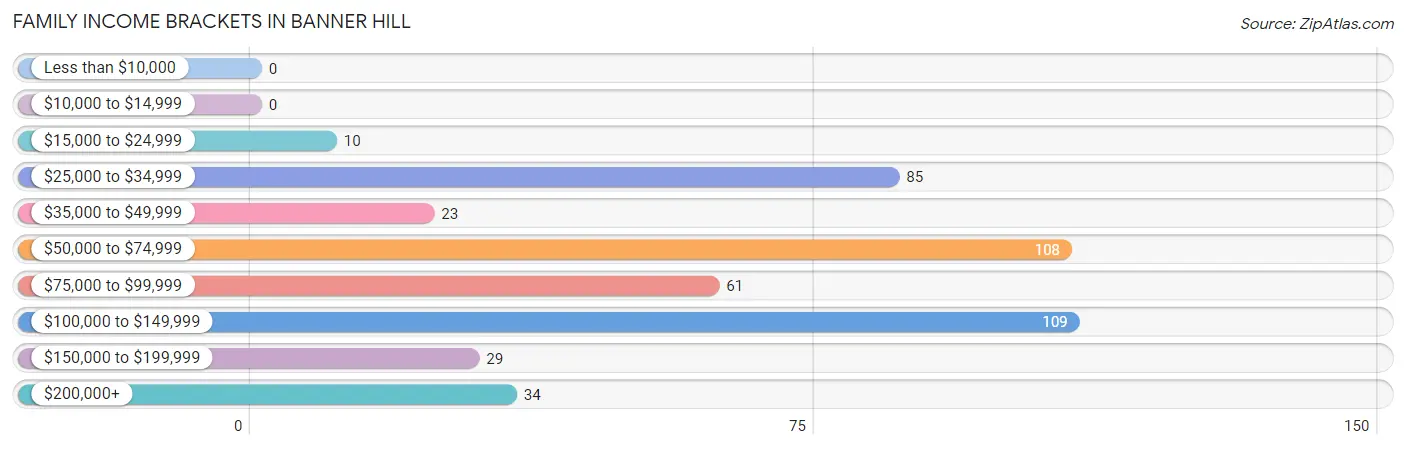
| Income Bracket | # Families | % Families |
| Less than $10,000 | 0 | 0.0% |
| $10,000 to $14,999 | 0 | 0.0% |
| $15,000 to $24,999 | 10 | 2.2% |
| $25,000 to $34,999 | 85 | 18.5% |
| $35,000 to $49,999 | 23 | 5.0% |
| $50,000 to $74,999 | 108 | 23.5% |
| $75,000 to $99,999 | 61 | 13.3% |
| $100,000 to $149,999 | 109 | 23.7% |
| $150,000 to $199,999 | 29 | 6.3% |
| $200,000+ | 34 | 7.4% |
Family Income by Famaliy Size in Banner Hill
2-person families (203 | 44.2%) account for the highest median family income in Banner Hill with $82,361 per family, while 2-person families (203 | 44.2%) have the highest median income of $41,180 per family member.
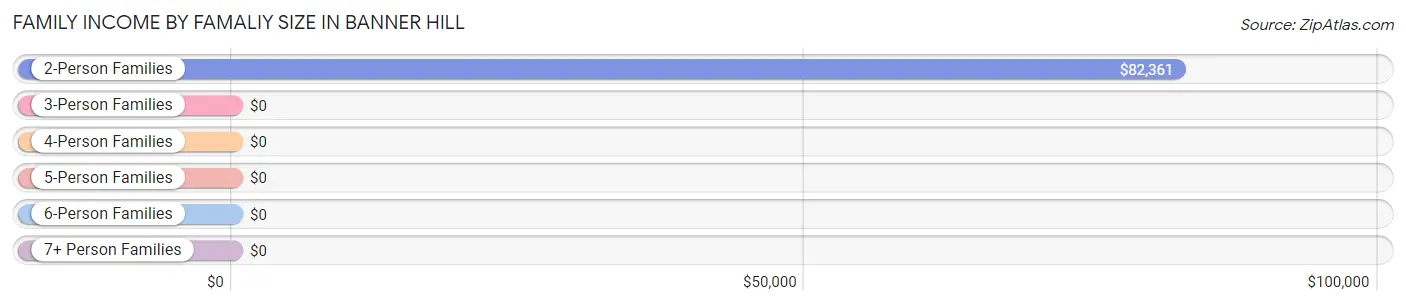
| Income Bracket | # Families | Median Income |
| 2-Person Families | 203 (44.2%) | $82,361 |
| 3-Person Families | 146 (31.8%) | $0 |
| 4-Person Families | 0 (0.0%) | $0 |
| 5-Person Families | 110 (24.0%) | $0 |
| 6-Person Families | 0 (0.0%) | $0 |
| 7+ Person Families | 0 (0.0%) | $0 |
| Total | 459 (100.0%) | $80,972 |
Family Income by Number of Earners in Banner Hill
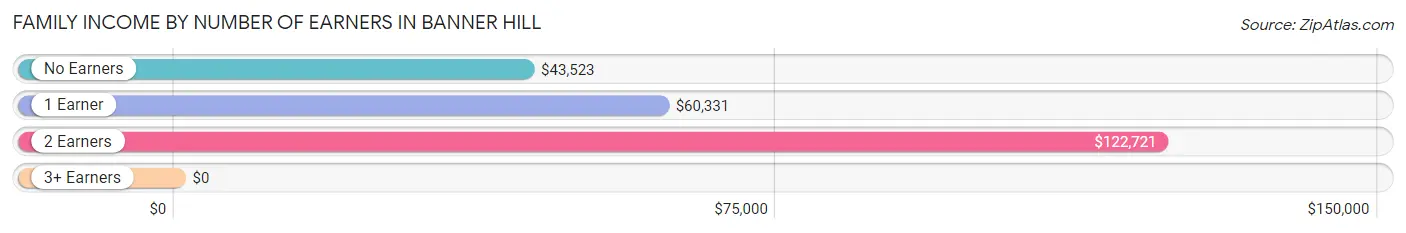
| Number of Earners | # Families | Median Income |
| No Earners | 29 (6.3%) | $43,523 |
| 1 Earner | 265 (57.7%) | $60,331 |
| 2 Earners | 165 (35.9%) | $122,721 |
| 3+ Earners | 0 (0.0%) | $0 |
| Total | 459 (100.0%) | $80,972 |
Household Income in Banner Hill
Household Income Brackets in Banner Hill
With 138 households falling in the category, the $100,000 to $149,999 income range is the most frequent in Banner Hill, accounting for 24.6% of all households.
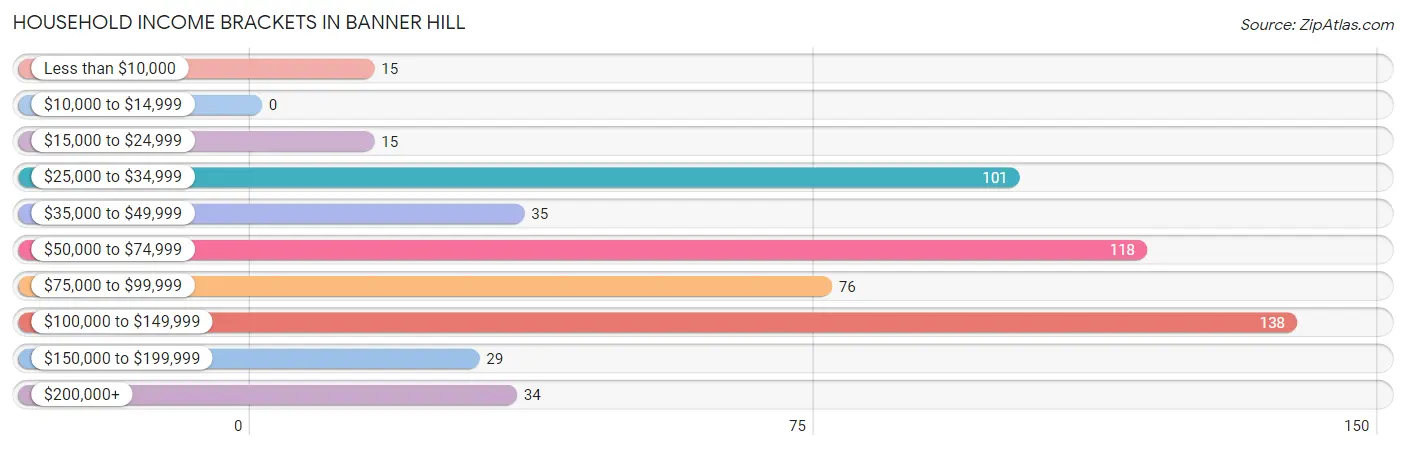
| Income Bracket | # Households | % Households |
| Less than $10,000 | 15 | 2.7% |
| $10,000 to $14,999 | 0 | 0.0% |
| $15,000 to $24,999 | 15 | 2.7% |
| $25,000 to $34,999 | 101 | 18.0% |
| $35,000 to $49,999 | 35 | 6.2% |
| $50,000 to $74,999 | 118 | 21.0% |
| $75,000 to $99,999 | 76 | 13.5% |
| $100,000 to $149,999 | 138 | 24.6% |
| $150,000 to $199,999 | 29 | 5.2% |
| $200,000+ | 34 | 6.1% |
Household Income by Householder Age in Banner Hill
The median household income in Banner Hill is $72,176, with the highest median household income of $80,278 found in the 65+ years age bracket for the primary householder. A total of 104 households (18.5%) fall into this category.
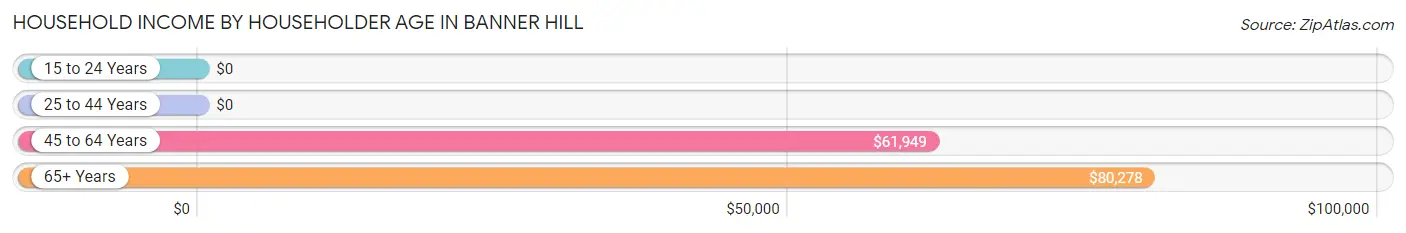
| Income Bracket | # Households | Median Income |
| 15 to 24 Years | 0 (0.0%) | $0 |
| 25 to 44 Years | 178 (31.7%) | $0 |
| 45 to 64 Years | 279 (49.7%) | $61,949 |
| 65+ Years | 104 (18.5%) | $80,278 |
| Total | 561 (100.0%) | $72,176 |
Poverty in Banner Hill
Income Below Poverty by Sex and Age in Banner Hill
With 22.9% poverty level for males and 26.6% for females among the residents of Banner Hill, 25 to 34 year old males and 6 to 11 year old females are the most vulnerable to poverty, with 92 males (64.3%) and 90 females (62.9%) in their respective age groups living below the poverty level.
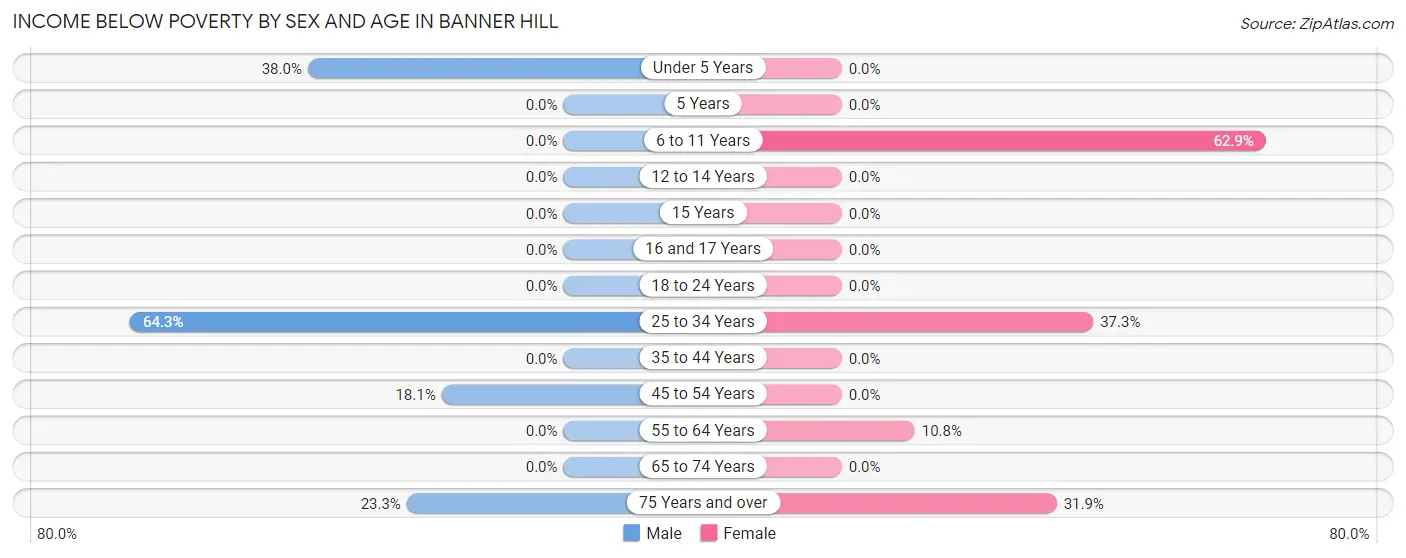
| Age Bracket | Male | Female |
| Under 5 Years | 52 (38.0%) | 0 (0.0%) |
| 5 Years | 0 (0.0%) | 0 (0.0%) |
| 6 to 11 Years | 0 (0.0%) | 90 (62.9%) |
| 12 to 14 Years | 0 (0.0%) | 0 (0.0%) |
| 15 Years | 0 (0.0%) | 0 (0.0%) |
| 16 and 17 Years | 0 (0.0%) | 0 (0.0%) |
| 18 to 24 Years | 0 (0.0%) | 0 (0.0%) |
| 25 to 34 Years | 92 (64.3%) | 59 (37.3%) |
| 35 to 44 Years | 0 (0.0%) | 0 (0.0%) |
| 45 to 54 Years | 19 (18.1%) | 0 (0.0%) |
| 55 to 64 Years | 0 (0.0%) | 18 (10.8%) |
| 65 to 74 Years | 0 (0.0%) | 0 (0.0%) |
| 75 Years and over | 10 (23.3%) | 15 (31.9%) |
| Total | 173 (22.9%) | 182 (26.6%) |
Income Above Poverty by Sex and Age in Banner Hill
According to the poverty statistics in Banner Hill, males aged 12 to 14 years and females aged 5 years are the age groups that are most secure financially, with 100.0% of males and 100.0% of females in these age groups living above the poverty line.
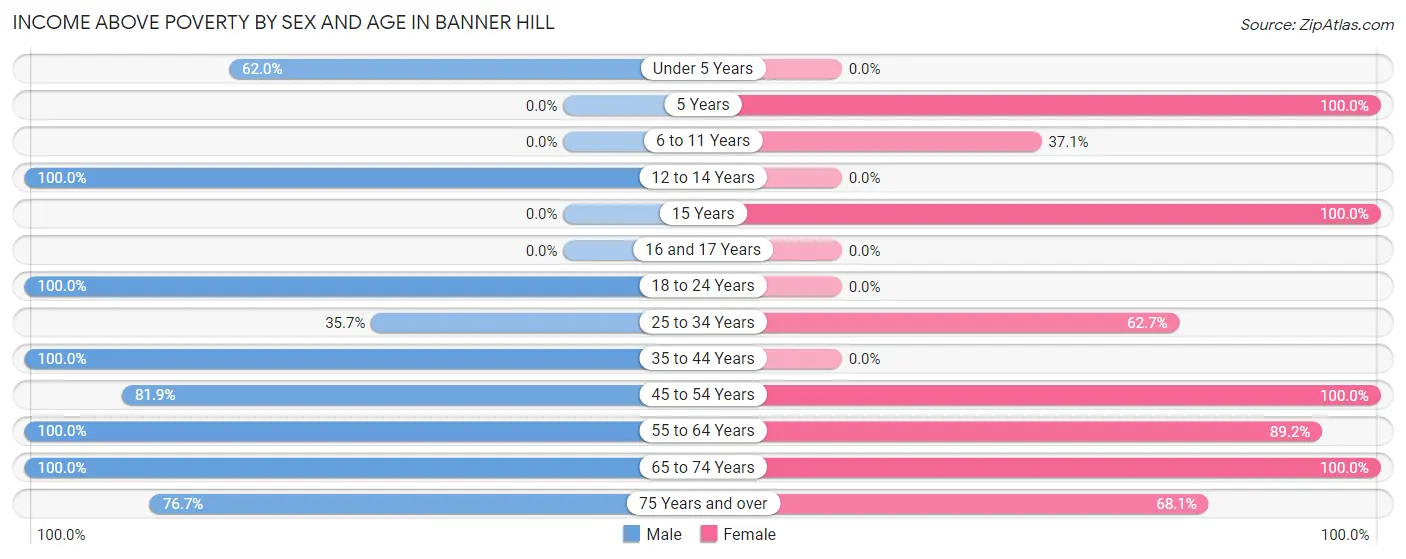
| Age Bracket | Male | Female |
| Under 5 Years | 85 (62.0%) | 0 (0.0%) |
| 5 Years | 0 (0.0%) | 16 (100.0%) |
| 6 to 11 Years | 0 (0.0%) | 53 (37.1%) |
| 12 to 14 Years | 30 (100.0%) | 0 (0.0%) |
| 15 Years | 0 (0.0%) | 38 (100.0%) |
| 16 and 17 Years | 0 (0.0%) | 0 (0.0%) |
| 18 to 24 Years | 36 (100.0%) | 0 (0.0%) |
| 25 to 34 Years | 51 (35.7%) | 99 (62.7%) |
| 35 to 44 Years | 85 (100.0%) | 0 (0.0%) |
| 45 to 54 Years | 86 (81.9%) | 66 (100.0%) |
| 55 to 64 Years | 134 (100.0%) | 148 (89.2%) |
| 65 to 74 Years | 42 (100.0%) | 51 (100.0%) |
| 75 Years and over | 33 (76.7%) | 32 (68.1%) |
| Total | 582 (77.1%) | 503 (73.4%) |
Income Below Poverty Among Married-Couple Families in Banner Hill
The poverty statistics for married-couple families in Banner Hill show that 17.1% or 69 of the total 403 families live below the poverty line. Families with 3 or 4 children have the highest poverty rate of 53.6%, comprising of 59 families. On the other hand, families with 1 or 2 children have the lowest poverty rate of 0.0%, which includes 0 families.
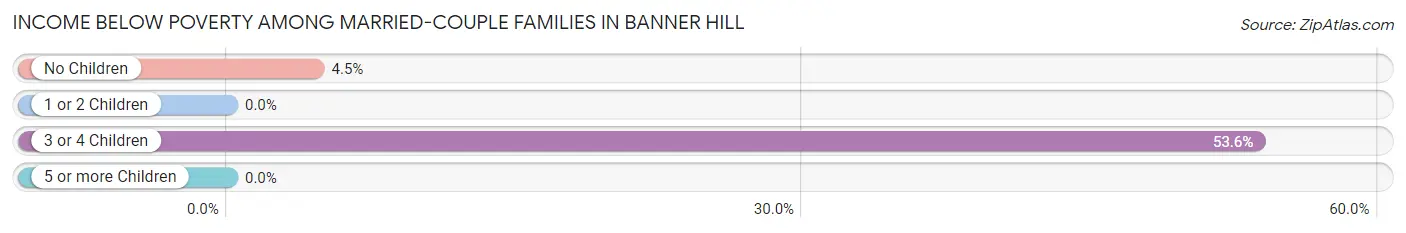
| Children | Above Poverty | Below Poverty |
| No Children | 211 (95.5%) | 10 (4.5%) |
| 1 or 2 Children | 72 (100.0%) | 0 (0.0%) |
| 3 or 4 Children | 51 (46.4%) | 59 (53.6%) |
| 5 or more Children | 0 (0.0%) | 0 (0.0%) |
| Total | 334 (82.9%) | 69 (17.1%) |
Income Below Poverty Among Single-Parent Households in Banner Hill
| Children | Single Father | Single Mother |
| No Children | 0 (0.0%) | 0 (0.0%) |
| 1 or 2 Children | 0 (0.0%) | 0 (0.0%) |
| 3 or 4 Children | 0 (0.0%) | 0 (0.0%) |
| 5 or more Children | 0 (0.0%) | 0 (0.0%) |
| Total | 0 (0.0%) | 0 (0.0%) |
Income Below Poverty Among Married-Couple vs Single-Parent Households in Banner Hill
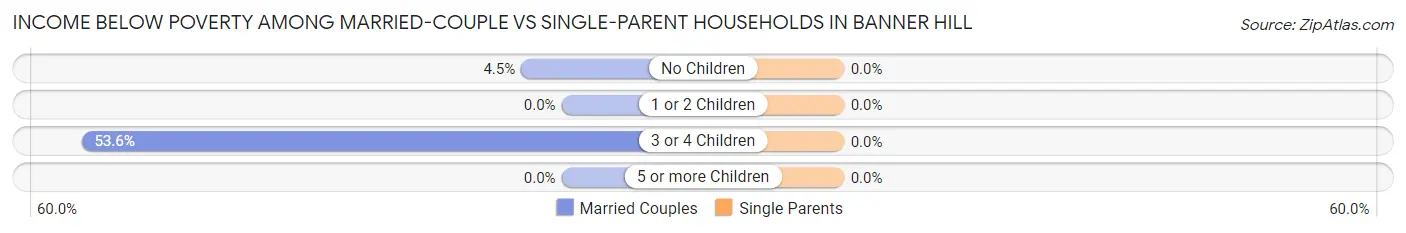
| Children | Married-Couple Families | Single-Parent Households |
| No Children | 10 (4.5%) | 0 (0.0%) |
| 1 or 2 Children | 0 (0.0%) | 0 (0.0%) |
| 3 or 4 Children | 59 (53.6%) | 0 (0.0%) |
| 5 or more Children | 0 (0.0%) | 0 (0.0%) |
| Total | 69 (17.1%) | 0 (0.0%) |
Race in Banner Hill
The most populous races in Banner Hill are White / Caucasian (1,546 | 98.4%), Two or more Races (19 | 1.2%), and Black / African American (6 | 0.4%).
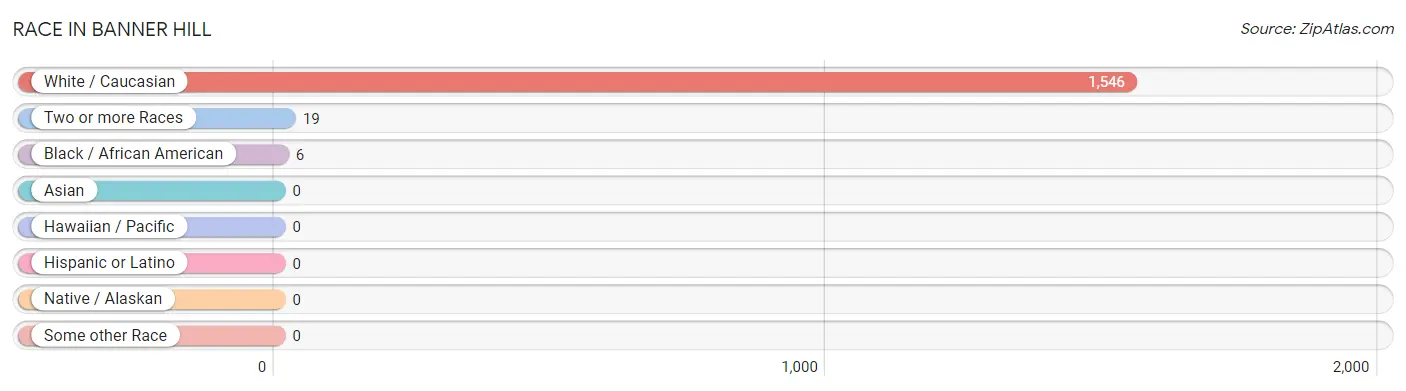
| Race | # Population | % Population |
| Asian | 0 | 0.0% |
| Black / African American | 6 | 0.4% |
| Hawaiian / Pacific | 0 | 0.0% |
| Hispanic or Latino | 0 | 0.0% |
| Native / Alaskan | 0 | 0.0% |
| White / Caucasian | 1,546 | 98.4% |
| Two or more Races | 19 | 1.2% |
| Some other Race | 0 | 0.0% |
| Total | 1,571 | 100.0% |
Ancestry in Banner Hill
The most populous ancestries reported in Banner Hill are American (393 | 25.0%), English (234 | 14.9%), Irish (176 | 11.2%), German (109 | 6.9%), and European (29 | 1.8%), together accounting for 59.9% of all Banner Hill residents.
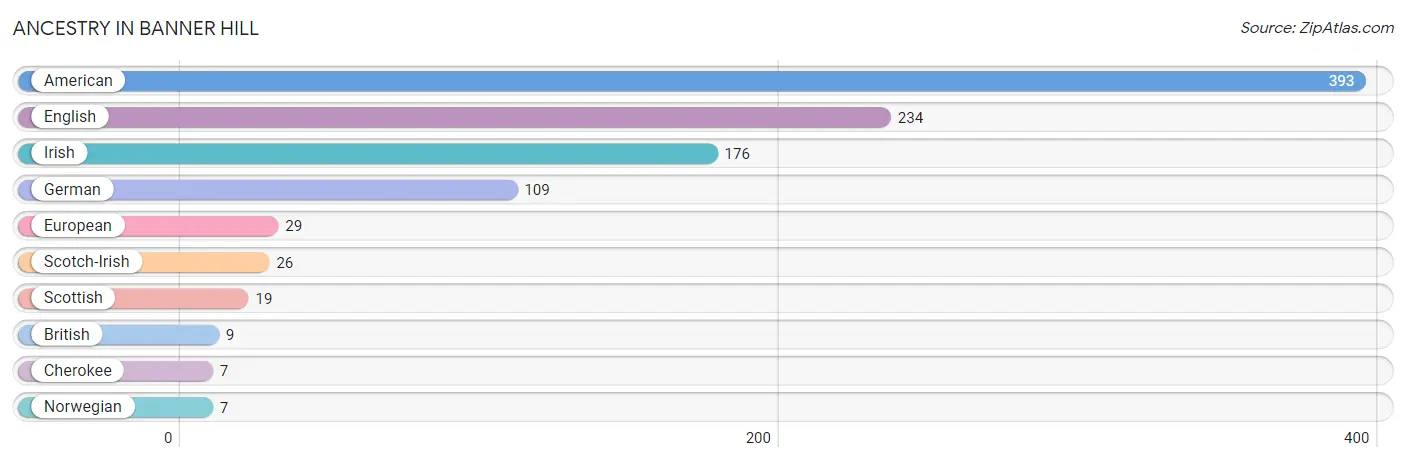
| Ancestry | # Population | % Population |
| American | 393 | 25.0% |
| British | 9 | 0.6% |
| Cherokee | 7 | 0.4% |
| English | 234 | 14.9% |
| European | 29 | 1.8% |
| German | 109 | 6.9% |
| Irish | 176 | 11.2% |
| Norwegian | 7 | 0.4% |
| Scotch-Irish | 26 | 1.7% |
| Scottish | 19 | 1.2% | View All 10 Rows |
Immigrants in Banner Hill

| Immigration Origin | # Population | % Population | View All 0 Rows |
Sex and Age in Banner Hill
Sex and Age in Banner Hill
The most populous age groups in Banner Hill are 30 to 34 Years (143 | 17.8%) for men and 30 to 34 Years (108 | 14.0%) for women.
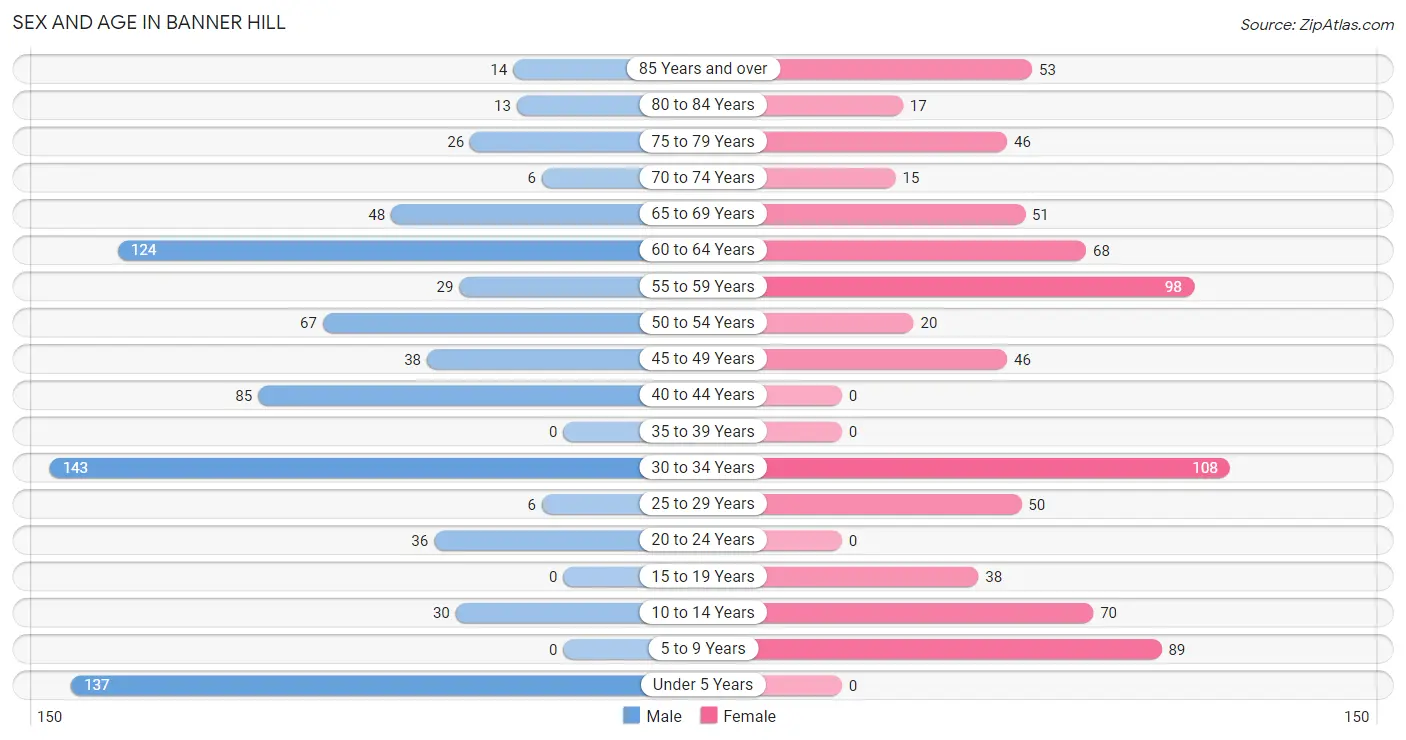
| Age Bracket | Male | Female |
| Under 5 Years | 137 (17.1%) | 0 (0.0%) |
| 5 to 9 Years | 0 (0.0%) | 89 (11.6%) |
| 10 to 14 Years | 30 (3.7%) | 70 (9.1%) |
| 15 to 19 Years | 0 (0.0%) | 38 (4.9%) |
| 20 to 24 Years | 36 (4.5%) | 0 (0.0%) |
| 25 to 29 Years | 6 (0.7%) | 50 (6.5%) |
| 30 to 34 Years | 143 (17.8%) | 108 (14.0%) |
| 35 to 39 Years | 0 (0.0%) | 0 (0.0%) |
| 40 to 44 Years | 85 (10.6%) | 0 (0.0%) |
| 45 to 49 Years | 38 (4.7%) | 46 (6.0%) |
| 50 to 54 Years | 67 (8.4%) | 20 (2.6%) |
| 55 to 59 Years | 29 (3.6%) | 98 (12.7%) |
| 60 to 64 Years | 124 (15.5%) | 68 (8.8%) |
| 65 to 69 Years | 48 (6.0%) | 51 (6.6%) |
| 70 to 74 Years | 6 (0.7%) | 15 (1.9%) |
| 75 to 79 Years | 26 (3.2%) | 46 (6.0%) |
| 80 to 84 Years | 13 (1.6%) | 17 (2.2%) |
| 85 Years and over | 14 (1.8%) | 53 (6.9%) |
| Total | 802 (100.0%) | 769 (100.0%) |
Families and Households in Banner Hill
Median Family Size in Banner Hill
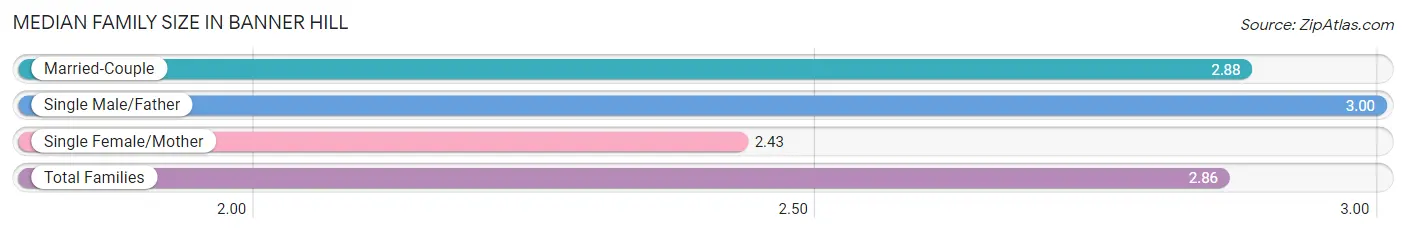
The median family size in Banner Hill is 2.86 persons per family, with single male/father families (26 | 5.7%) accounting for the largest median family size of 3 persons per family. On the other hand, single female/mother families (30 | 6.5%) represent the smallest median family size with 2.43 persons per family.
| Family Type | # Families | Family Size |
| Married-Couple | 403 (87.8%) | 2.88 |
| Single Male/Father | 26 (5.7%) | 3.00 |
| Single Female/Mother | 30 (6.5%) | 2.43 |
| Total Families | 459 (100.0%) | 2.86 |
Median Household Size in Banner Hill
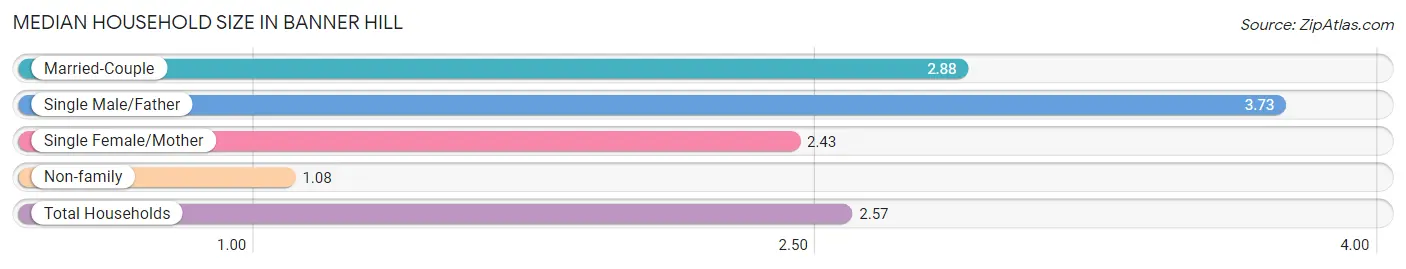
The median household size in Banner Hill is 2.57 persons per household, with single male/father households (26 | 4.6%) accounting for the largest median household size of 3.73 persons per household. non-family households (102 | 18.2%) represent the smallest median household size with 1.08 persons per household.
| Household Type | # Households | Household Size |
| Married-Couple | 403 (71.8%) | 2.88 |
| Single Male/Father | 26 (4.6%) | 3.73 |
| Single Female/Mother | 30 (5.3%) | 2.43 |
| Non-family | 102 (18.2%) | 1.08 |
| Total Households | 561 (100.0%) | 2.57 |
Household Size by Marriage Status in Banner Hill
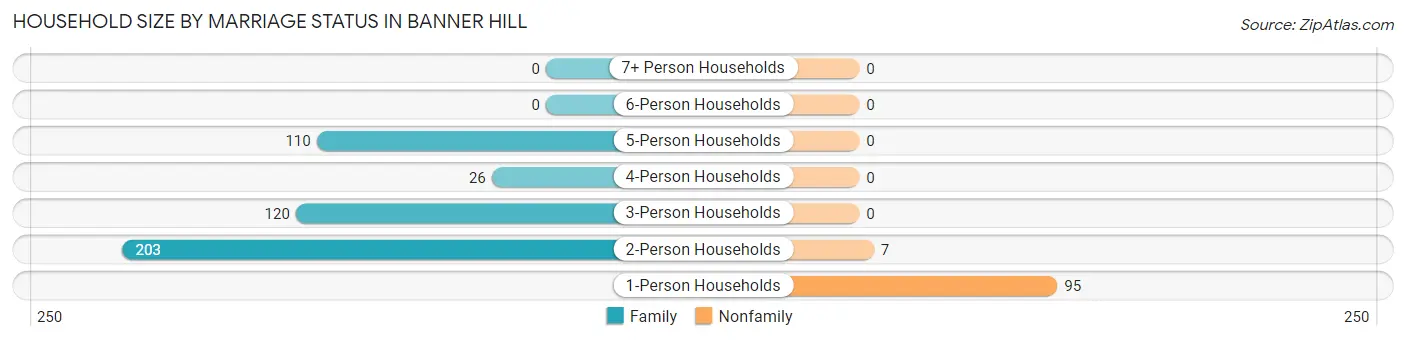
Out of a total of 561 households in Banner Hill, 459 (81.8%) are family households, while 102 (18.2%) are nonfamily households. The most numerous type of family households are 2-person households, comprising 203, and the most common type of nonfamily households are 1-person households, comprising 95.
| Household Size | Family Households | Nonfamily Households |
| 1-Person Households | - | 95 (16.9%) |
| 2-Person Households | 203 (36.2%) | 7 (1.3%) |
| 3-Person Households | 120 (21.4%) | 0 (0.0%) |
| 4-Person Households | 26 (4.6%) | 0 (0.0%) |
| 5-Person Households | 110 (19.6%) | 0 (0.0%) |
| 6-Person Households | 0 (0.0%) | 0 (0.0%) |
| 7+ Person Households | 0 (0.0%) | 0 (0.0%) |
| Total | 459 (81.8%) | 102 (18.2%) |
Female Fertility in Banner Hill
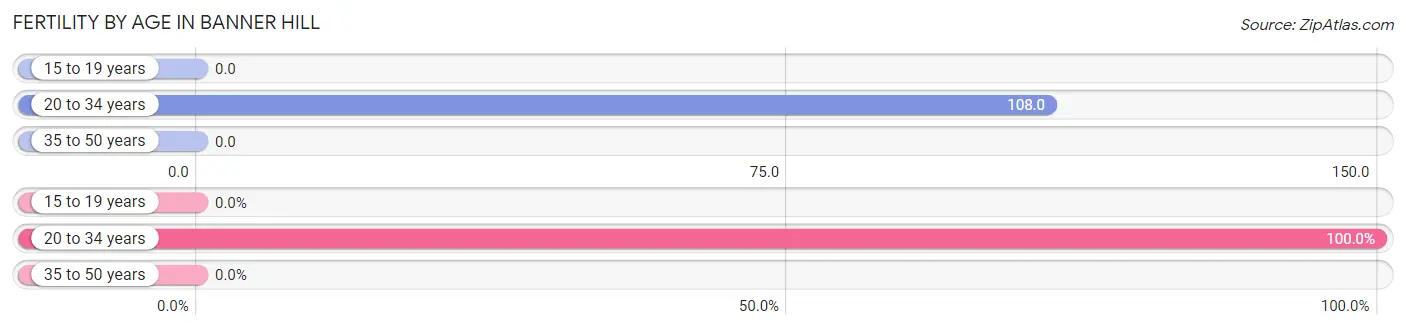
Fertility by Age in Banner Hill
Average fertility rate in Banner Hill is 70.0 births per 1,000 women. Women in the age bracket of 20 to 34 years have the highest fertility rate with 108.0 births per 1,000 women. Women in the age bracket of 20 to 34 years acount for 100.0% of all women with births.
| Age Bracket | Women with Births | Births / 1,000 Women |
| 15 to 19 years | 0 (0.0%) | 0.0 |
| 20 to 34 years | 17 (100.0%) | 108.0 |
| 35 to 50 years | 0 (0.0%) | 0.0 |
| Total | 17 (100.0%) | 70.0 |
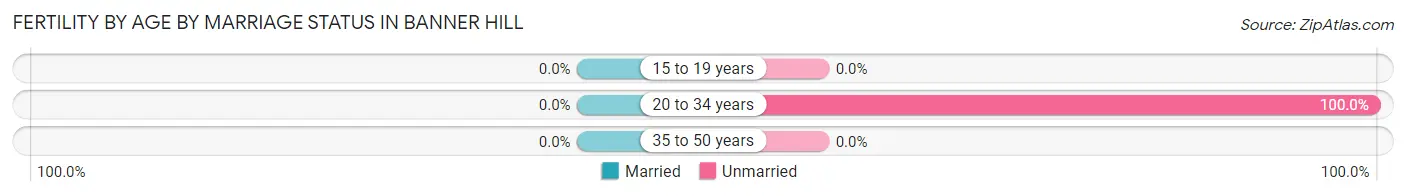
Fertility by Age by Marriage Status in Banner Hill
| Age Bracket | Married | Unmarried |
| 15 to 19 years | 0 (0.0%) | 0 (0.0%) |
| 20 to 34 years | 0 (0.0%) | 17 (100.0%) |
| 35 to 50 years | 0 (0.0%) | 0 (0.0%) |
| Total | 0 (0.0%) | 17 (100.0%) |
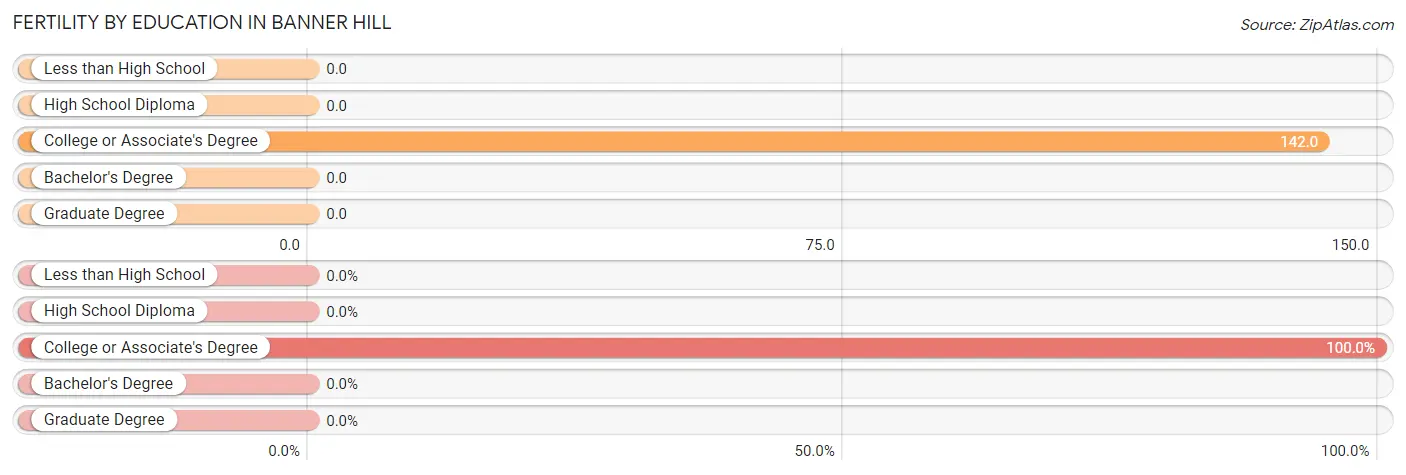
Fertility by Education in Banner Hill
| Educational Attainment | Women with Births | Births / 1,000 Women |
| Less than High School | 0 (0.0%) | 0.0 |
| High School Diploma | 0 (0.0%) | 0.0 |
| College or Associate's Degree | 17 (100.0%) | 142.0 |
| Bachelor's Degree | 0 (0.0%) | 0.0 |
| Graduate Degree | 0 (0.0%) | 0.0 |
| Total | 17 (100.0%) | 70.0 |
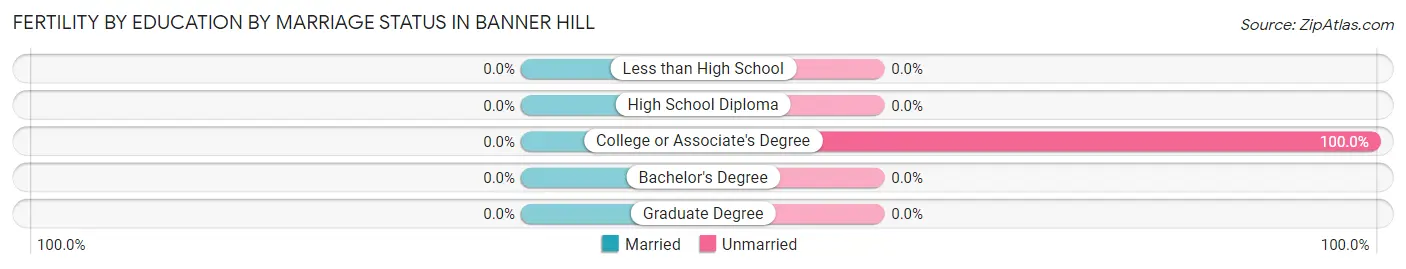
Fertility by Education by Marriage Status in Banner Hill
| Educational Attainment | Married | Unmarried |
| Less than High School | 0 (0.0%) | 0 (0.0%) |
| High School Diploma | 0 (0.0%) | 0 (0.0%) |
| College or Associate's Degree | 0 (0.0%) | 17 (100.0%) |
| Bachelor's Degree | 0 (0.0%) | 0 (0.0%) |
| Graduate Degree | 0 (0.0%) | 0 (0.0%) |
| Total | 0 (0.0%) | 17 (100.0%) |
Employment Characteristics in Banner Hill
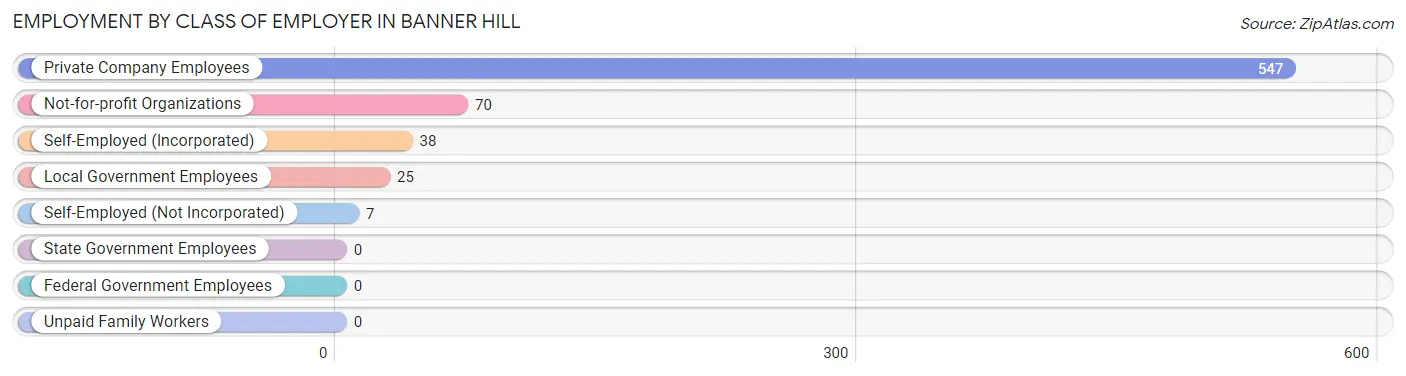
Employment by Class of Employer in Banner Hill
Among the 687 employed individuals in Banner Hill, private company employees (547 | 79.6%), not-for-profit organizations (70 | 10.2%), and self-employed (incorporated) (38 | 5.5%) make up the most common classes of employment.
| Employer Class | # Employees | % Employees |
| Private Company Employees | 547 | 79.6% |
| Self-Employed (Incorporated) | 38 | 5.5% |
| Self-Employed (Not Incorporated) | 7 | 1.0% |
| Not-for-profit Organizations | 70 | 10.2% |
| Local Government Employees | 25 | 3.6% |
| State Government Employees | 0 | 0.0% |
| Federal Government Employees | 0 | 0.0% |
| Unpaid Family Workers | 0 | 0.0% |
| Total | 687 | 100.0% |
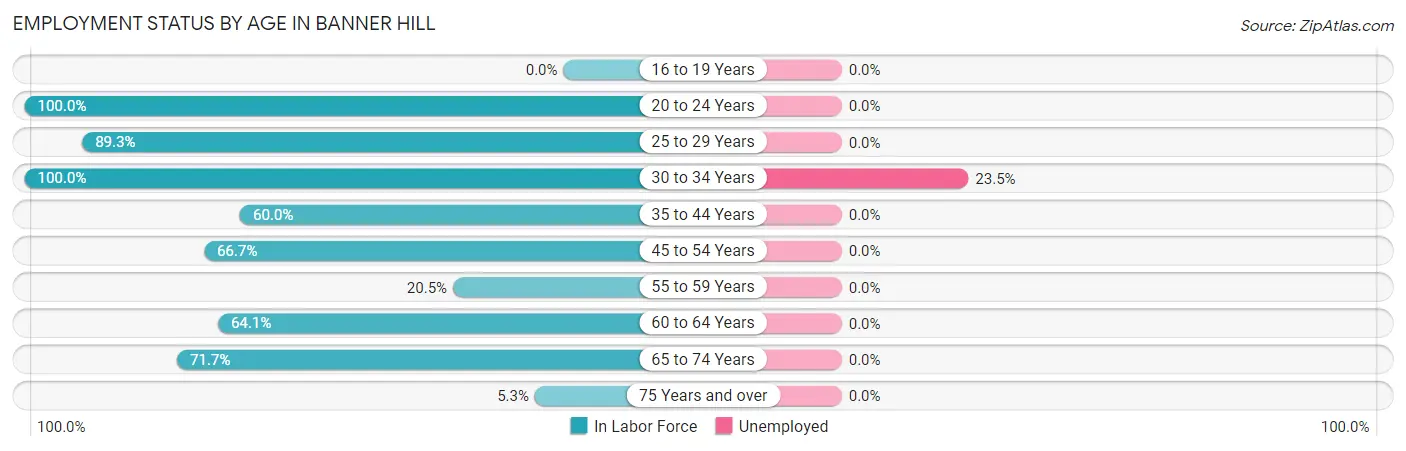
Employment Status by Age in Banner Hill
According to the labor force statistics for Banner Hill, out of the total population over 16 years of age (1,207), 61.8% or 746 individuals are in the labor force, with 7.9% or 59 of them unemployed. The age group with the highest labor force participation rate is 20 to 24 years, with 100.0% or 36 individuals in the labor force. Within the labor force, the 30 to 34 years age range has the highest percentage of unemployed individuals, with 23.5% or 59 of them being unemployed.
| Age Bracket | In Labor Force | Unemployed |
| 16 to 19 Years | 0 (0.0%) | 0 (0.0%) |
| 20 to 24 Years | 36 (100.0%) | 0 (0.0%) |
| 25 to 29 Years | 50 (89.3%) | 0 (0.0%) |
| 30 to 34 Years | 251 (100.0%) | 59 (23.5%) |
| 35 to 44 Years | 51 (60.0%) | 0 (0.0%) |
| 45 to 54 Years | 114 (66.7%) | 0 (0.0%) |
| 55 to 59 Years | 26 (20.5%) | 0 (0.0%) |
| 60 to 64 Years | 123 (64.1%) | 0 (0.0%) |
| 65 to 74 Years | 86 (71.7%) | 0 (0.0%) |
| 75 Years and over | 9 (5.3%) | 0 (0.0%) |
| Total | 746 (61.8%) | 59 (7.9%) |
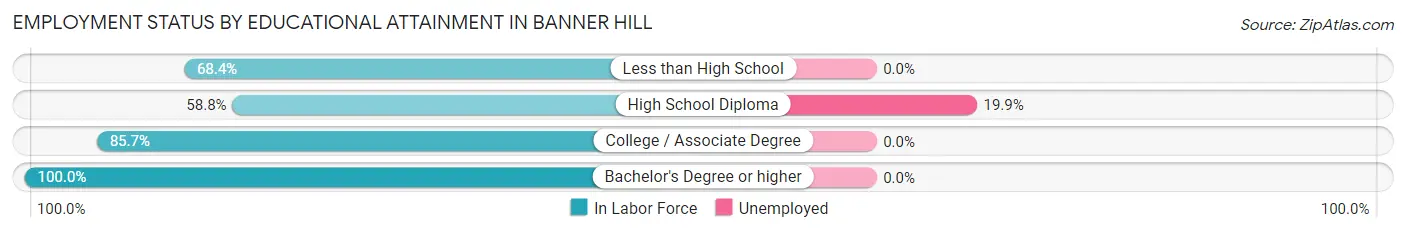
Employment Status by Educational Attainment in Banner Hill
According to labor force statistics for Banner Hill, 69.7% of individuals (615) out of the total population between 25 and 64 years of age (882) are in the labor force, with 9.6% or 59 of them being unemployed. The group with the highest labor force participation rate are those with the educational attainment of bachelor's degree or higher, with 100.0% or 28 individuals in the labor force. Within the labor force, individuals with high school diploma education have the highest percentage of unemployment, with 19.9% or 59 of them being unemployed.
| Educational Attainment | In Labor Force | Unemployed |
| Less than High School | 39 (68.4%) | 0 (0.0%) |
| High School Diploma | 296 (58.8%) | 100 (19.9%) |
| College / Associate Degree | 252 (85.7%) | 0 (0.0%) |
| Bachelor's Degree or higher | 28 (100.0%) | 0 (0.0%) |
| Total | 615 (69.7%) | 85 (9.6%) |
Employment Occupations by Sex in Banner Hill
Management, Business, Science and Arts Occupations
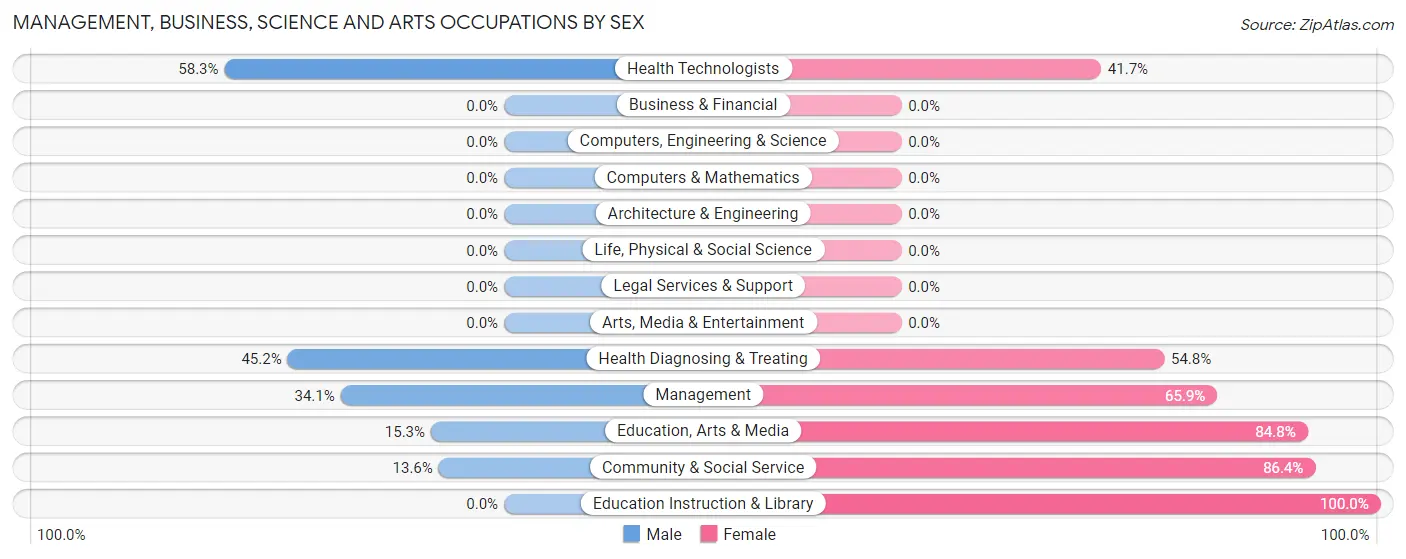
The most common Management, Business, Science and Arts occupations in Banner Hill are Health Diagnosing & Treating (93 | 13.5%), Health Technologists (72 | 10.5%), Community & Social Service (66 | 9.6%), Education, Arts & Media (59 | 8.6%), and Management (44 | 6.4%).
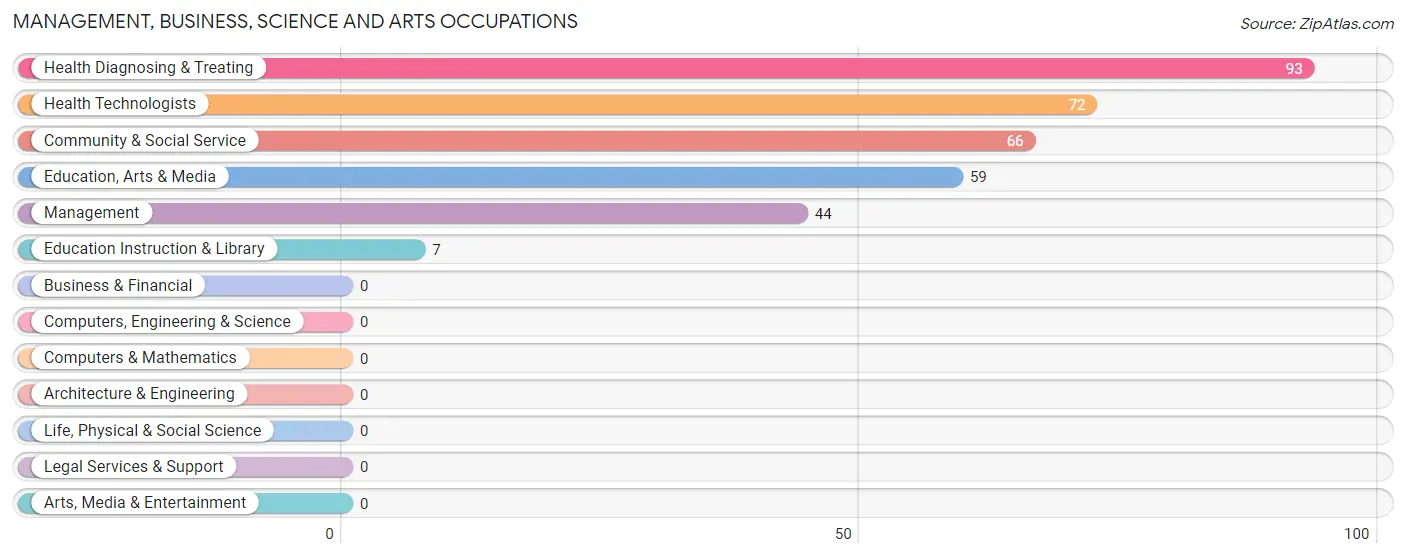
Management, Business, Science and Arts Occupations by Sex
Within the Management, Business, Science and Arts occupations in Banner Hill, the most male-oriented occupations are Health Technologists (58.3%), Health Diagnosing & Treating (45.2%), and Management (34.1%), while the most female-oriented occupations are Education Instruction & Library (100.0%), Community & Social Service (86.4%), and Education, Arts & Media (84.8%).
| Occupation | Male | Female |
| Management | 15 (34.1%) | 29 (65.9%) |
| Business & Financial | 0 (0.0%) | 0 (0.0%) |
| Computers, Engineering & Science | 0 (0.0%) | 0 (0.0%) |
| Computers & Mathematics | 0 (0.0%) | 0 (0.0%) |
| Architecture & Engineering | 0 (0.0%) | 0 (0.0%) |
| Life, Physical & Social Science | 0 (0.0%) | 0 (0.0%) |
| Community & Social Service | 9 (13.6%) | 57 (86.4%) |
| Education, Arts & Media | 9 (15.2%) | 50 (84.8%) |
| Legal Services & Support | 0 (0.0%) | 0 (0.0%) |
| Education Instruction & Library | 0 (0.0%) | 7 (100.0%) |
| Arts, Media & Entertainment | 0 (0.0%) | 0 (0.0%) |
| Health Diagnosing & Treating | 42 (45.2%) | 51 (54.8%) |
| Health Technologists | 42 (58.3%) | 30 (41.7%) |
| Total (Category) | 66 (32.5%) | 137 (67.5%) |
| Total (Overall) | 475 (69.1%) | 212 (30.9%) |
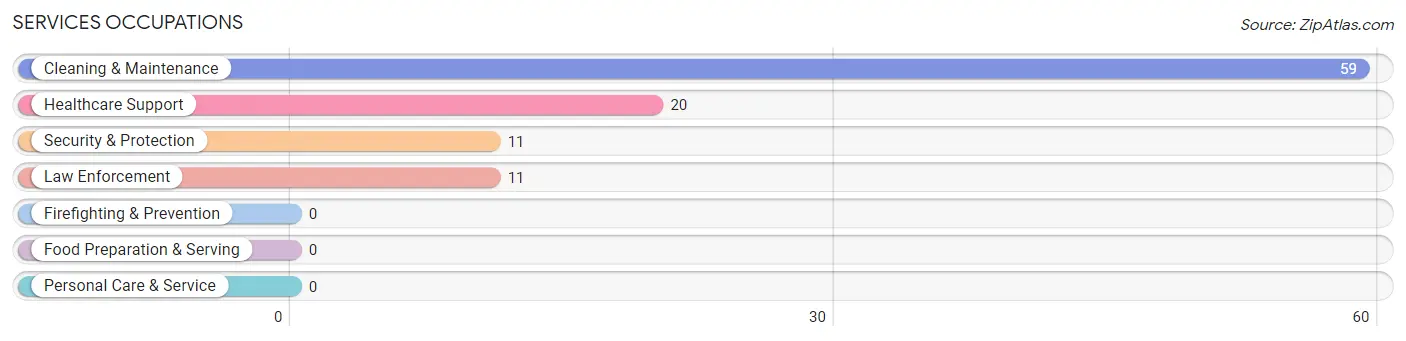
Services Occupations
The most common Services occupations in Banner Hill are Cleaning & Maintenance (59 | 8.6%), Healthcare Support (20 | 2.9%), Security & Protection (11 | 1.6%), and Law Enforcement (11 | 1.6%).
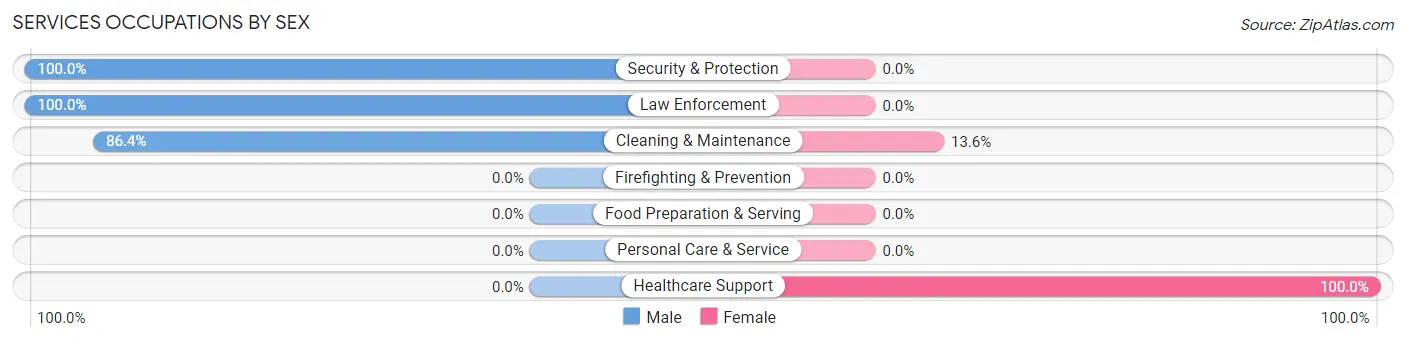
Services Occupations by Sex
Within the Services occupations in Banner Hill, the most male-oriented occupations are Security & Protection (100.0%), Law Enforcement (100.0%), and Cleaning & Maintenance (86.4%), while the most female-oriented occupations are Healthcare Support (100.0%), and Cleaning & Maintenance (13.6%).
| Occupation | Male | Female |
| Healthcare Support | 0 (0.0%) | 20 (100.0%) |
| Security & Protection | 11 (100.0%) | 0 (0.0%) |
| Firefighting & Prevention | 0 (0.0%) | 0 (0.0%) |
| Law Enforcement | 11 (100.0%) | 0 (0.0%) |
| Food Preparation & Serving | 0 (0.0%) | 0 (0.0%) |
| Cleaning & Maintenance | 51 (86.4%) | 8 (13.6%) |
| Personal Care & Service | 0 (0.0%) | 0 (0.0%) |
| Total (Category) | 62 (68.9%) | 28 (31.1%) |
| Total (Overall) | 475 (69.1%) | 212 (30.9%) |
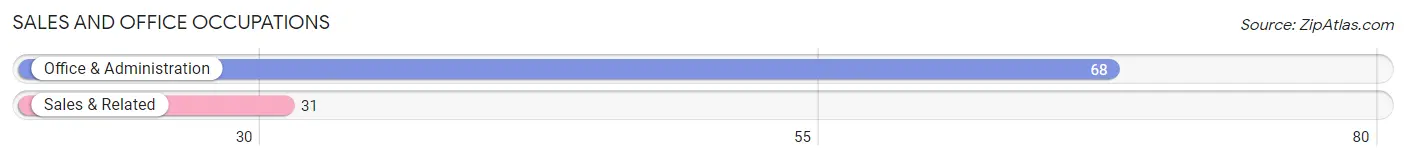
Sales and Office Occupations
The most common Sales and Office occupations in Banner Hill are Office & Administration (68 | 9.9%), and Sales & Related (31 | 4.5%).
Sales and Office Occupations by Sex
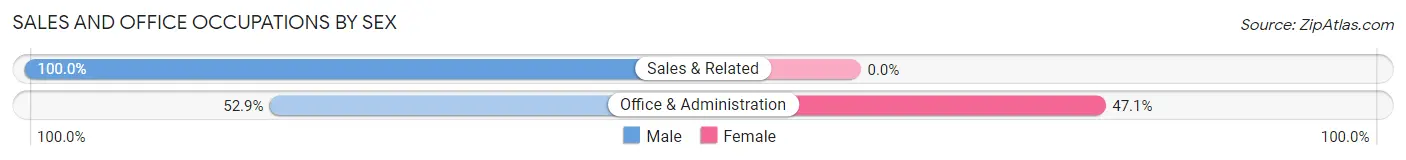
| Occupation | Male | Female |
| Sales & Related | 31 (100.0%) | 0 (0.0%) |
| Office & Administration | 36 (52.9%) | 32 (47.1%) |
| Total (Category) | 67 (67.7%) | 32 (32.3%) |
| Total (Overall) | 475 (69.1%) | 212 (30.9%) |
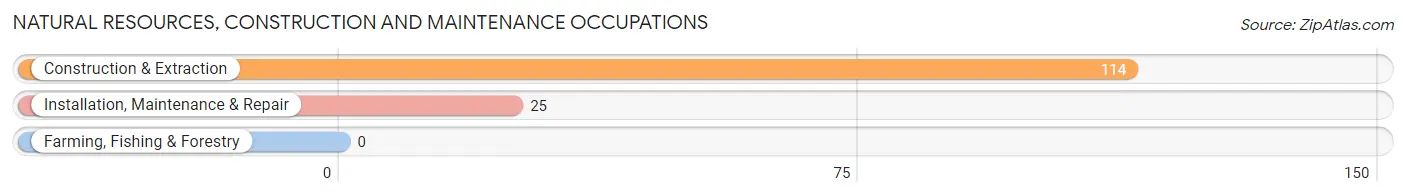
Natural Resources, Construction and Maintenance Occupations
The most common Natural Resources, Construction and Maintenance occupations in Banner Hill are Construction & Extraction (114 | 16.6%), and Installation, Maintenance & Repair (25 | 3.6%).
Natural Resources, Construction and Maintenance Occupations by Sex
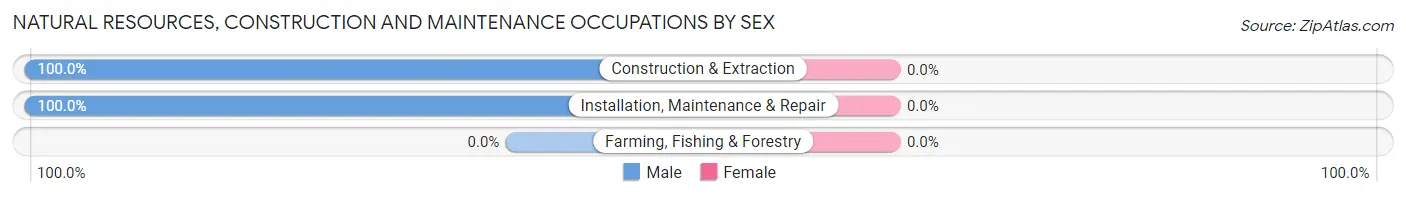
| Occupation | Male | Female |
| Farming, Fishing & Forestry | 0 (0.0%) | 0 (0.0%) |
| Construction & Extraction | 114 (100.0%) | 0 (0.0%) |
| Installation, Maintenance & Repair | 25 (100.0%) | 0 (0.0%) |
| Total (Category) | 139 (100.0%) | 0 (0.0%) |
| Total (Overall) | 475 (69.1%) | 212 (30.9%) |
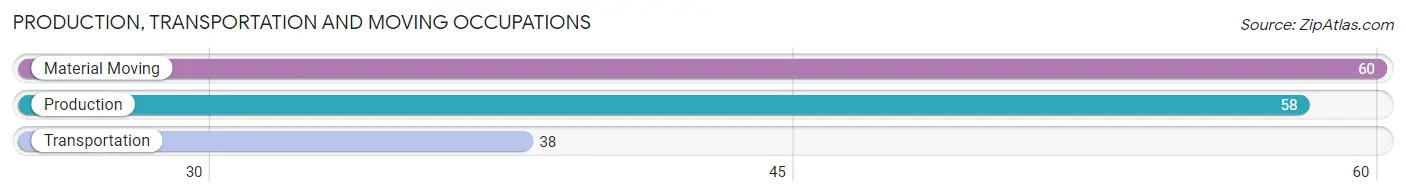
Production, Transportation and Moving Occupations
The most common Production, Transportation and Moving occupations in Banner Hill are Material Moving (60 | 8.7%), Production (58 | 8.4%), and Transportation (38 | 5.5%).
Production, Transportation and Moving Occupations by Sex
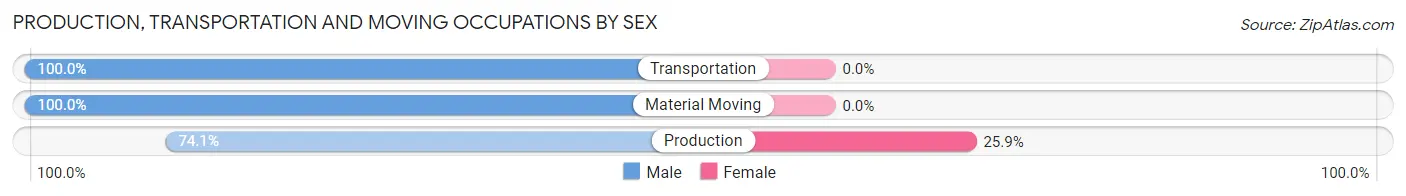
| Occupation | Male | Female |
| Production | 43 (74.1%) | 15 (25.9%) |
| Transportation | 38 (100.0%) | 0 (0.0%) |
| Material Moving | 60 (100.0%) | 0 (0.0%) |
| Total (Category) | 141 (90.4%) | 15 (9.6%) |
| Total (Overall) | 475 (69.1%) | 212 (30.9%) |
Employment Industries by Sex in Banner Hill
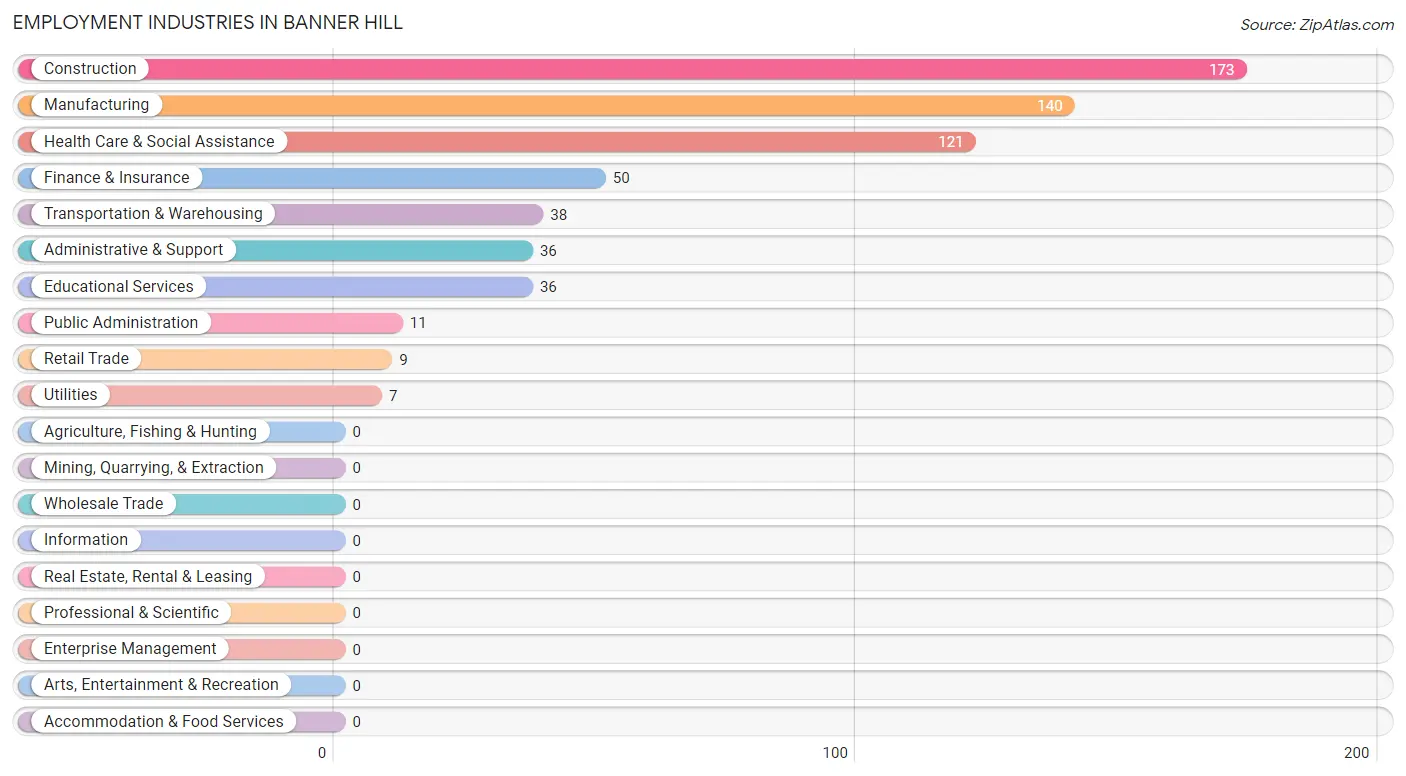
Employment Industries in Banner Hill
The major employment industries in Banner Hill include Construction (173 | 25.2%), Manufacturing (140 | 20.4%), Health Care & Social Assistance (121 | 17.6%), Finance & Insurance (50 | 7.3%), and Transportation & Warehousing (38 | 5.5%).
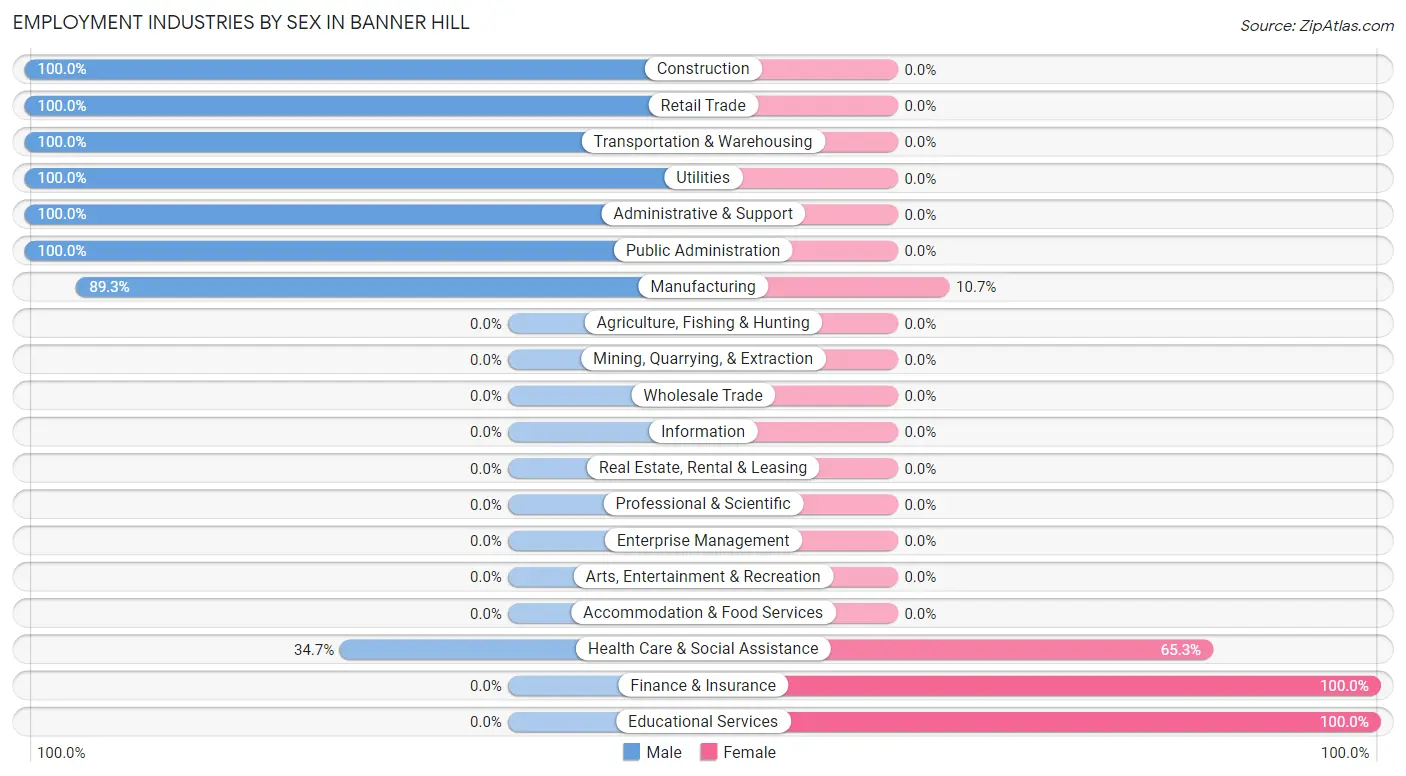
Employment Industries by Sex in Banner Hill
The Banner Hill industries that see more men than women are Construction (100.0%), Retail Trade (100.0%), and Transportation & Warehousing (100.0%), whereas the industries that tend to have a higher number of women are Finance & Insurance (100.0%), Educational Services (100.0%), and Health Care & Social Assistance (65.3%).
| Industry | Male | Female |
| Agriculture, Fishing & Hunting | 0 (0.0%) | 0 (0.0%) |
| Mining, Quarrying, & Extraction | 0 (0.0%) | 0 (0.0%) |
| Construction | 173 (100.0%) | 0 (0.0%) |
| Manufacturing | 125 (89.3%) | 15 (10.7%) |
| Wholesale Trade | 0 (0.0%) | 0 (0.0%) |
| Retail Trade | 9 (100.0%) | 0 (0.0%) |
| Transportation & Warehousing | 38 (100.0%) | 0 (0.0%) |
| Utilities | 7 (100.0%) | 0 (0.0%) |
| Information | 0 (0.0%) | 0 (0.0%) |
| Finance & Insurance | 0 (0.0%) | 50 (100.0%) |
| Real Estate, Rental & Leasing | 0 (0.0%) | 0 (0.0%) |
| Professional & Scientific | 0 (0.0%) | 0 (0.0%) |
| Enterprise Management | 0 (0.0%) | 0 (0.0%) |
| Administrative & Support | 36 (100.0%) | 0 (0.0%) |
| Educational Services | 0 (0.0%) | 36 (100.0%) |
| Health Care & Social Assistance | 42 (34.7%) | 79 (65.3%) |
| Arts, Entertainment & Recreation | 0 (0.0%) | 0 (0.0%) |
| Accommodation & Food Services | 0 (0.0%) | 0 (0.0%) |
| Public Administration | 11 (100.0%) | 0 (0.0%) |
| Total | 475 (69.1%) | 212 (30.9%) |
Education in Banner Hill
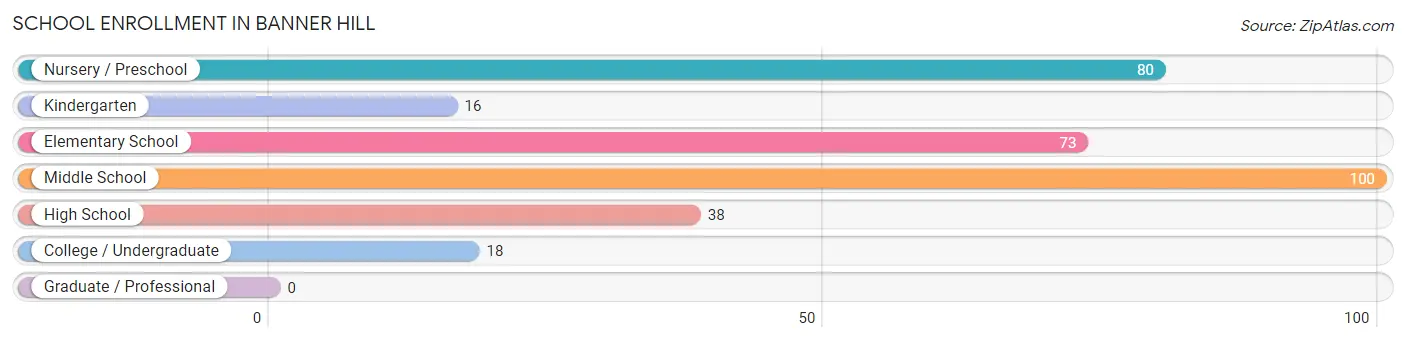
School Enrollment in Banner Hill
The most common levels of schooling among the 325 students in Banner Hill are middle school (100 | 30.8%), nursery / preschool (80 | 24.6%), and elementary school (73 | 22.5%).
| School Level | # Students | % Students |
| Nursery / Preschool | 80 | 24.6% |
| Kindergarten | 16 | 4.9% |
| Elementary School | 73 | 22.5% |
| Middle School | 100 | 30.8% |
| High School | 38 | 11.7% |
| College / Undergraduate | 18 | 5.5% |
| Graduate / Professional | 0 | 0.0% |
| Total | 325 | 100.0% |
School Enrollment by Age by Funding Source in Banner Hill
Out of a total of 325 students who are enrolled in schools in Banner Hill, 145 (44.6%) attend a private institution, while the remaining 180 (55.4%) are enrolled in public schools. The age group of 35 years and over has the highest likelihood of being enrolled in private schools, with 18 (100.0% in the age bracket) enrolled. Conversely, the age group of 15 to 17 year olds has the lowest likelihood of being enrolled in a private school, with 38 (100.0% in the age bracket) attending a public institution.
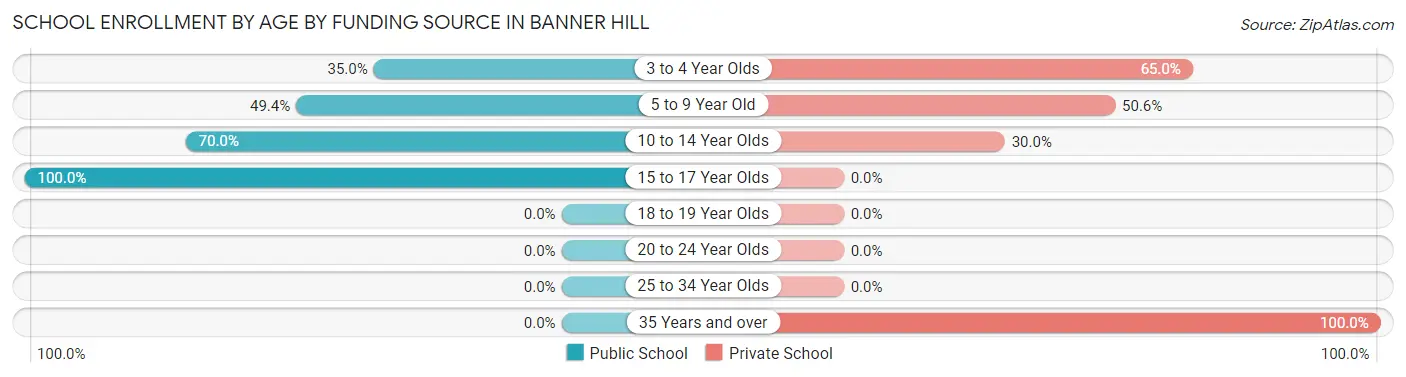
| Age Bracket | Public School | Private School |
| 3 to 4 Year Olds | 28 (35.0%) | 52 (65.0%) |
| 5 to 9 Year Old | 44 (49.4%) | 45 (50.6%) |
| 10 to 14 Year Olds | 70 (70.0%) | 30 (30.0%) |
| 15 to 17 Year Olds | 38 (100.0%) | 0 (0.0%) |
| 18 to 19 Year Olds | 0 (0.0%) | 0 (0.0%) |
| 20 to 24 Year Olds | 0 (0.0%) | 0 (0.0%) |
| 25 to 34 Year Olds | 0 (0.0%) | 0 (0.0%) |
| 35 Years and over | 0 (0.0%) | 18 (100.0%) |
| Total | 180 (55.4%) | 145 (44.6%) |
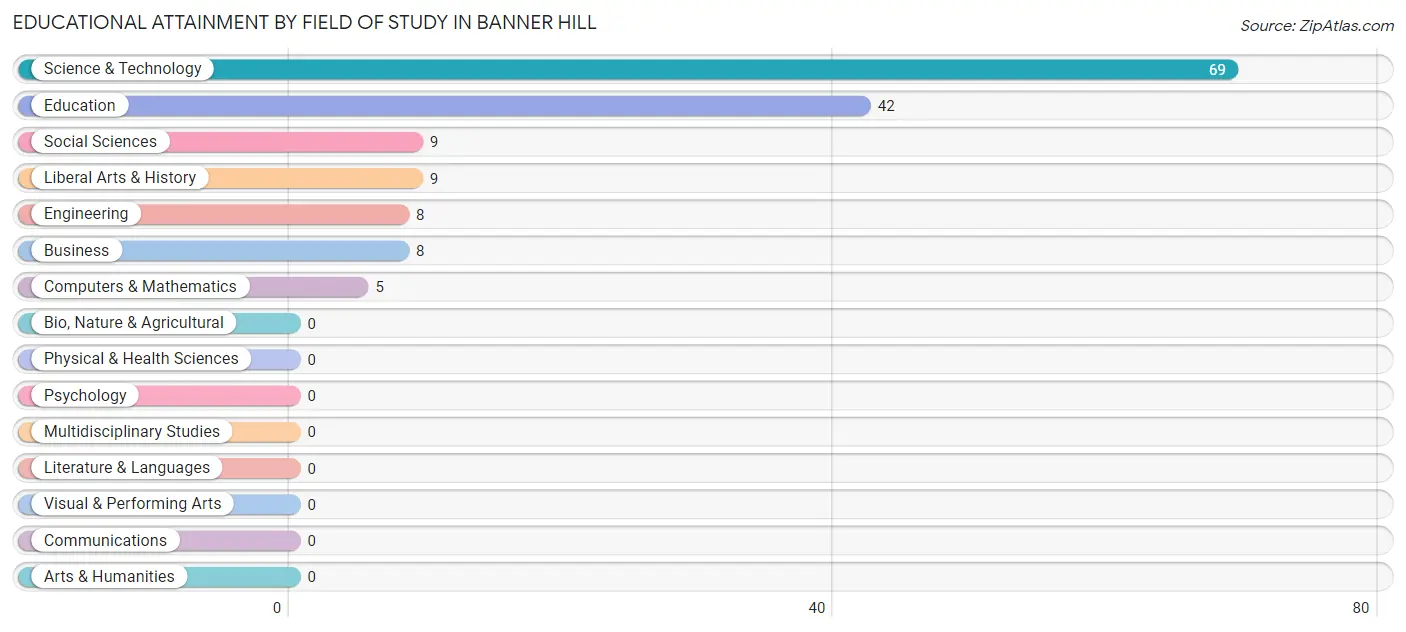
Educational Attainment by Field of Study in Banner Hill
Science & technology (69 | 46.0%), education (42 | 28.0%), social sciences (9 | 6.0%), liberal arts & history (9 | 6.0%), and engineering (8 | 5.3%) are the most common fields of study among 150 individuals in Banner Hill who have obtained a bachelor's degree or higher.
| Field of Study | # Graduates | % Graduates |
| Computers & Mathematics | 5 | 3.3% |
| Bio, Nature & Agricultural | 0 | 0.0% |
| Physical & Health Sciences | 0 | 0.0% |
| Psychology | 0 | 0.0% |
| Social Sciences | 9 | 6.0% |
| Engineering | 8 | 5.3% |
| Multidisciplinary Studies | 0 | 0.0% |
| Science & Technology | 69 | 46.0% |
| Business | 8 | 5.3% |
| Education | 42 | 28.0% |
| Literature & Languages | 0 | 0.0% |
| Liberal Arts & History | 9 | 6.0% |
| Visual & Performing Arts | 0 | 0.0% |
| Communications | 0 | 0.0% |
| Arts & Humanities | 0 | 0.0% |
| Total | 150 | 100.0% |
Transportation & Commute in Banner Hill
Vehicle Availability by Sex in Banner Hill
The most prevalent vehicle ownership categories in Banner Hill are males with 3 vehicles (199, accounting for 41.9%) and females with 3 vehicles (78, making up 93.9%).
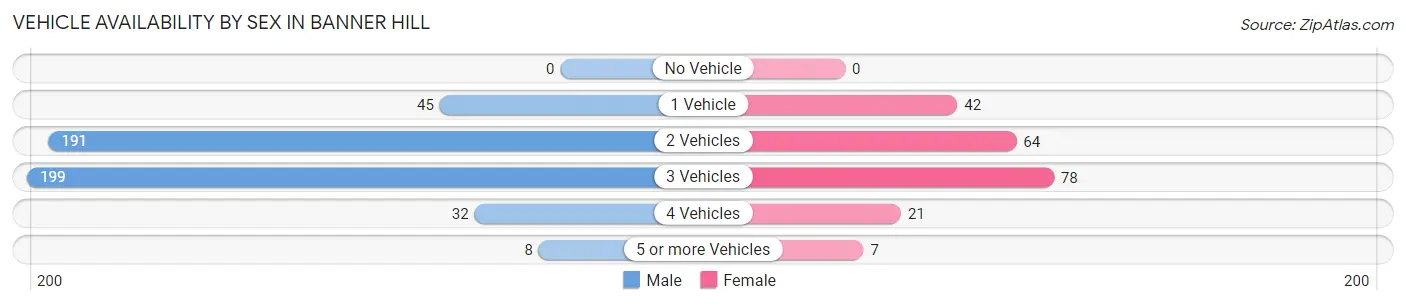
| Vehicles Available | Male | Female |
| No Vehicle | 0 (0.0%) | 0 (0.0%) |
| 1 Vehicle | 45 (9.5%) | 42 (19.8%) |
| 2 Vehicles | 191 (40.2%) | 64 (30.2%) |
| 3 Vehicles | 199 (41.9%) | 78 (36.8%) |
| 4 Vehicles | 32 (6.7%) | 21 (9.9%) |
| 5 or more Vehicles | 8 (1.7%) | 7 (3.3%) |
| Total | 475 (100.0%) | 212 (100.0%) |
Commute Time in Banner Hill
The most frequently occuring commute durations in Banner Hill are 20 to 24 minutes (173 commuters, 27.8%), less than 5 minutes (113 commuters, 18.2%), and 45 to 59 minutes (84 commuters, 13.5%).
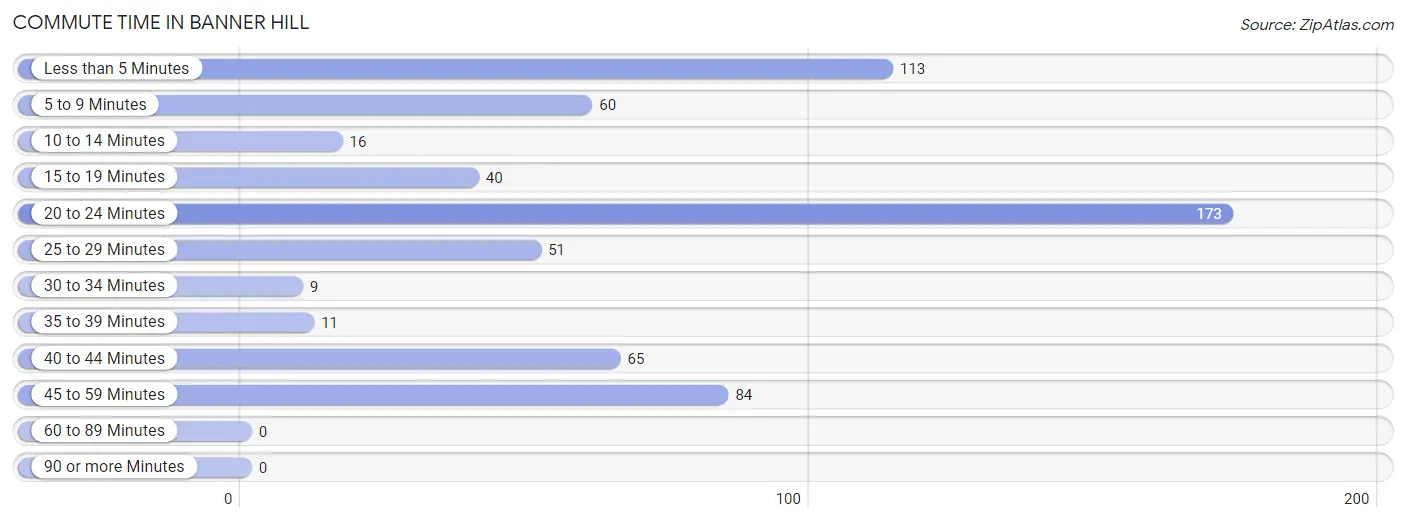
| Commute Time | # Commuters | % Commuters |
| Less than 5 Minutes | 113 | 18.2% |
| 5 to 9 Minutes | 60 | 9.7% |
| 10 to 14 Minutes | 16 | 2.6% |
| 15 to 19 Minutes | 40 | 6.4% |
| 20 to 24 Minutes | 173 | 27.8% |
| 25 to 29 Minutes | 51 | 8.2% |
| 30 to 34 Minutes | 9 | 1.5% |
| 35 to 39 Minutes | 11 | 1.8% |
| 40 to 44 Minutes | 65 | 10.4% |
| 45 to 59 Minutes | 84 | 13.5% |
| 60 to 89 Minutes | 0 | 0.0% |
| 90 or more Minutes | 0 | 0.0% |
Commute Time by Sex in Banner Hill
The most common commute times in Banner Hill are 20 to 24 minutes (152 commuters, 32.0%) for males and 5 to 9 minutes (60 commuters, 40.8%) for females.
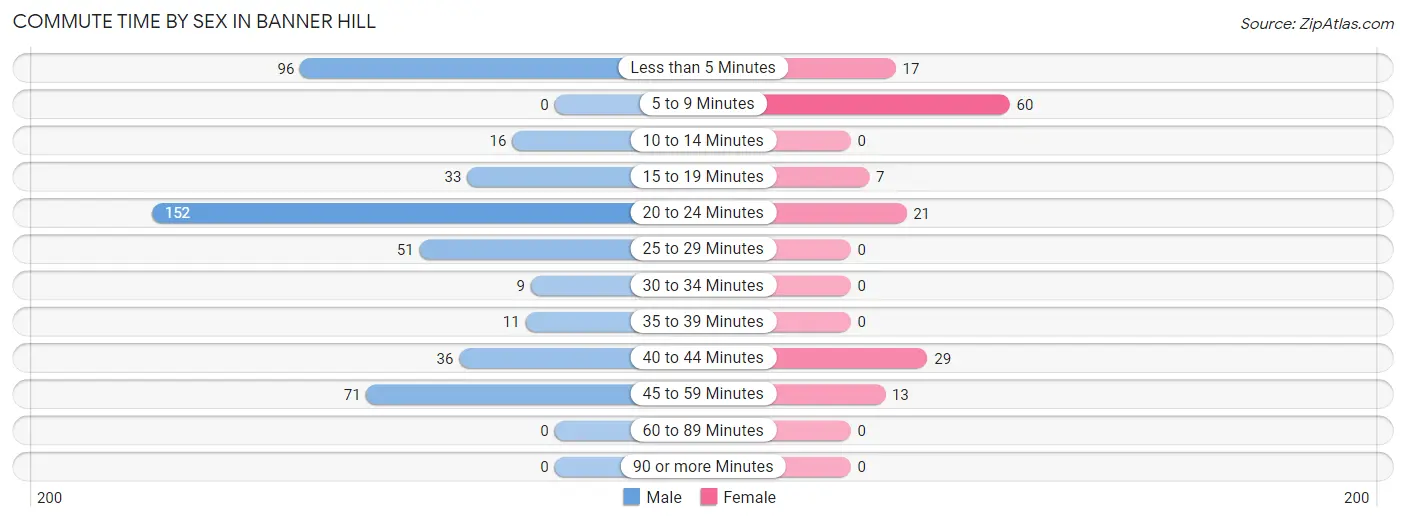
| Commute Time | Male | Female |
| Less than 5 Minutes | 96 (20.2%) | 17 (11.6%) |
| 5 to 9 Minutes | 0 (0.0%) | 60 (40.8%) |
| 10 to 14 Minutes | 16 (3.4%) | 0 (0.0%) |
| 15 to 19 Minutes | 33 (7.0%) | 7 (4.8%) |
| 20 to 24 Minutes | 152 (32.0%) | 21 (14.3%) |
| 25 to 29 Minutes | 51 (10.7%) | 0 (0.0%) |
| 30 to 34 Minutes | 9 (1.9%) | 0 (0.0%) |
| 35 to 39 Minutes | 11 (2.3%) | 0 (0.0%) |
| 40 to 44 Minutes | 36 (7.6%) | 29 (19.7%) |
| 45 to 59 Minutes | 71 (14.9%) | 13 (8.8%) |
| 60 to 89 Minutes | 0 (0.0%) | 0 (0.0%) |
| 90 or more Minutes | 0 (0.0%) | 0 (0.0%) |
Time of Departure to Work by Sex in Banner Hill
The most frequent times of departure to work in Banner Hill are 6:30 AM to 6:59 AM (110, 23.2%) for males and 7:30 AM to 7:59 AM (59, 40.1%) for females.
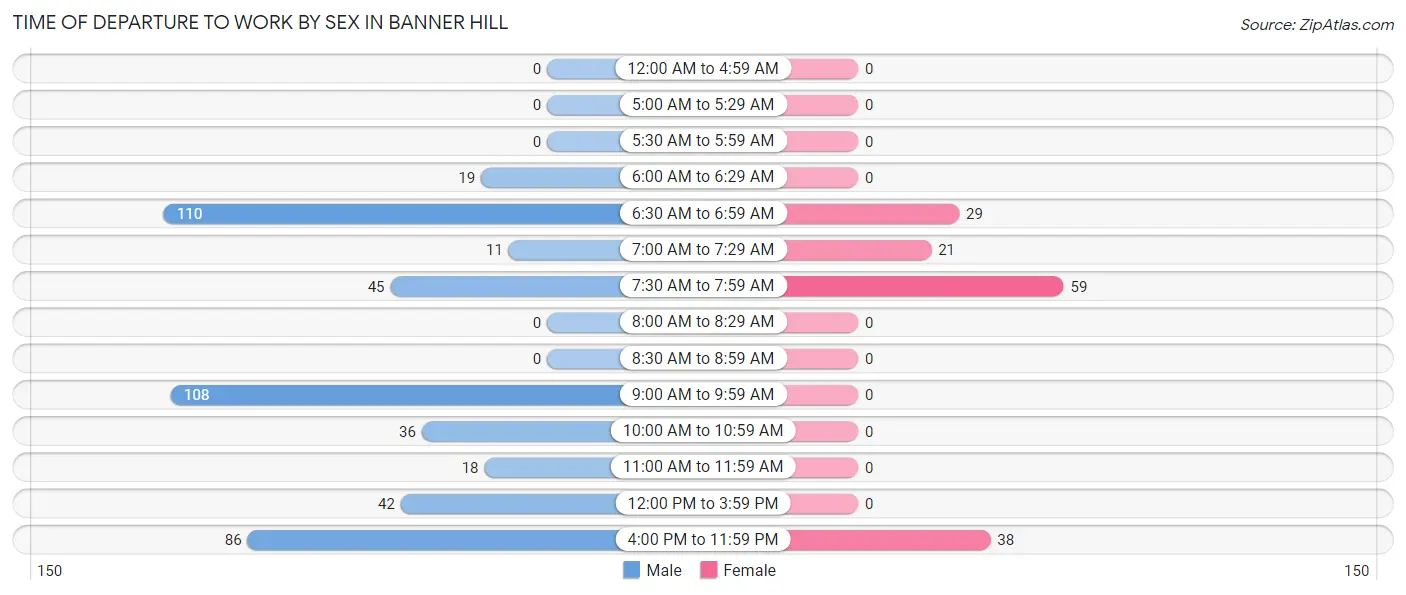
| Time of Departure | Male | Female |
| 12:00 AM to 4:59 AM | 0 (0.0%) | 0 (0.0%) |
| 5:00 AM to 5:29 AM | 0 (0.0%) | 0 (0.0%) |
| 5:30 AM to 5:59 AM | 0 (0.0%) | 0 (0.0%) |
| 6:00 AM to 6:29 AM | 19 (4.0%) | 0 (0.0%) |
| 6:30 AM to 6:59 AM | 110 (23.2%) | 29 (19.7%) |
| 7:00 AM to 7:29 AM | 11 (2.3%) | 21 (14.3%) |
| 7:30 AM to 7:59 AM | 45 (9.5%) | 59 (40.1%) |
| 8:00 AM to 8:29 AM | 0 (0.0%) | 0 (0.0%) |
| 8:30 AM to 8:59 AM | 0 (0.0%) | 0 (0.0%) |
| 9:00 AM to 9:59 AM | 108 (22.7%) | 0 (0.0%) |
| 10:00 AM to 10:59 AM | 36 (7.6%) | 0 (0.0%) |
| 11:00 AM to 11:59 AM | 18 (3.8%) | 0 (0.0%) |
| 12:00 PM to 3:59 PM | 42 (8.8%) | 0 (0.0%) |
| 4:00 PM to 11:59 PM | 86 (18.1%) | 38 (25.9%) |
| Total | 475 (100.0%) | 147 (100.0%) |
Housing Occupancy in Banner Hill
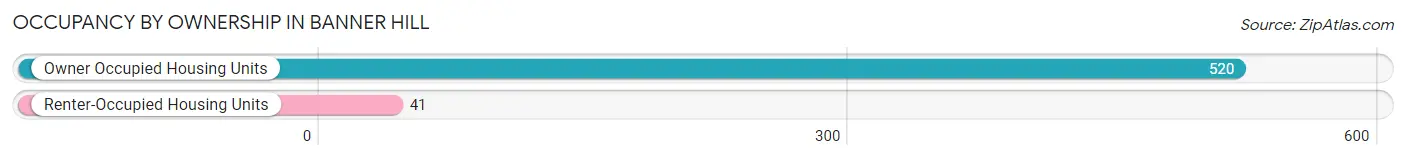
Occupancy by Ownership in Banner Hill
Of the total 561 dwellings in Banner Hill, owner-occupied units account for 520 (92.7%), while renter-occupied units make up 41 (7.3%).
| Occupancy | # Housing Units | % Housing Units |
| Owner Occupied Housing Units | 520 | 92.7% |
| Renter-Occupied Housing Units | 41 | 7.3% |
| Total Occupied Housing Units | 561 | 100.0% |
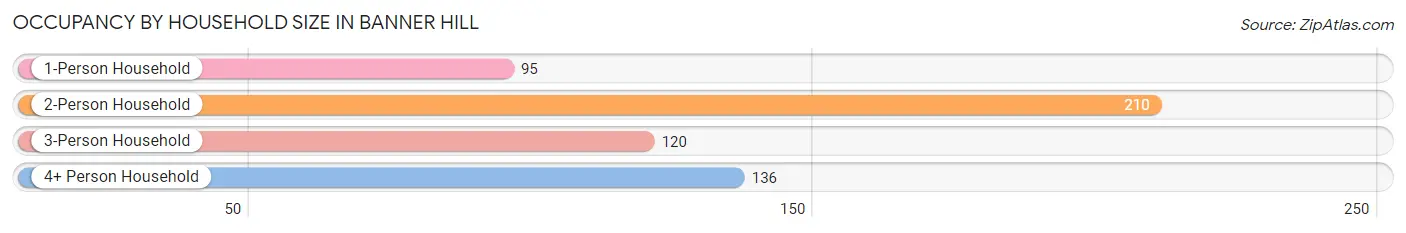
Occupancy by Household Size in Banner Hill
| Household Size | # Housing Units | % Housing Units |
| 1-Person Household | 95 | 16.9% |
| 2-Person Household | 210 | 37.4% |
| 3-Person Household | 120 | 21.4% |
| 4+ Person Household | 136 | 24.2% |
| Total Housing Units | 561 | 100.0% |
Occupancy by Ownership by Household Size in Banner Hill
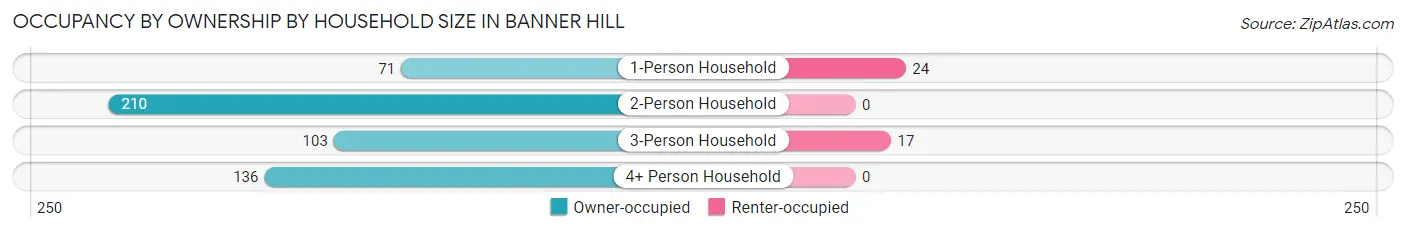
| Household Size | Owner-occupied | Renter-occupied |
| 1-Person Household | 71 (74.7%) | 24 (25.3%) |
| 2-Person Household | 210 (100.0%) | 0 (0.0%) |
| 3-Person Household | 103 (85.8%) | 17 (14.2%) |
| 4+ Person Household | 136 (100.0%) | 0 (0.0%) |
| Total Housing Units | 520 (92.7%) | 41 (7.3%) |
Occupancy by Educational Attainment in Banner Hill
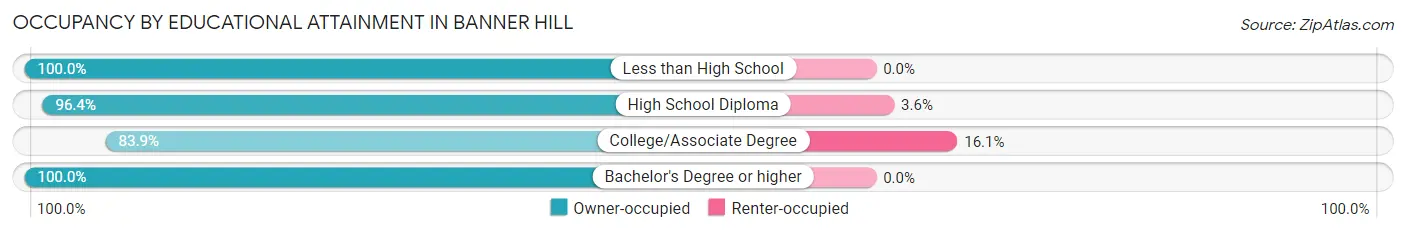
| Household Size | Owner-occupied | Renter-occupied |
| Less than High School | 43 (100.0%) | 0 (0.0%) |
| High School Diploma | 243 (96.4%) | 9 (3.6%) |
| College/Associate Degree | 167 (83.9%) | 32 (16.1%) |
| Bachelor's Degree or higher | 67 (100.0%) | 0 (0.0%) |
Occupancy by Age of Householder in Banner Hill
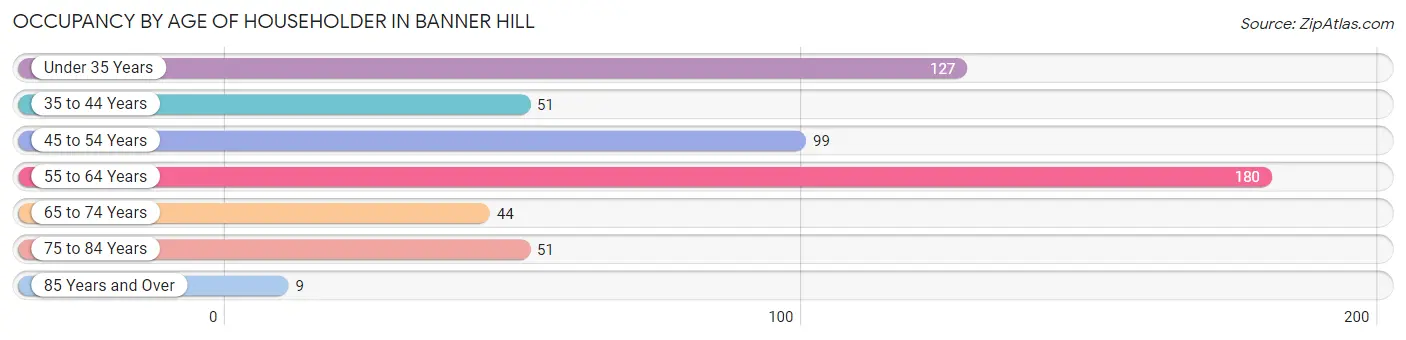
| Age Bracket | # Households | % Households |
| Under 35 Years | 127 | 22.6% |
| 35 to 44 Years | 51 | 9.1% |
| 45 to 54 Years | 99 | 17.6% |
| 55 to 64 Years | 180 | 32.1% |
| 65 to 74 Years | 44 | 7.8% |
| 75 to 84 Years | 51 | 9.1% |
| 85 Years and Over | 9 | 1.6% |
| Total | 561 | 100.0% |
Housing Finances in Banner Hill
Median Income by Occupancy in Banner Hill
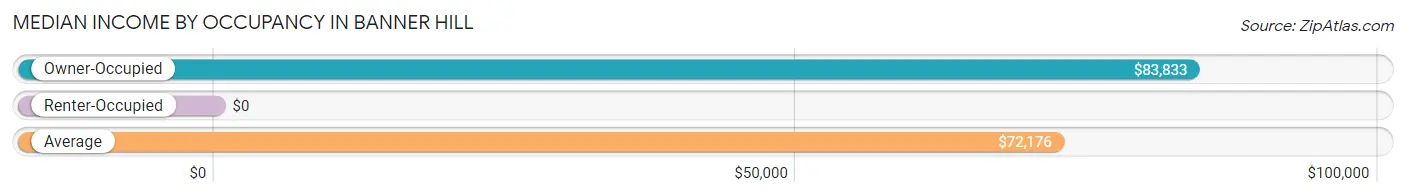
| Occupancy Type | # Households | Median Income |
| Owner-Occupied | 520 (92.7%) | $83,833 |
| Renter-Occupied | 41 (7.3%) | $0 |
| Average | 561 (100.0%) | $72,176 |
Occupancy by Householder Income Bracket in Banner Hill
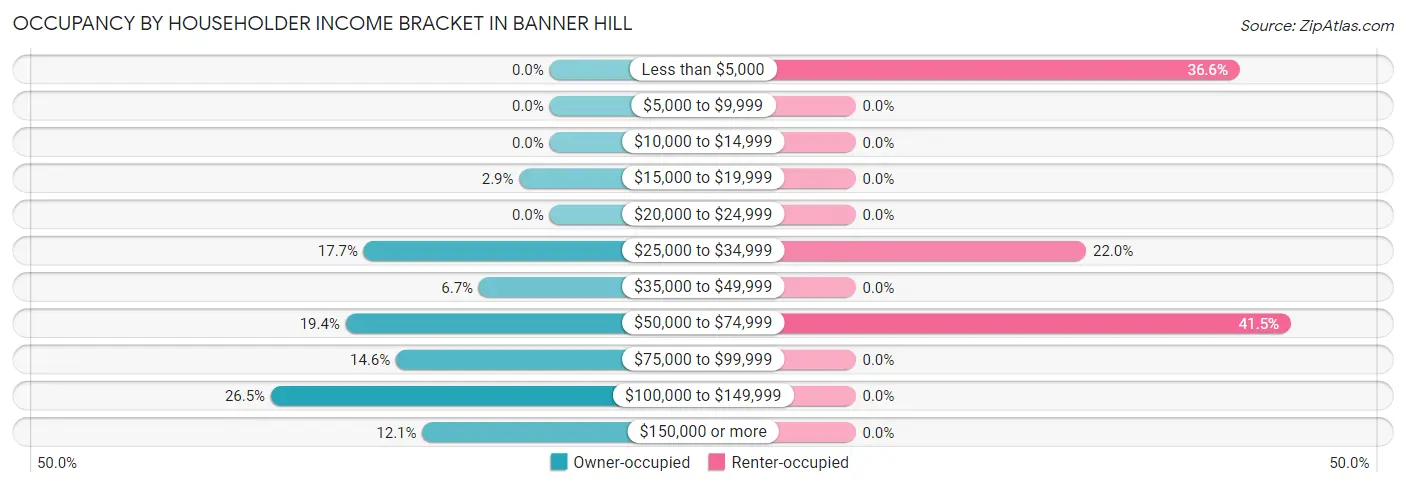
| Income Bracket | Owner-occupied | Renter-occupied |
| Less than $5,000 | 0 (0.0%) | 15 (36.6%) |
| $5,000 to $9,999 | 0 (0.0%) | 0 (0.0%) |
| $10,000 to $14,999 | 0 (0.0%) | 0 (0.0%) |
| $15,000 to $19,999 | 15 (2.9%) | 0 (0.0%) |
| $20,000 to $24,999 | 0 (0.0%) | 0 (0.0%) |
| $25,000 to $34,999 | 92 (17.7%) | 9 (22.0%) |
| $35,000 to $49,999 | 35 (6.7%) | 0 (0.0%) |
| $50,000 to $74,999 | 101 (19.4%) | 17 (41.5%) |
| $75,000 to $99,999 | 76 (14.6%) | 0 (0.0%) |
| $100,000 to $149,999 | 138 (26.5%) | 0 (0.0%) |
| $150,000 or more | 63 (12.1%) | 0 (0.0%) |
| Total | 520 (100.0%) | 41 (100.0%) |
Monthly Housing Cost Tiers in Banner Hill
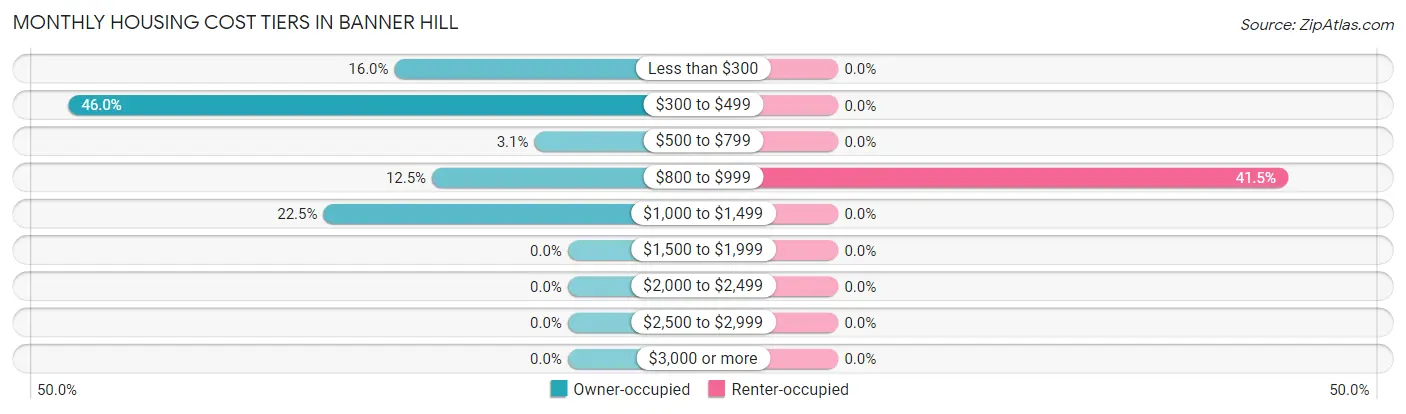
| Monthly Cost | Owner-occupied | Renter-occupied |
| Less than $300 | 83 (16.0%) | 0 (0.0%) |
| $300 to $499 | 239 (46.0%) | 0 (0.0%) |
| $500 to $799 | 16 (3.1%) | 0 (0.0%) |
| $800 to $999 | 65 (12.5%) | 17 (41.5%) |
| $1,000 to $1,499 | 117 (22.5%) | 0 (0.0%) |
| $1,500 to $1,999 | 0 (0.0%) | 0 (0.0%) |
| $2,000 to $2,499 | 0 (0.0%) | 0 (0.0%) |
| $2,500 to $2,999 | 0 (0.0%) | 0 (0.0%) |
| $3,000 or more | 0 (0.0%) | 0 (0.0%) |
| Total | 520 (100.0%) | 41 (100.0%) |
Physical Housing Characteristics in Banner Hill
Housing Structures in Banner Hill
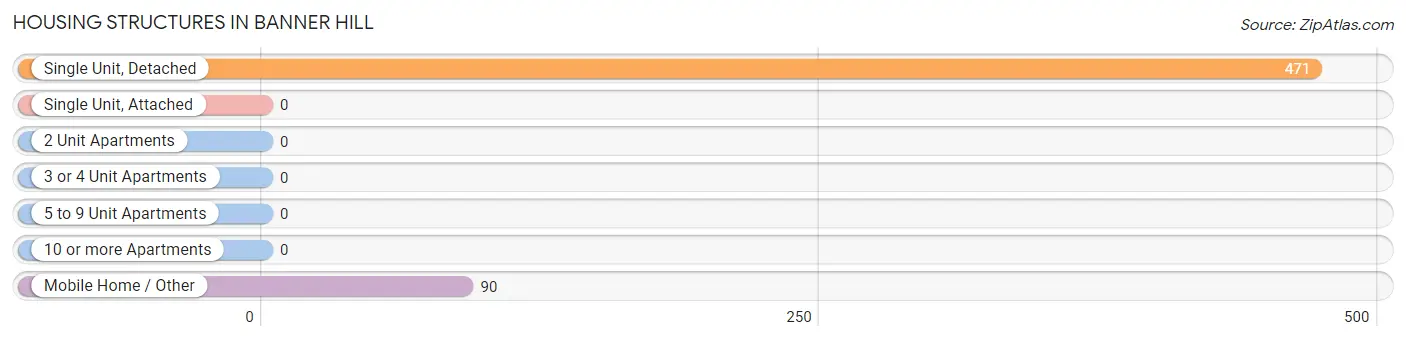
| Structure Type | # Housing Units | % Housing Units |
| Single Unit, Detached | 471 | 84.0% |
| Single Unit, Attached | 0 | 0.0% |
| 2 Unit Apartments | 0 | 0.0% |
| 3 or 4 Unit Apartments | 0 | 0.0% |
| 5 to 9 Unit Apartments | 0 | 0.0% |
| 10 or more Apartments | 0 | 0.0% |
| Mobile Home / Other | 90 | 16.0% |
| Total | 561 | 100.0% |
Housing Structures by Occupancy in Banner Hill
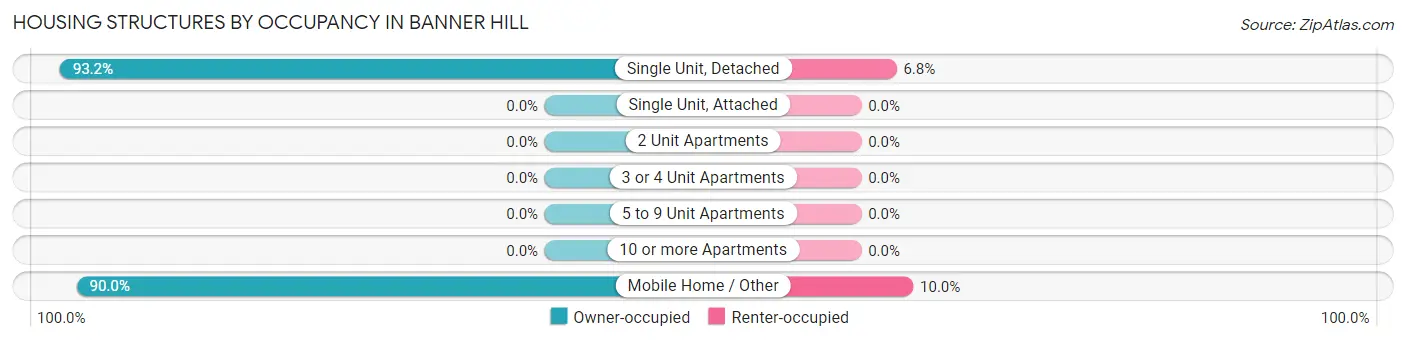
| Structure Type | Owner-occupied | Renter-occupied |
| Single Unit, Detached | 439 (93.2%) | 32 (6.8%) |
| Single Unit, Attached | 0 (0.0%) | 0 (0.0%) |
| 2 Unit Apartments | 0 (0.0%) | 0 (0.0%) |
| 3 or 4 Unit Apartments | 0 (0.0%) | 0 (0.0%) |
| 5 to 9 Unit Apartments | 0 (0.0%) | 0 (0.0%) |
| 10 or more Apartments | 0 (0.0%) | 0 (0.0%) |
| Mobile Home / Other | 81 (90.0%) | 9 (10.0%) |
| Total | 520 (92.7%) | 41 (7.3%) |
Housing Structures by Number of Rooms in Banner Hill
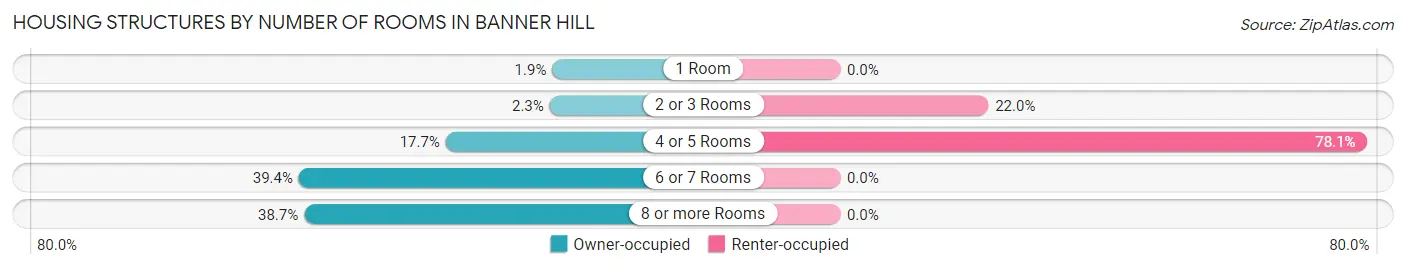
| Number of Rooms | Owner-occupied | Renter-occupied |
| 1 Room | 10 (1.9%) | 0 (0.0%) |
| 2 or 3 Rooms | 12 (2.3%) | 9 (22.0%) |
| 4 or 5 Rooms | 92 (17.7%) | 32 (78.0%) |
| 6 or 7 Rooms | 205 (39.4%) | 0 (0.0%) |
| 8 or more Rooms | 201 (38.7%) | 0 (0.0%) |
| Total | 520 (100.0%) | 41 (100.0%) |
Housing Structure by Heating Type in Banner Hill
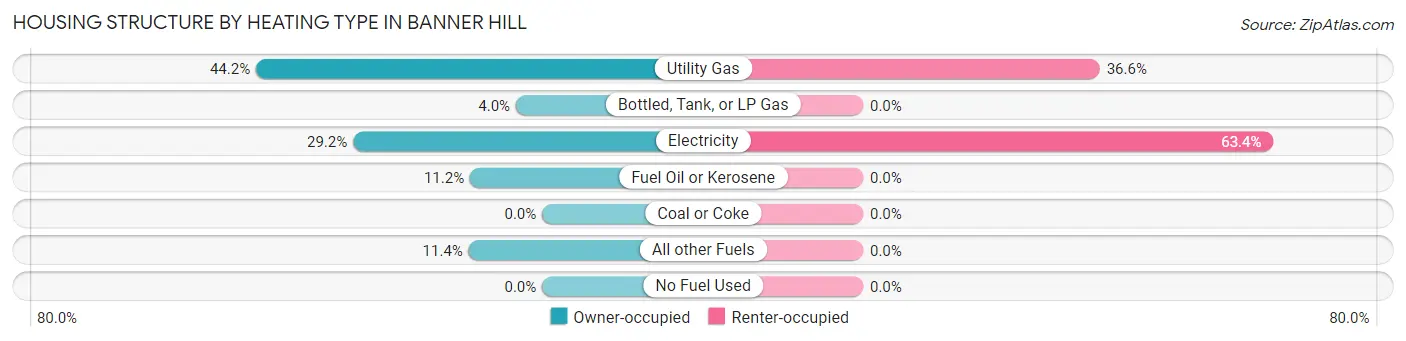
| Heating Type | Owner-occupied | Renter-occupied |
| Utility Gas | 230 (44.2%) | 15 (36.6%) |
| Bottled, Tank, or LP Gas | 21 (4.0%) | 0 (0.0%) |
| Electricity | 152 (29.2%) | 26 (63.4%) |
| Fuel Oil or Kerosene | 58 (11.2%) | 0 (0.0%) |
| Coal or Coke | 0 (0.0%) | 0 (0.0%) |
| All other Fuels | 59 (11.4%) | 0 (0.0%) |
| No Fuel Used | 0 (0.0%) | 0 (0.0%) |
| Total | 520 (100.0%) | 41 (100.0%) |
Household Vehicle Usage in Banner Hill
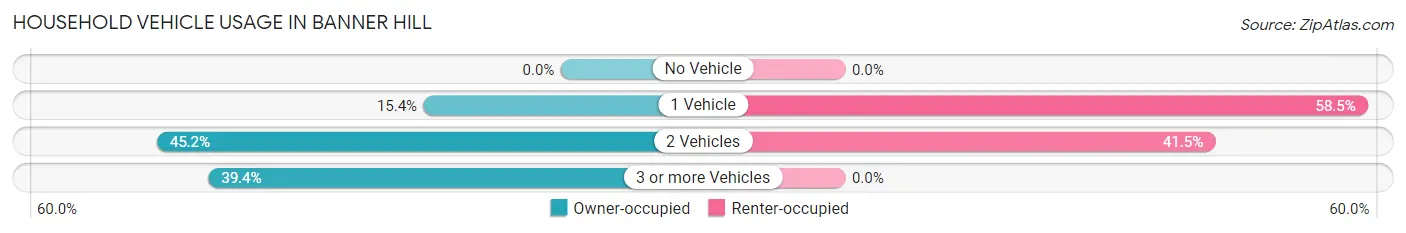
| Vehicles per Household | Owner-occupied | Renter-occupied |
| No Vehicle | 0 (0.0%) | 0 (0.0%) |
| 1 Vehicle | 80 (15.4%) | 24 (58.5%) |
| 2 Vehicles | 235 (45.2%) | 17 (41.5%) |
| 3 or more Vehicles | 205 (39.4%) | 0 (0.0%) |
| Total | 520 (100.0%) | 41 (100.0%) |
Real Estate & Mortgages in Banner Hill
Real Estate and Mortgage Overview in Banner Hill
| Characteristic | Without Mortgage | With Mortgage |
| Housing Units | 333 | 187 |
| Median Property Value | $86,600 | $142,200 |
| Median Household Income | $60,257 | $29 |
| Monthly Housing Costs | $365 | $0 |
| Real Estate Taxes | $550 | $0 |
Property Value by Mortgage Status in Banner Hill
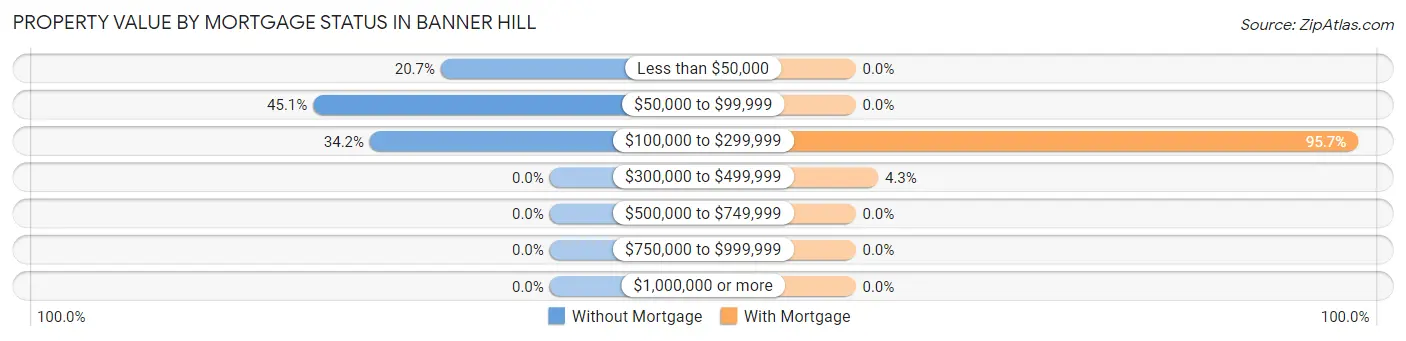
| Property Value | Without Mortgage | With Mortgage |
| Less than $50,000 | 69 (20.7%) | 0 (0.0%) |
| $50,000 to $99,999 | 150 (45.1%) | 0 (0.0%) |
| $100,000 to $299,999 | 114 (34.2%) | 179 (95.7%) |
| $300,000 to $499,999 | 0 (0.0%) | 8 (4.3%) |
| $500,000 to $749,999 | 0 (0.0%) | 0 (0.0%) |
| $750,000 to $999,999 | 0 (0.0%) | 0 (0.0%) |
| $1,000,000 or more | 0 (0.0%) | 0 (0.0%) |
| Total | 333 (100.0%) | 187 (100.0%) |
Household Income by Mortgage Status in Banner Hill
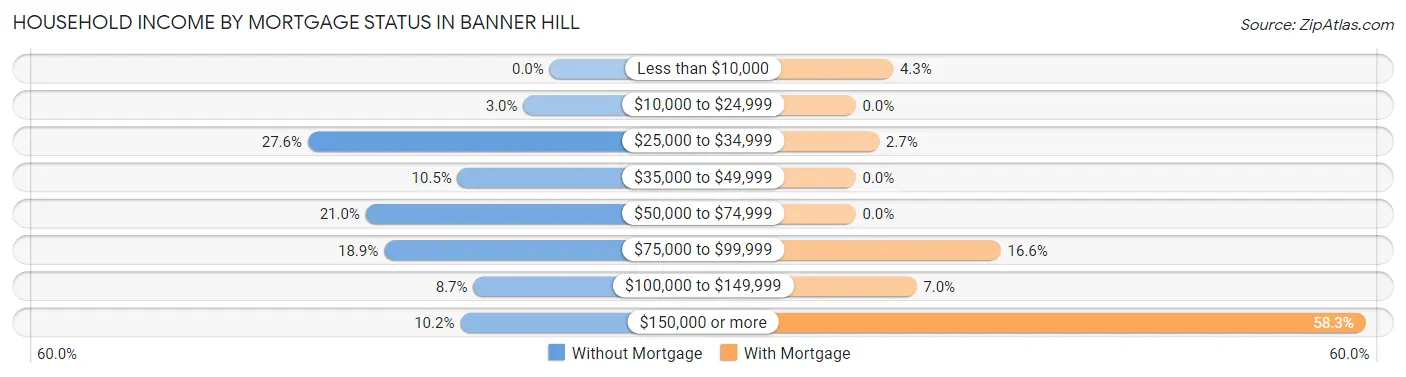
| Household Income | Without Mortgage | With Mortgage |
| Less than $10,000 | 0 (0.0%) | 8 (4.3%) |
| $10,000 to $24,999 | 10 (3.0%) | 0 (0.0%) |
| $25,000 to $34,999 | 92 (27.6%) | 5 (2.7%) |
| $35,000 to $49,999 | 35 (10.5%) | 0 (0.0%) |
| $50,000 to $74,999 | 70 (21.0%) | 0 (0.0%) |
| $75,000 to $99,999 | 63 (18.9%) | 31 (16.6%) |
| $100,000 to $149,999 | 29 (8.7%) | 13 (7.0%) |
| $150,000 or more | 34 (10.2%) | 109 (58.3%) |
| Total | 333 (100.0%) | 187 (100.0%) |
Property Value to Household Income Ratio in Banner Hill
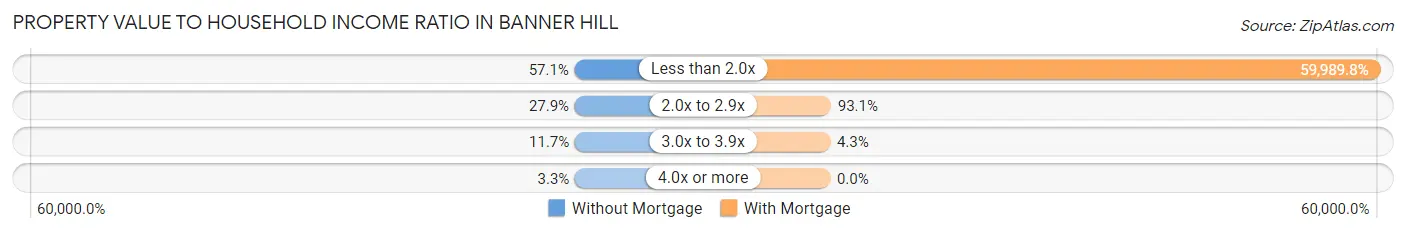
| Value-to-Income Ratio | Without Mortgage | With Mortgage |
| Less than 2.0x | 190 (57.1%) | 112,181 (59,989.8%) |
| 2.0x to 2.9x | 93 (27.9%) | 174 (93.0%) |
| 3.0x to 3.9x | 39 (11.7%) | 8 (4.3%) |
| 4.0x or more | 11 (3.3%) | 0 (0.0%) |
| Total | 333 (100.0%) | 187 (100.0%) |
Real Estate Taxes by Mortgage Status in Banner Hill
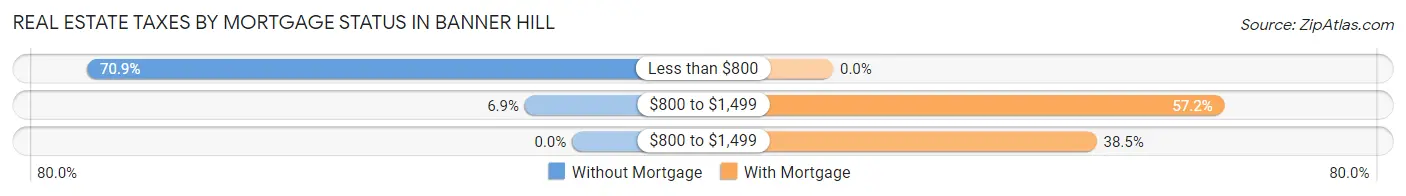
| Property Taxes | Without Mortgage | With Mortgage |
| Less than $800 | 236 (70.9%) | 0 (0.0%) |
| $800 to $1,499 | 23 (6.9%) | 107 (57.2%) |
| $800 to $1,499 | 0 (0.0%) | 72 (38.5%) |
| Total | 333 (100.0%) | 187 (100.0%) |
Health & Disability in Banner Hill
Health Insurance Coverage by Age in Banner Hill
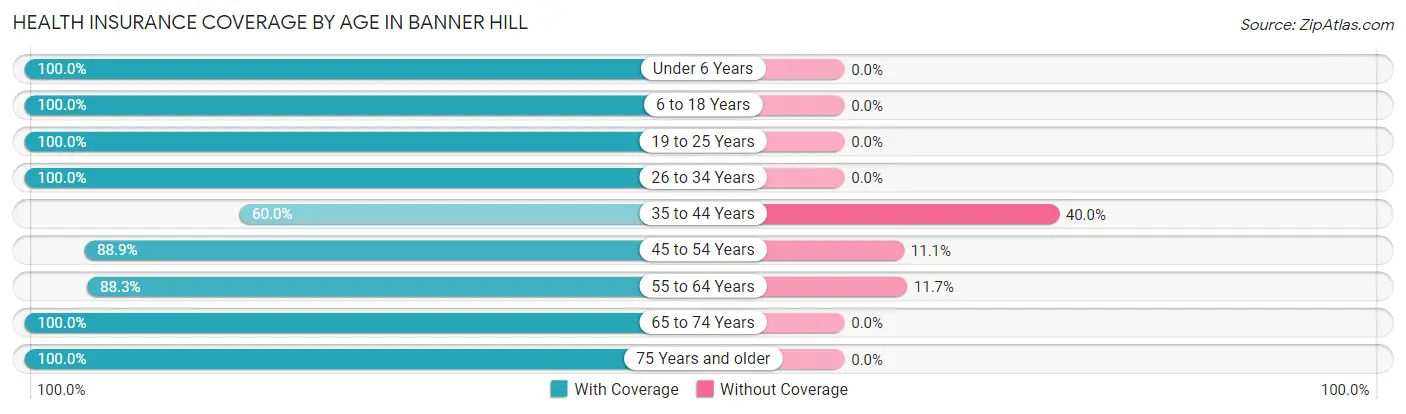
| Age Bracket | With Coverage | Without Coverage |
| Under 6 Years | 153 (100.0%) | 0 (0.0%) |
| 6 to 18 Years | 211 (100.0%) | 0 (0.0%) |
| 19 to 25 Years | 36 (100.0%) | 0 (0.0%) |
| 26 to 34 Years | 301 (100.0%) | 0 (0.0%) |
| 35 to 44 Years | 51 (60.0%) | 34 (40.0%) |
| 45 to 54 Years | 152 (88.9%) | 19 (11.1%) |
| 55 to 64 Years | 265 (88.3%) | 35 (11.7%) |
| 65 to 74 Years | 93 (100.0%) | 0 (0.0%) |
| 75 Years and older | 90 (100.0%) | 0 (0.0%) |
| Total | 1,352 (93.9%) | 88 (6.1%) |
Health Insurance Coverage by Citizenship Status in Banner Hill
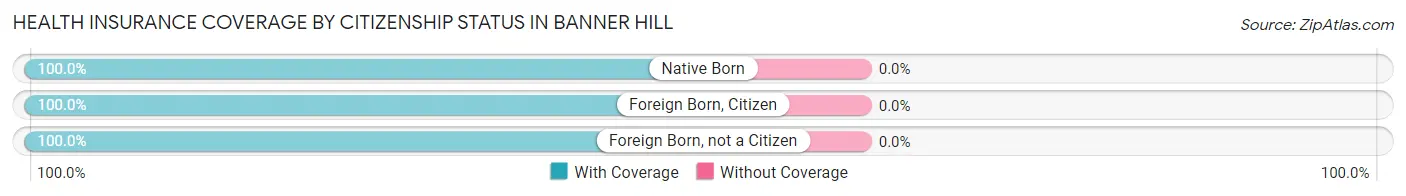
| Citizenship Status | With Coverage | Without Coverage |
| Native Born | 153 (100.0%) | 0 (0.0%) |
| Foreign Born, Citizen | 211 (100.0%) | 0 (0.0%) |
| Foreign Born, not a Citizen | 36 (100.0%) | 0 (0.0%) |
Health Insurance Coverage by Household Income in Banner Hill
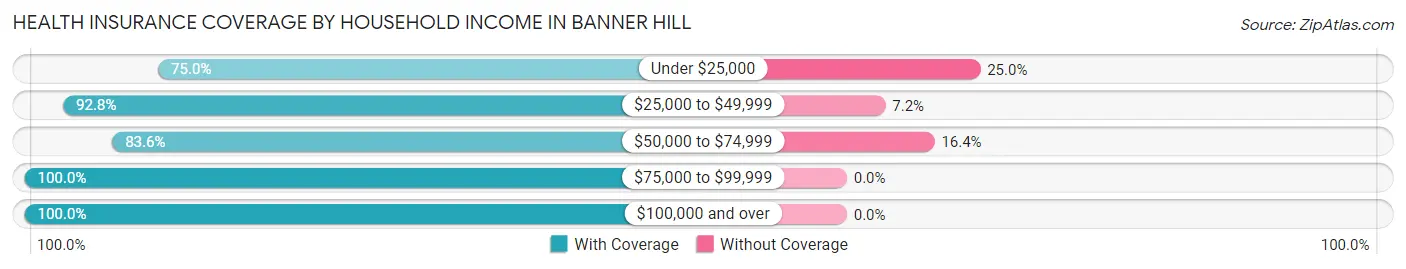
| Household Income | With Coverage | Without Coverage |
| Under $25,000 | 30 (75.0%) | 10 (25.0%) |
| $25,000 to $49,999 | 437 (92.8%) | 34 (7.2%) |
| $50,000 to $74,999 | 224 (83.6%) | 44 (16.4%) |
| $75,000 to $99,999 | 137 (100.0%) | 0 (0.0%) |
| $100,000 and over | 524 (100.0%) | 0 (0.0%) |
Public vs Private Health Insurance Coverage by Age in Banner Hill
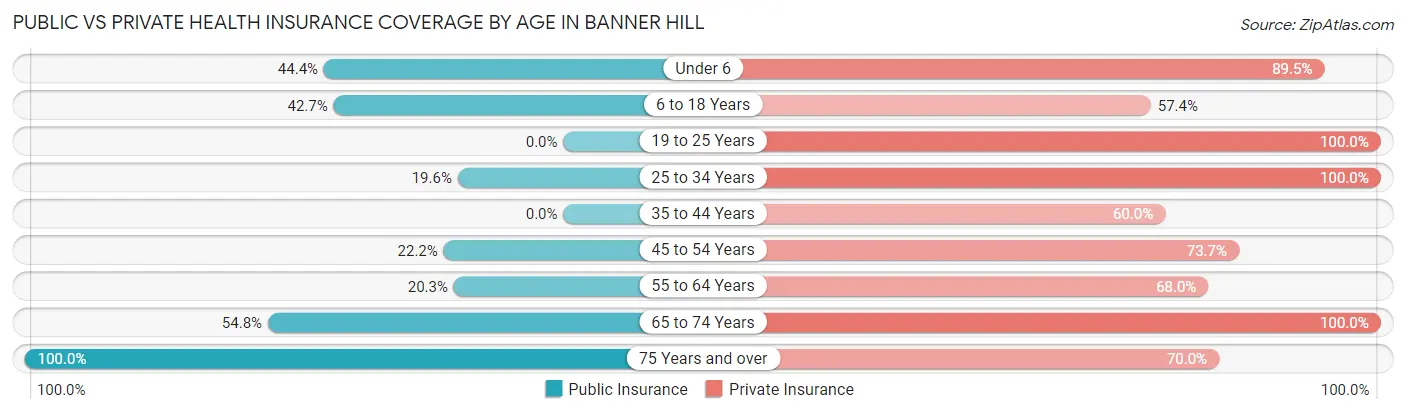
| Age Bracket | Public Insurance | Private Insurance |
| Under 6 | 68 (44.4%) | 137 (89.5%) |
| 6 to 18 Years | 90 (42.6%) | 121 (57.4%) |
| 19 to 25 Years | 0 (0.0%) | 36 (100.0%) |
| 25 to 34 Years | 59 (19.6%) | 301 (100.0%) |
| 35 to 44 Years | 0 (0.0%) | 51 (60.0%) |
| 45 to 54 Years | 38 (22.2%) | 126 (73.7%) |
| 55 to 64 Years | 61 (20.3%) | 204 (68.0%) |
| 65 to 74 Years | 51 (54.8%) | 93 (100.0%) |
| 75 Years and over | 90 (100.0%) | 63 (70.0%) |
| Total | 457 (31.7%) | 1,132 (78.6%) |
Disability Status by Sex by Age in Banner Hill
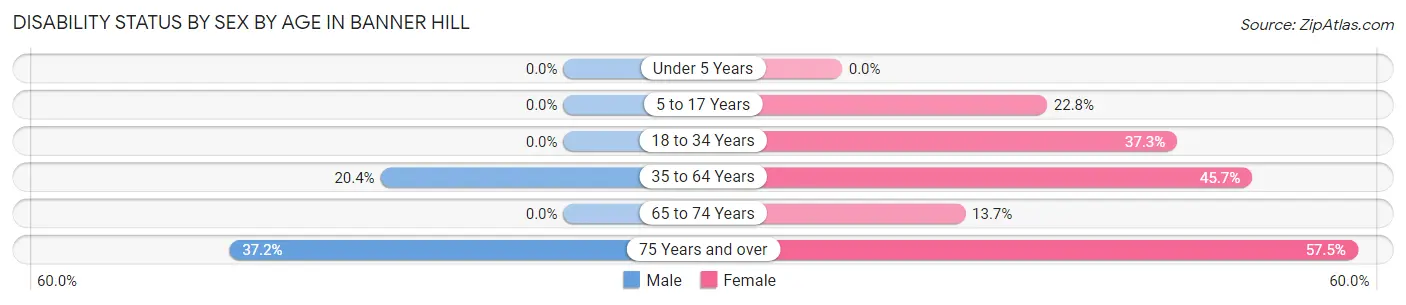
| Age Bracket | Male | Female |
| Under 5 Years | 0 (0.0%) | 0 (0.0%) |
| 5 to 17 Years | 0 (0.0%) | 45 (22.8%) |
| 18 to 34 Years | 0 (0.0%) | 59 (37.3%) |
| 35 to 64 Years | 66 (20.4%) | 106 (45.7%) |
| 65 to 74 Years | 0 (0.0%) | 7 (13.7%) |
| 75 Years and over | 16 (37.2%) | 27 (57.5%) |
Disability Class by Sex by Age in Banner Hill
Disability Class: Hearing Difficulty
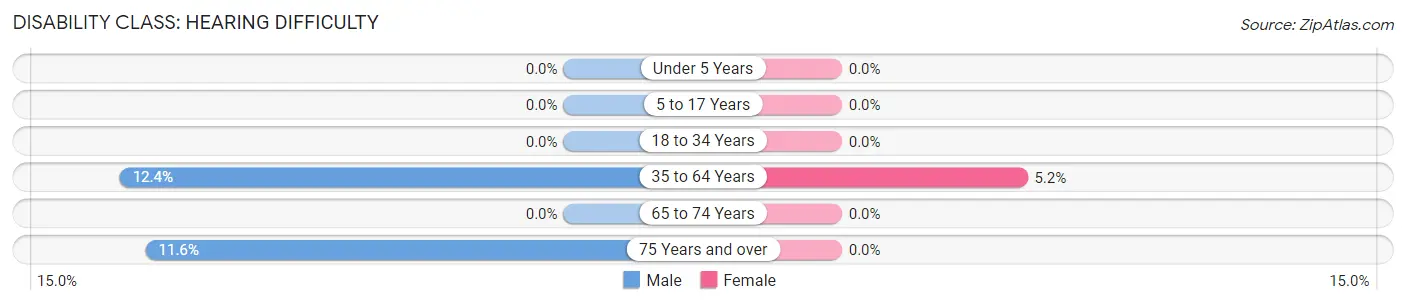
| Age Bracket | Male | Female |
| Under 5 Years | 0 (0.0%) | 0 (0.0%) |
| 5 to 17 Years | 0 (0.0%) | 0 (0.0%) |
| 18 to 34 Years | 0 (0.0%) | 0 (0.0%) |
| 35 to 64 Years | 40 (12.3%) | 12 (5.2%) |
| 65 to 74 Years | 0 (0.0%) | 0 (0.0%) |
| 75 Years and over | 5 (11.6%) | 0 (0.0%) |
Disability Class: Vision Difficulty
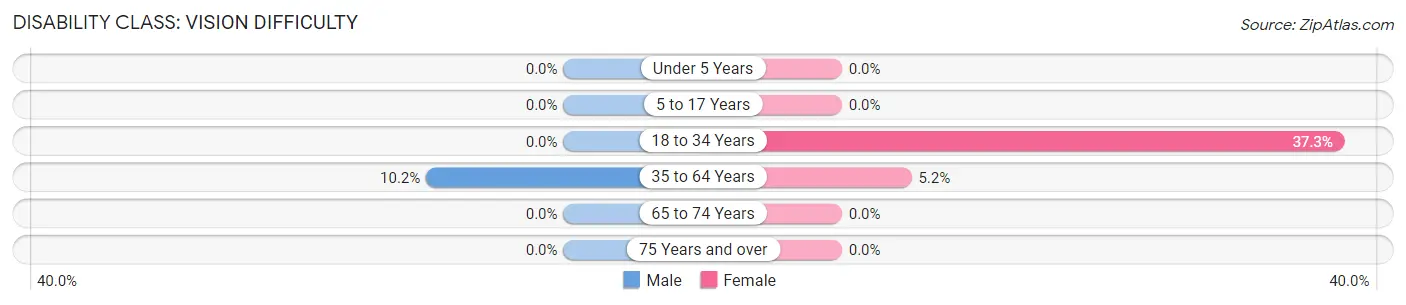
| Age Bracket | Male | Female |
| Under 5 Years | 0 (0.0%) | 0 (0.0%) |
| 5 to 17 Years | 0 (0.0%) | 0 (0.0%) |
| 18 to 34 Years | 0 (0.0%) | 59 (37.3%) |
| 35 to 64 Years | 33 (10.2%) | 12 (5.2%) |
| 65 to 74 Years | 0 (0.0%) | 0 (0.0%) |
| 75 Years and over | 0 (0.0%) | 0 (0.0%) |
Disability Class: Cognitive Difficulty
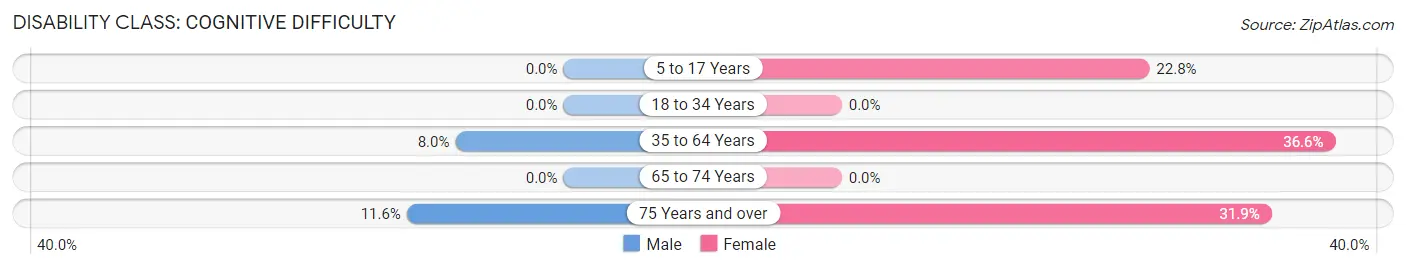
| Age Bracket | Male | Female |
| 5 to 17 Years | 0 (0.0%) | 45 (22.8%) |
| 18 to 34 Years | 0 (0.0%) | 0 (0.0%) |
| 35 to 64 Years | 26 (8.0%) | 85 (36.6%) |
| 65 to 74 Years | 0 (0.0%) | 0 (0.0%) |
| 75 Years and over | 5 (11.6%) | 15 (31.9%) |
Disability Class: Ambulatory Difficulty
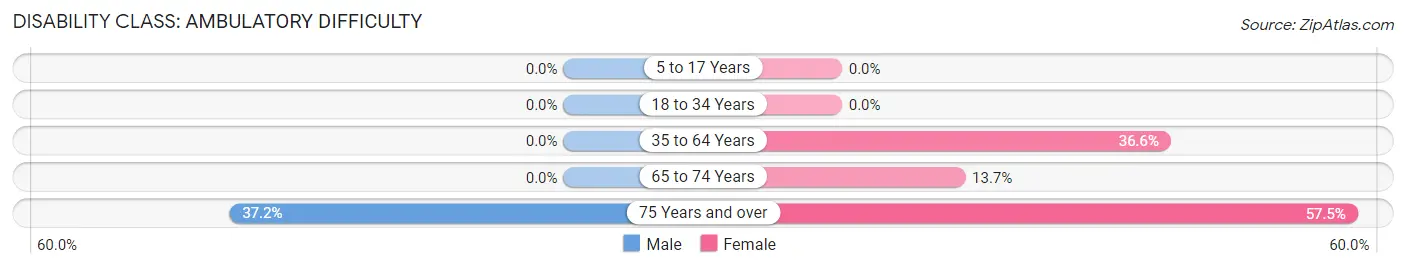
| Age Bracket | Male | Female |
| 5 to 17 Years | 0 (0.0%) | 0 (0.0%) |
| 18 to 34 Years | 0 (0.0%) | 0 (0.0%) |
| 35 to 64 Years | 0 (0.0%) | 85 (36.6%) |
| 65 to 74 Years | 0 (0.0%) | 7 (13.7%) |
| 75 Years and over | 16 (37.2%) | 27 (57.5%) |
Disability Class: Self-Care Difficulty
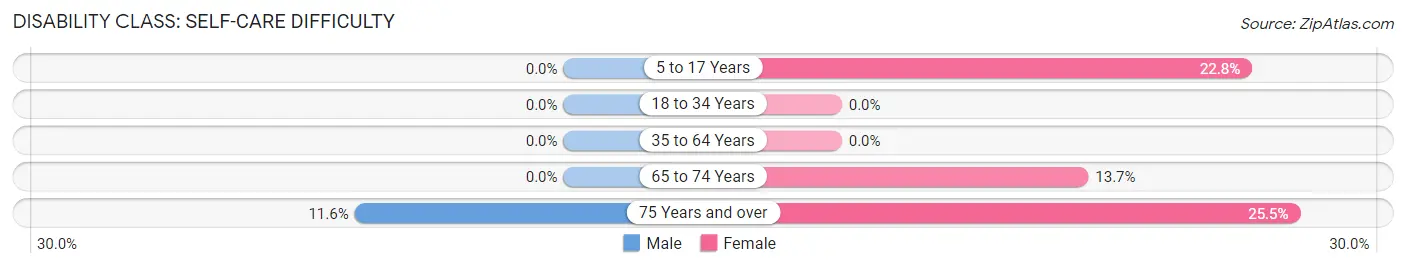
| Age Bracket | Male | Female |
| 5 to 17 Years | 0 (0.0%) | 45 (22.8%) |
| 18 to 34 Years | 0 (0.0%) | 0 (0.0%) |
| 35 to 64 Years | 0 (0.0%) | 0 (0.0%) |
| 65 to 74 Years | 0 (0.0%) | 7 (13.7%) |
| 75 Years and over | 5 (11.6%) | 12 (25.5%) |
Technology Access in Banner Hill
Computing Device Access in Banner Hill
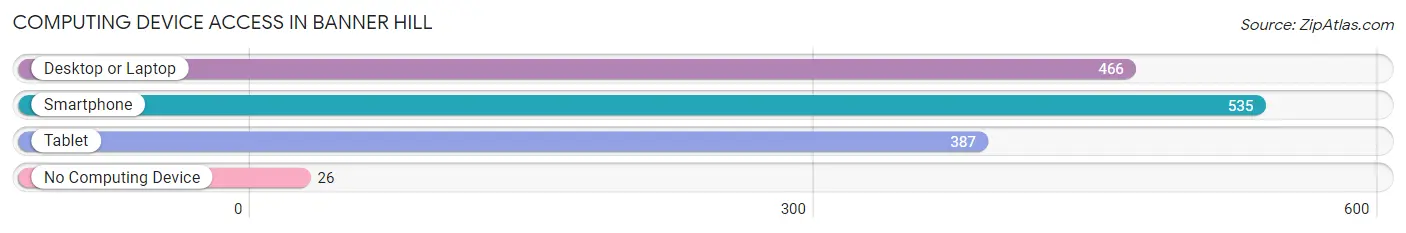
| Device Type | # Households | % Households |
| Desktop or Laptop | 466 | 83.1% |
| Smartphone | 535 | 95.4% |
| Tablet | 387 | 69.0% |
| No Computing Device | 26 | 4.6% |
| Total | 561 | 100.0% |
Internet Access in Banner Hill
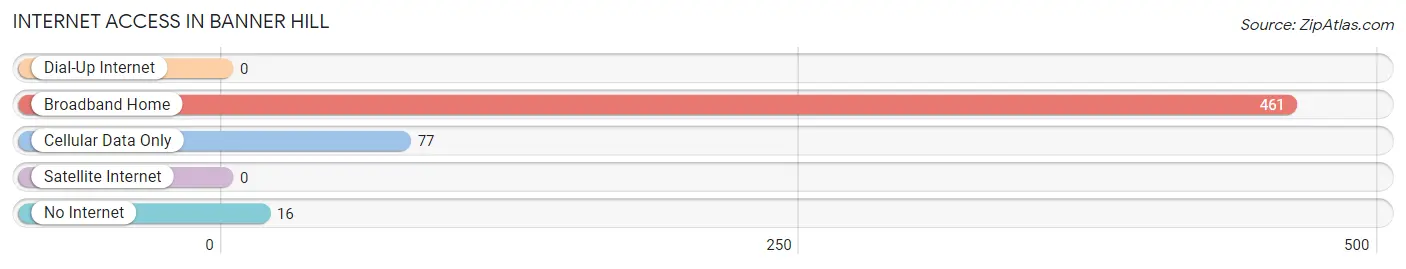
| Internet Type | # Households | % Households |
| Dial-Up Internet | 0 | 0.0% |
| Broadband Home | 461 | 82.2% |
| Cellular Data Only | 77 | 13.7% |
| Satellite Internet | 0 | 0.0% |
| No Internet | 16 | 2.9% |
| Total | 561 | 100.0% |
Banner Hill Summary
Banner Hill is a small unincorporated community located in the state of Tennessee, in the United States of America. It is situated in the eastern part of the state, in the foothills of the Appalachian Mountains. The community is located in the county of Hawkins, and is part of the Kingsport-Bristol-Bristol metropolitan statistical area.
History
Banner Hill was first settled in the early 1800s by a group of settlers from North Carolina. The community was named after a nearby hill, which was said to have been used as a signal point for the local militia during the Revolutionary War. The first post office in the area was established in 1845, and the community was officially incorporated in 1848.
The community was largely agricultural in nature, with the main crops being corn, wheat, and tobacco. The area was also known for its production of moonshine, which was made from the local corn and wheat.
In the late 1800s, the community began to experience a period of growth and development. The railroad was extended to the area, and a number of businesses were established, including a sawmill, a gristmill, and a general store. The community also had a school, a church, and a post office.
Geography
Banner Hill is located in the eastern part of Tennessee, in the foothills of the Appalachian Mountains. The community is situated in the county of Hawkins, and is part of the Kingsport-Bristol-Bristol metropolitan statistical area. The area is characterized by rolling hills and valleys, with the highest point in the area being Banner Hill, which is 1,845 feet above sea level.
The climate in the area is generally mild, with temperatures ranging from the low 30s in the winter to the mid-80s in the summer. The area receives an average of 45 inches of precipitation per year, with most of it falling in the form of rain.
Economy
The economy of Banner Hill is largely based on agriculture. The main crops grown in the area are corn, wheat, and tobacco. The area is also known for its production of moonshine, which is made from the local corn and wheat.
In addition to agriculture, the area is also home to a number of small businesses, including a sawmill, a gristmill, and a general store. The area is also home to a number of tourist attractions, including a historic church, a museum, and a number of hiking trails.
Demographics
As of the 2010 census, the population of Banner Hill was 1,092. The racial makeup of the community was 97.3% White, 0.9% African American, 0.2% Native American, 0.2% Asian, and 1.4% from other races. The median household income in the area was $31,250, and the median age was 41.7 years.
Conclusion
Banner Hill is a small unincorporated community located in the eastern part of Tennessee, in the foothills of the Appalachian Mountains. The community was first settled in the early 1800s, and has since grown to become a largely agricultural area, with the main crops being corn, wheat, and tobacco. The area is also home to a number of small businesses, and is a popular tourist destination due to its historic church, museum, and hiking trails. The population of Banner Hill was 1,092 as of the 2010 census, and the median household income was $31,250.
Common Questions
What is Per Capita Income in Banner Hill?
Per Capita income in Banner Hill is $34,404.
What is the Median Family Income in Banner Hill?
Median Family Income in Banner Hill is $80,972.
What is the Median Household income in Banner Hill?
Median Household Income in Banner Hill is $72,176.
What is Income or Wage Gap in Banner Hill?
Income or Wage Gap in Banner Hill is 7.2%.
Women in Banner Hill earn 92.8 cents for every dollar earned by a man.
What is Inequality or Gini Index in Banner Hill?
Inequality or Gini Index in Banner Hill is 0.39.
What is the Total Population of Banner Hill?
Total Population of Banner Hill is 1,571.
What is the Total Male Population of Banner Hill?
Total Male Population of Banner Hill is 802.
What is the Total Female Population of Banner Hill?
Total Female Population of Banner Hill is 769.
What is the Ratio of Males per 100 Females in Banner Hill?
There are 104.29 Males per 100 Females in Banner Hill.
What is the Ratio of Females per 100 Males in Banner Hill?
There are 95.89 Females per 100 Males in Banner Hill.
What is the Median Population Age in Banner Hill?
Median Population Age in Banner Hill is 42.9 Years.
What is the Average Family Size in Banner Hill
Average Family Size in Banner Hill is 2.9 People.
What is the Average Household Size in Banner Hill
Average Household Size in Banner Hill is 2.6 People.
How Large is the Labor Force in Banner Hill?
There are 746 People in the Labor Forcein in Banner Hill.
What is the Percentage of People in the Labor Force in Banner Hill?
61.8% of People are in the Labor Force in Banner Hill.
What is the Unemployment Rate in Banner Hill?
Unemployment Rate in Banner Hill is 7.9%.