Zip Codes with the Highest Percentage of Population Employed in Health Diagnosing & Treating in Cleveland, TN
RELATED REPORTS & OPTIONS
Health Diagnosing & Treating
Cleveland
Compare Zip Codes
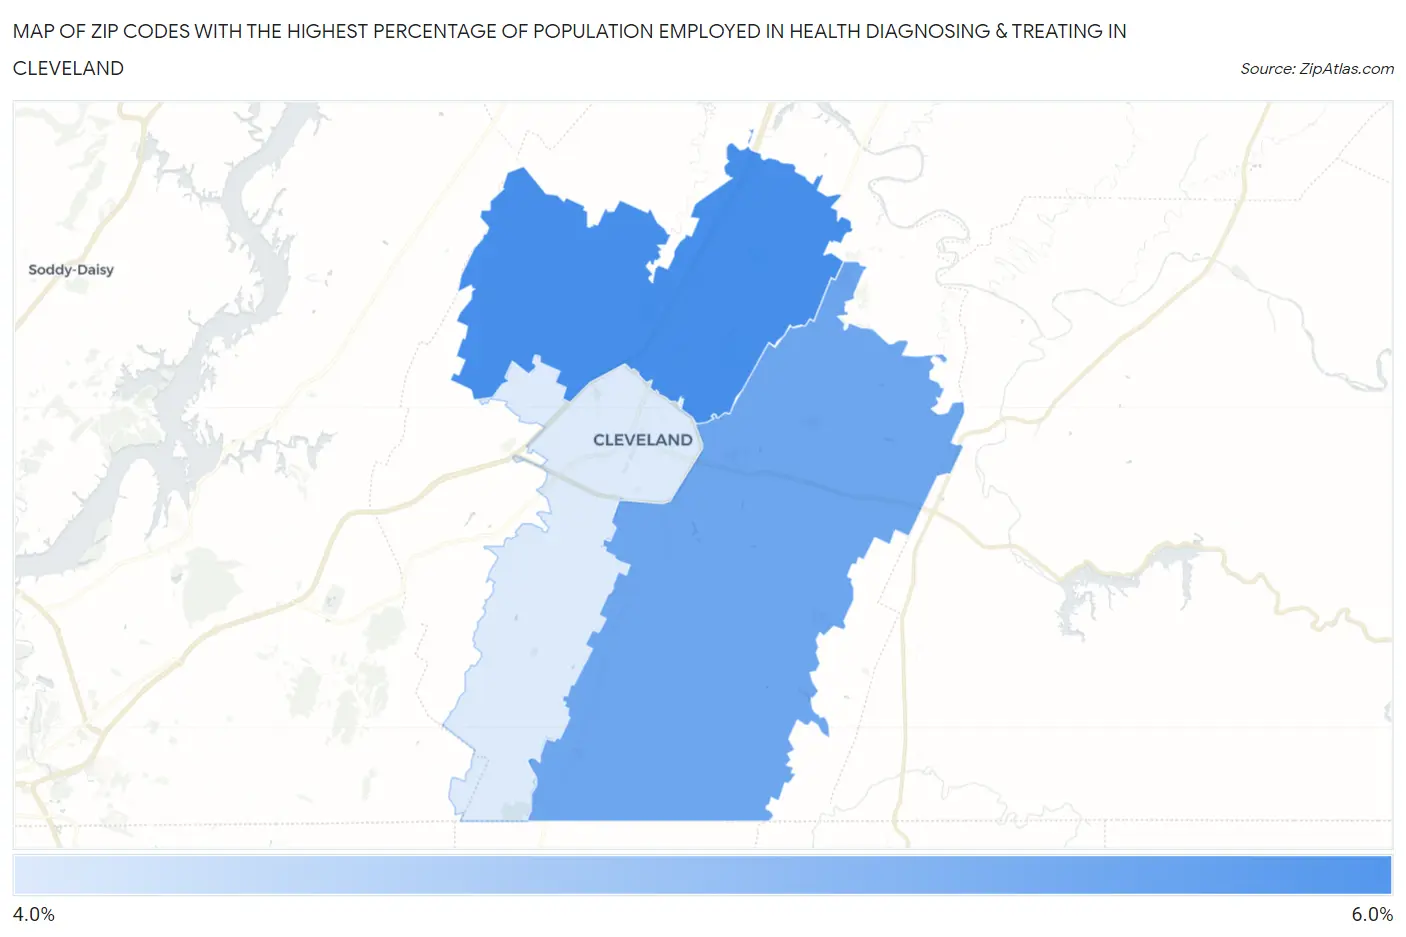
Map of Zip Codes with the Highest Percentage of Population Employed in Health Diagnosing & Treating in Cleveland
4.0%
5.5%
Zip Codes with the Highest Percentage of Population Employed in Health Diagnosing & Treating in Cleveland, TN
| Zip Code | % Employed | vs State | vs National | |
| 1. | 37312 | 5.5% | 6.9%(-1.32)#357 | 6.2%(-0.701)#15,619 |
| 2. | 37323 | 5.1% | 6.9%(-1.71)#386 | 6.2%(-1.10)#17,135 |
| 3. | 37311 | 4.0% | 6.9%(-2.82)#453 | 6.2%(-2.21)#21,247 |
1
Common Questions
What are the Top Zip Codes with the Highest Percentage of Population Employed in Health Diagnosing & Treating in Cleveland, TN?
Top Zip Codes with the Highest Percentage of Population Employed in Health Diagnosing & Treating in Cleveland, TN are:
What zip code has the Highest Percentage of Population Employed in Health Diagnosing & Treating in Cleveland, TN?
37312 has the Highest Percentage of Population Employed in Health Diagnosing & Treating in Cleveland, TN with 5.5%.
What is the Percentage of Population Employed in Health Diagnosing & Treating in Cleveland, TN?
Percentage of Population Employed in Health Diagnosing & Treating in Cleveland is 4.9%.
What is the Percentage of Population Employed in Health Diagnosing & Treating in Tennessee?
Percentage of Population Employed in Health Diagnosing & Treating in Tennessee is 6.9%.
What is the Percentage of Population Employed in Health Diagnosing & Treating in the United States?
Percentage of Population Employed in Health Diagnosing & Treating in the United States is 6.2%.