Zip Codes with the Highest Percentage of Population Employed in Health Diagnosing & Treating in Maryville, TN
RELATED REPORTS & OPTIONS
Health Diagnosing & Treating
Maryville
Compare Zip Codes
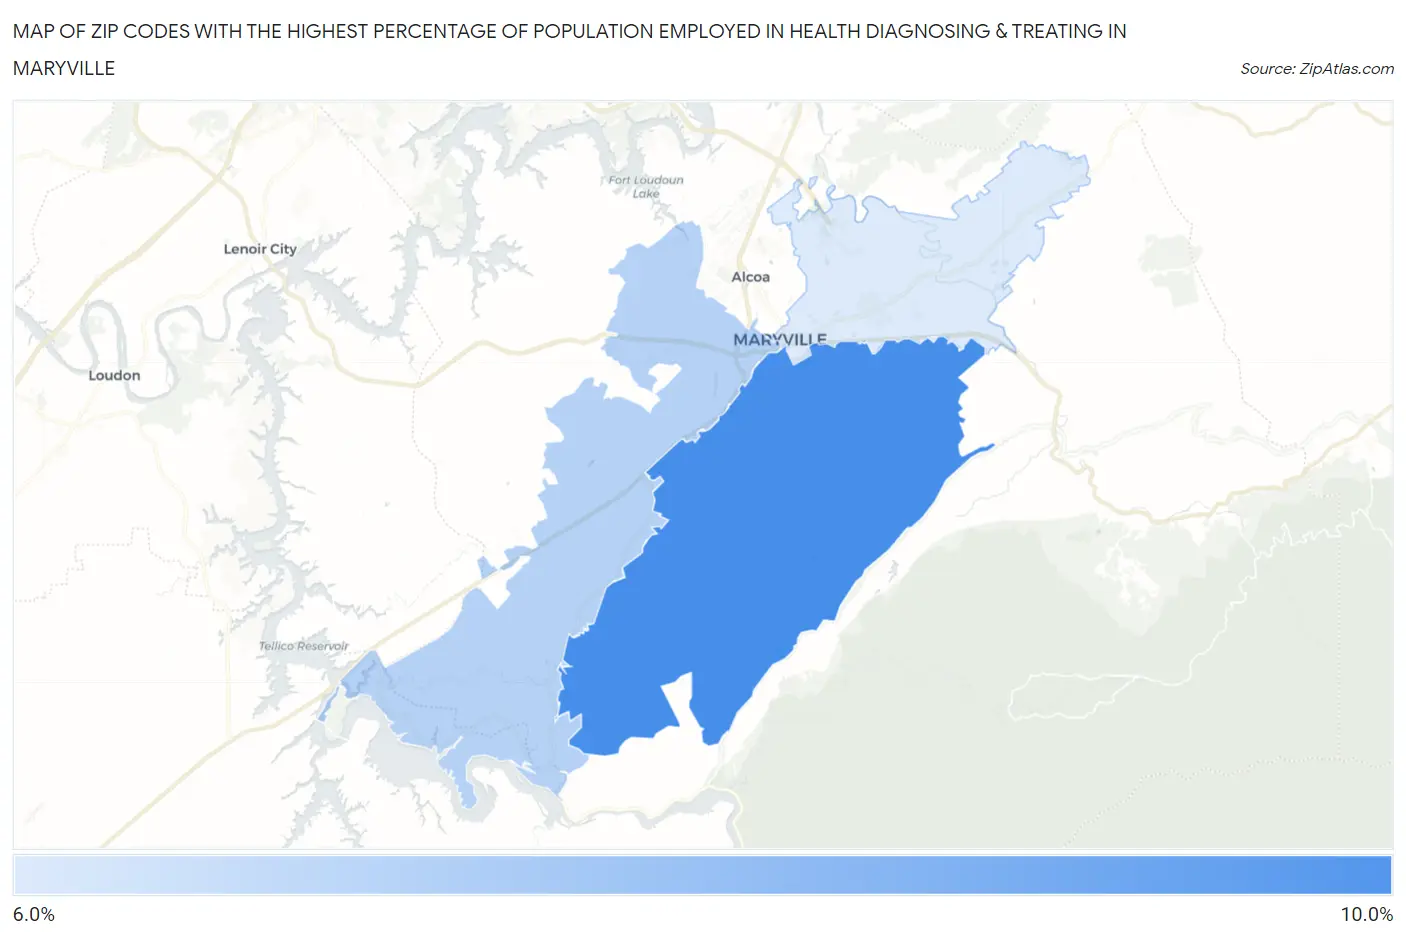
Map of Zip Codes with the Highest Percentage of Population Employed in Health Diagnosing & Treating in Maryville
6.4%
9.3%
Zip Codes with the Highest Percentage of Population Employed in Health Diagnosing & Treating in Maryville, TN
| Zip Code | % Employed | vs State | vs National | |
| 1. | 37803 | 9.3% | 6.9%(+2.44)#112 | 6.2%(+3.06)#4,856 |
| 2. | 37801 | 7.1% | 6.9%(+0.288)#241 | 6.2%(+0.905)#9,864 |
| 3. | 37804 | 6.4% | 6.9%(-0.489)#295 | 6.2%(+0.128)#12,495 |
1
Common Questions
What are the Top Zip Codes with the Highest Percentage of Population Employed in Health Diagnosing & Treating in Maryville, TN?
Top Zip Codes with the Highest Percentage of Population Employed in Health Diagnosing & Treating in Maryville, TN are:
What zip code has the Highest Percentage of Population Employed in Health Diagnosing & Treating in Maryville, TN?
37803 has the Highest Percentage of Population Employed in Health Diagnosing & Treating in Maryville, TN with 9.3%.
What is the Percentage of Population Employed in Health Diagnosing & Treating in Maryville, TN?
Percentage of Population Employed in Health Diagnosing & Treating in Maryville is 8.8%.
What is the Percentage of Population Employed in Health Diagnosing & Treating in Tennessee?
Percentage of Population Employed in Health Diagnosing & Treating in Tennessee is 6.9%.
What is the Percentage of Population Employed in Health Diagnosing & Treating in the United States?
Percentage of Population Employed in Health Diagnosing & Treating in the United States is 6.2%.