Zip Codes with the Highest Percentage of Population Employed in Health Diagnosing & Treating in Morristown, TN
RELATED REPORTS & OPTIONS
Health Diagnosing & Treating
Morristown
Compare Zip Codes
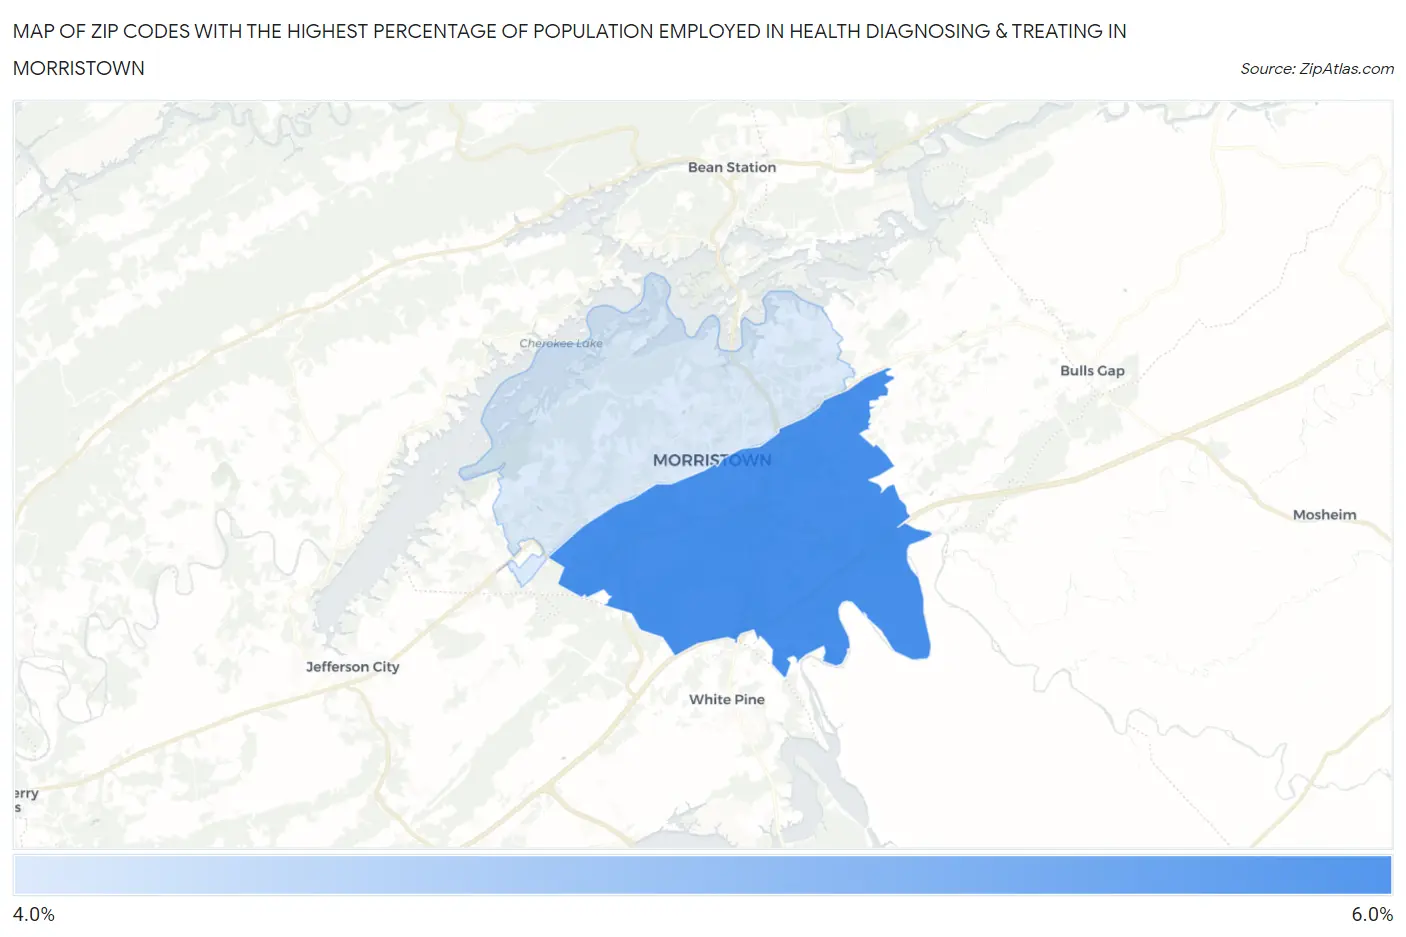
Map of Zip Codes with the Highest Percentage of Population Employed in Health Diagnosing & Treating in Morristown
4.3%
5.2%
Zip Codes with the Highest Percentage of Population Employed in Health Diagnosing & Treating in Morristown, TN
| Zip Code | % Employed | vs State | vs National | |
| 1. | 37813 | 5.2% | 6.9%(-1.63)#382 | 6.2%(-1.02)#16,829 |
| 2. | 37814 | 4.3% | 6.9%(-2.59)#444 | 6.2%(-1.98)#20,450 |
1
Common Questions
What are the Top Zip Codes with the Highest Percentage of Population Employed in Health Diagnosing & Treating in Morristown, TN?
Top Zip Codes with the Highest Percentage of Population Employed in Health Diagnosing & Treating in Morristown, TN are:
What zip code has the Highest Percentage of Population Employed in Health Diagnosing & Treating in Morristown, TN?
37813 has the Highest Percentage of Population Employed in Health Diagnosing & Treating in Morristown, TN with 5.2%.
What is the Percentage of Population Employed in Health Diagnosing & Treating in Morristown, TN?
Percentage of Population Employed in Health Diagnosing & Treating in Morristown is 4.5%.
What is the Percentage of Population Employed in Health Diagnosing & Treating in Tennessee?
Percentage of Population Employed in Health Diagnosing & Treating in Tennessee is 6.9%.
What is the Percentage of Population Employed in Health Diagnosing & Treating in the United States?
Percentage of Population Employed in Health Diagnosing & Treating in the United States is 6.2%.