Zip Codes with the Highest Percentage of Population Employed in Computer, Engineering & Science in Morristown, TN
RELATED REPORTS & OPTIONS
Computer, Engineering & Science
Morristown
Compare Zip Codes
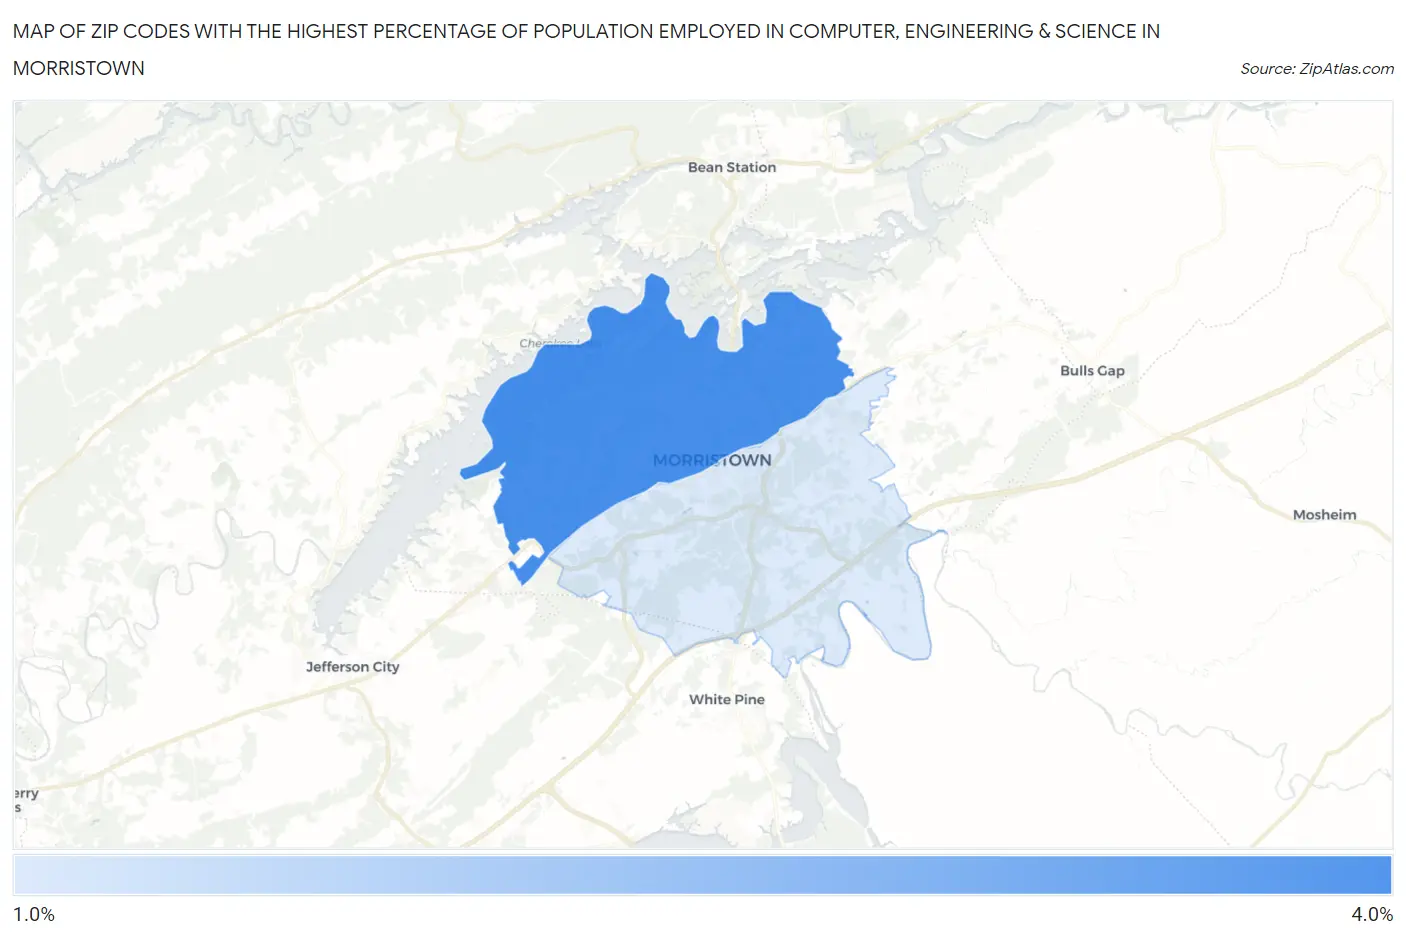
Map of Zip Codes with the Highest Percentage of Population Employed in Computer, Engineering & Science in Morristown
1.4%
3.5%
Zip Codes with the Highest Percentage of Population Employed in Computer, Engineering & Science in Morristown, TN
| Zip Code | % Employed | vs State | vs National | |
| 1. | 37814 | 3.5% | 5.1%(-1.54)#289 | 6.8%(-3.22)#16,092 |
| 2. | 37813 | 1.4% | 5.1%(-3.67)#477 | 6.8%(-5.36)#23,874 |
1
Common Questions
What are the Top Zip Codes with the Highest Percentage of Population Employed in Computer, Engineering & Science in Morristown, TN?
Top Zip Codes with the Highest Percentage of Population Employed in Computer, Engineering & Science in Morristown, TN are:
What zip code has the Highest Percentage of Population Employed in Computer, Engineering & Science in Morristown, TN?
37814 has the Highest Percentage of Population Employed in Computer, Engineering & Science in Morristown, TN with 3.5%.
What is the Percentage of Population Employed in Computer, Engineering & Science in Morristown, TN?
Percentage of Population Employed in Computer, Engineering & Science in Morristown is 2.3%.
What is the Percentage of Population Employed in Computer, Engineering & Science in Tennessee?
Percentage of Population Employed in Computer, Engineering & Science in Tennessee is 5.1%.
What is the Percentage of Population Employed in Computer, Engineering & Science in the United States?
Percentage of Population Employed in Computer, Engineering & Science in the United States is 6.8%.