Zip Codes with the Highest Percentage of Population Employed in Computer, Engineering & Science in Tennessee
RELATED REPORTS & OPTIONS
Computer, Engineering & Science
Tennessee
Compare Zip Codes
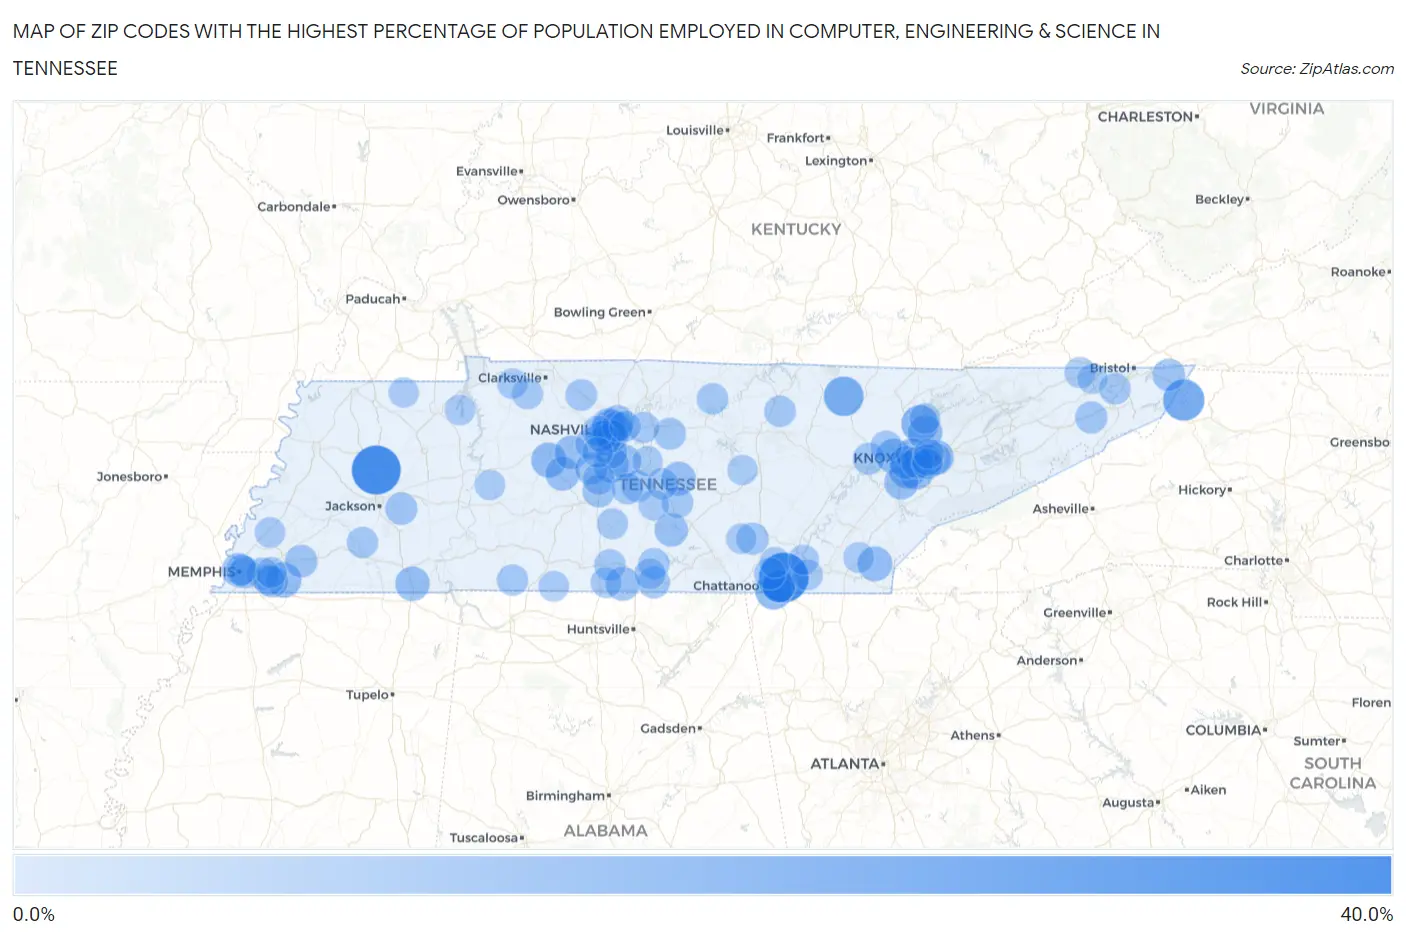
Map of Zip Codes with the Highest Percentage of Population Employed in Computer, Engineering & Science in Tennessee
0.0%
40.0%
Zip Codes with the Highest Percentage of Population Employed in Computer, Engineering & Science in Tennessee
| Zip Code | % Employed | vs State | vs National | |
| 1. | 37351 | 32.1% | 5.1%(+27.0)#1 | 6.8%(+25.3)#155 |
| 2. | 38338 | 31.2% | 5.1%(+26.2)#2 | 6.8%(+24.5)#161 |
| 3. | 37691 | 20.9% | 5.1%(+15.8)#3 | 6.8%(+14.1)#447 |
| 4. | 38504 | 18.7% | 5.1%(+13.6)#4 | 6.8%(+11.9)#622 |
| 5. | 37219 | 15.6% | 5.1%(+10.6)#5 | 6.8%(+8.87)#1,013 |
| 6. | 37828 | 15.4% | 5.1%(+10.3)#6 | 6.8%(+8.61)#1,056 |
| 7. | 37409 | 14.8% | 5.1%(+9.71)#7 | 6.8%(+8.02)#1,155 |
| 8. | 37934 | 14.6% | 5.1%(+9.53)#8 | 6.8%(+7.85)#1,193 |
| 9. | 37830 | 12.9% | 5.1%(+7.81)#9 | 6.8%(+6.13)#1,682 |
| 10. | 37067 | 12.8% | 5.1%(+7.72)#10 | 6.8%(+6.04)#1,715 |
| 11. | 38017 | 12.7% | 5.1%(+7.61)#11 | 6.8%(+5.92)#1,751 |
| 12. | 37025 | 12.7% | 5.1%(+7.58)#12 | 6.8%(+5.90)#1,763 |
| 13. | 37902 | 12.7% | 5.1%(+7.58)#13 | 6.8%(+5.90)#1,764 |
| 14. | 37402 | 12.7% | 5.1%(+7.58)#14 | 6.8%(+5.90)#1,765 |
| 15. | 37754 | 12.3% | 5.1%(+7.24)#15 | 6.8%(+5.56)#1,884 |
| 16. | 37369 | 12.1% | 5.1%(+6.98)#16 | 6.8%(+5.29)#2,014 |
| 17. | 38339 | 11.9% | 5.1%(+6.78)#17 | 6.8%(+5.10)#2,104 |
| 18. | 37922 | 11.7% | 5.1%(+6.64)#18 | 6.8%(+4.96)#2,164 |
| 19. | 37772 | 11.4% | 5.1%(+6.28)#19 | 6.8%(+4.59)#2,375 |
| 20. | 37149 | 11.3% | 5.1%(+6.25)#20 | 6.8%(+4.57)#2,388 |
| 21. | 38476 | 11.3% | 5.1%(+6.21)#21 | 6.8%(+4.53)#2,414 |
| 22. | 38103 | 11.3% | 5.1%(+6.21)#22 | 6.8%(+4.52)#2,419 |
| 23. | 38488 | 11.2% | 5.1%(+6.08)#23 | 6.8%(+4.40)#2,479 |
| 24. | 37228 | 11.1% | 5.1%(+6.01)#24 | 6.8%(+4.32)#2,519 |
| 25. | 37135 | 11.1% | 5.1%(+5.99)#25 | 6.8%(+4.31)#2,529 |
| 26. | 37931 | 11.0% | 5.1%(+5.88)#26 | 6.8%(+4.20)#2,596 |
| 27. | 37062 | 10.9% | 5.1%(+5.80)#27 | 6.8%(+4.11)#2,637 |
| 28. | 37932 | 10.5% | 5.1%(+5.46)#28 | 6.8%(+3.78)#2,840 |
| 29. | 37360 | 10.5% | 5.1%(+5.41)#29 | 6.8%(+3.73)#2,876 |
| 30. | 37203 | 10.2% | 5.1%(+5.09)#30 | 6.8%(+3.40)#3,097 |
| 31. | 37408 | 9.4% | 5.1%(+4.36)#31 | 6.8%(+2.67)#3,653 |
| 32. | 37688 | 9.4% | 5.1%(+4.29)#32 | 6.8%(+2.61)#3,703 |
| 33. | 38060 | 9.3% | 5.1%(+4.26)#33 | 6.8%(+2.58)#3,741 |
| 34. | 37174 | 9.3% | 5.1%(+4.26)#34 | 6.8%(+2.58)#3,742 |
| 35. | 37216 | 9.3% | 5.1%(+4.18)#35 | 6.8%(+2.49)#3,819 |
| 36. | 37064 | 9.2% | 5.1%(+4.12)#36 | 6.8%(+2.43)#3,866 |
| 37. | 38313 | 9.2% | 5.1%(+4.09)#37 | 6.8%(+2.40)#3,902 |
| 38. | 37916 | 9.2% | 5.1%(+4.08)#38 | 6.8%(+2.40)#3,907 |
| 39. | 37365 | 9.0% | 5.1%(+3.96)#39 | 6.8%(+2.27)#4,024 |
| 40. | 38120 | 8.9% | 5.1%(+3.80)#40 | 6.8%(+2.11)#4,194 |
| 41. | 37690 | 8.9% | 5.1%(+3.77)#41 | 6.8%(+2.09)#4,211 |
| 42. | 37221 | 8.8% | 5.1%(+3.77)#42 | 6.8%(+2.08)#4,214 |
| 43. | 37923 | 8.8% | 5.1%(+3.73)#43 | 6.8%(+2.05)#4,250 |
| 44. | 37027 | 8.7% | 5.1%(+3.60)#44 | 6.8%(+1.91)#4,398 |
| 45. | 37335 | 8.7% | 5.1%(+3.59)#45 | 6.8%(+1.90)#4,406 |
| 46. | 37090 | 8.6% | 5.1%(+3.52)#46 | 6.8%(+1.84)#4,481 |
| 47. | 37212 | 8.6% | 5.1%(+3.50)#47 | 6.8%(+1.81)#4,514 |
| 48. | 37179 | 8.6% | 5.1%(+3.47)#48 | 6.8%(+1.79)#4,552 |
| 49. | 37748 | 8.5% | 5.1%(+3.46)#49 | 6.8%(+1.77)#4,571 |
| 50. | 37405 | 8.5% | 5.1%(+3.37)#50 | 6.8%(+1.69)#4,657 |
| 51. | 38104 | 8.4% | 5.1%(+3.29)#51 | 6.8%(+1.61)#4,747 |
| 52. | 38139 | 8.4% | 5.1%(+3.28)#52 | 6.8%(+1.60)#4,755 |
| 53. | 37204 | 8.3% | 5.1%(+3.22)#53 | 6.8%(+1.54)#4,858 |
| 54. | 37146 | 8.3% | 5.1%(+3.20)#54 | 6.8%(+1.51)#4,899 |
| 55. | 38459 | 8.2% | 5.1%(+3.14)#55 | 6.8%(+1.45)#4,970 |
| 56. | 38580 | 8.2% | 5.1%(+3.12)#56 | 6.8%(+1.43)#4,996 |
| 57. | 37686 | 8.1% | 5.1%(+3.03)#57 | 6.8%(+1.35)#5,105 |
| 58. | 37153 | 8.1% | 5.1%(+3.02)#58 | 6.8%(+1.34)#5,127 |
| 59. | 37018 | 8.1% | 5.1%(+2.98)#59 | 6.8%(+1.29)#5,195 |
| 60. | 37145 | 8.0% | 5.1%(+2.94)#60 | 6.8%(+1.25)#5,248 |
| 61. | 37359 | 8.0% | 5.1%(+2.92)#61 | 6.8%(+1.24)#5,262 |
| 62. | 37060 | 7.9% | 5.1%(+2.85)#62 | 6.8%(+1.17)#5,358 |
| 63. | 37909 | 7.9% | 5.1%(+2.80)#63 | 6.8%(+1.11)#5,435 |
| 64. | 37127 | 7.9% | 5.1%(+2.80)#64 | 6.8%(+1.11)#5,440 |
| 65. | 37840 | 7.8% | 5.1%(+2.74)#65 | 6.8%(+1.05)#5,523 |
| 66. | 38463 | 7.8% | 5.1%(+2.72)#66 | 6.8%(+1.03)#5,549 |
| 67. | 38381 | 7.8% | 5.1%(+2.71)#67 | 6.8%(+1.02)#5,563 |
| 68. | 37215 | 7.7% | 5.1%(+2.62)#68 | 6.8%(+0.932)#5,687 |
| 69. | 37205 | 7.7% | 5.1%(+2.57)#69 | 6.8%(+0.886)#5,753 |
| 70. | 38138 | 7.6% | 5.1%(+2.56)#70 | 6.8%(+0.873)#5,777 |
| 71. | 37645 | 7.6% | 5.1%(+2.48)#71 | 6.8%(+0.796)#5,898 |
| 72. | 37122 | 7.5% | 5.1%(+2.46)#72 | 6.8%(+0.776)#5,929 |
| 73. | 38105 | 7.5% | 5.1%(+2.41)#73 | 6.8%(+0.726)#6,006 |
| 74. | 38449 | 7.5% | 5.1%(+2.37)#74 | 6.8%(+0.687)#6,071 |
| 75. | 37142 | 7.4% | 5.1%(+2.36)#75 | 6.8%(+0.673)#6,093 |
| 76. | 37348 | 7.4% | 5.1%(+2.34)#76 | 6.8%(+0.661)#6,115 |
| 77. | 37206 | 7.4% | 5.1%(+2.34)#77 | 6.8%(+0.657)#6,123 |
| 78. | 37919 | 7.4% | 5.1%(+2.33)#78 | 6.8%(+0.647)#6,149 |
| 79. | 37209 | 7.4% | 5.1%(+2.32)#79 | 6.8%(+0.636)#6,164 |
| 80. | 37377 | 7.4% | 5.1%(+2.30)#80 | 6.8%(+0.620)#6,202 |
| 81. | 37214 | 7.3% | 5.1%(+2.25)#81 | 6.8%(+0.568)#6,269 |
| 82. | 37091 | 7.3% | 5.1%(+2.23)#82 | 6.8%(+0.550)#6,282 |
| 83. | 38018 | 7.3% | 5.1%(+2.21)#83 | 6.8%(+0.527)#6,320 |
| 84. | 37705 | 7.3% | 5.1%(+2.18)#84 | 6.8%(+0.497)#6,366 |
| 85. | 37325 | 7.2% | 5.1%(+2.13)#85 | 6.8%(+0.441)#6,447 |
| 86. | 37020 | 7.2% | 5.1%(+2.12)#86 | 6.8%(+0.439)#6,454 |
| 87. | 37363 | 7.2% | 5.1%(+2.10)#87 | 6.8%(+0.415)#6,492 |
| 88. | 37069 | 7.1% | 5.1%(+2.03)#88 | 6.8%(+0.347)#6,615 |
| 89. | 37079 | 6.9% | 5.1%(+1.80)#89 | 6.8%(+0.121)#6,999 |
| 90. | 38004 | 6.9% | 5.1%(+1.80)#90 | 6.8%(+0.119)#7,004 |
| 91. | 38457 | 6.9% | 5.1%(+1.77)#91 | 6.8%(+0.089)#7,055 |
| 92. | 37341 | 6.8% | 5.1%(+1.76)#92 | 6.8%(+0.081)#7,074 |
| 93. | 37129 | 6.8% | 5.1%(+1.73)#93 | 6.8%(+0.044)#7,137 |
| 94. | 38256 | 6.8% | 5.1%(+1.68)#94 | 6.8%(+0.001)#7,214 |
| 95. | 37097 | 6.7% | 5.1%(+1.66)#95 | 6.8%(-0.023)#7,263 |
| 96. | 37339 | 6.6% | 5.1%(+1.52)#96 | 6.8%(-0.164)#7,541 |
| 97. | 37660 | 6.6% | 5.1%(+1.50)#97 | 6.8%(-0.181)#7,562 |
| 98. | 38587 | 6.6% | 5.1%(+1.50)#98 | 6.8%(-0.182)#7,567 |
| 99. | 38241 | 6.6% | 5.1%(+1.48)#99 | 6.8%(-0.201)#7,618 |
| 100. | 37921 | 6.5% | 5.1%(+1.42)#100 | 6.8%(-0.260)#7,729 |
Common Questions
What are the Top 10 Zip Codes with the Highest Percentage of Population Employed in Computer, Engineering & Science in Tennessee?
Top 10 Zip Codes with the Highest Percentage of Population Employed in Computer, Engineering & Science in Tennessee are:
What zip code has the Highest Percentage of Population Employed in Computer, Engineering & Science in Tennessee?
37351 has the Highest Percentage of Population Employed in Computer, Engineering & Science in Tennessee with 32.1%.
What is the Percentage of Population Employed in Computer, Engineering & Science in the State of Tennessee?
Percentage of Population Employed in Computer, Engineering & Science in Tennessee is 5.1%.
What is the Percentage of Population Employed in Computer, Engineering & Science in the United States?
Percentage of Population Employed in Computer, Engineering & Science in the United States is 6.8%.