Zip Codes with the Highest Percentage of Population Employed in Computer, Engineering & Science in Maryville, TN
RELATED REPORTS & OPTIONS
Computer, Engineering & Science
Maryville
Compare Zip Codes
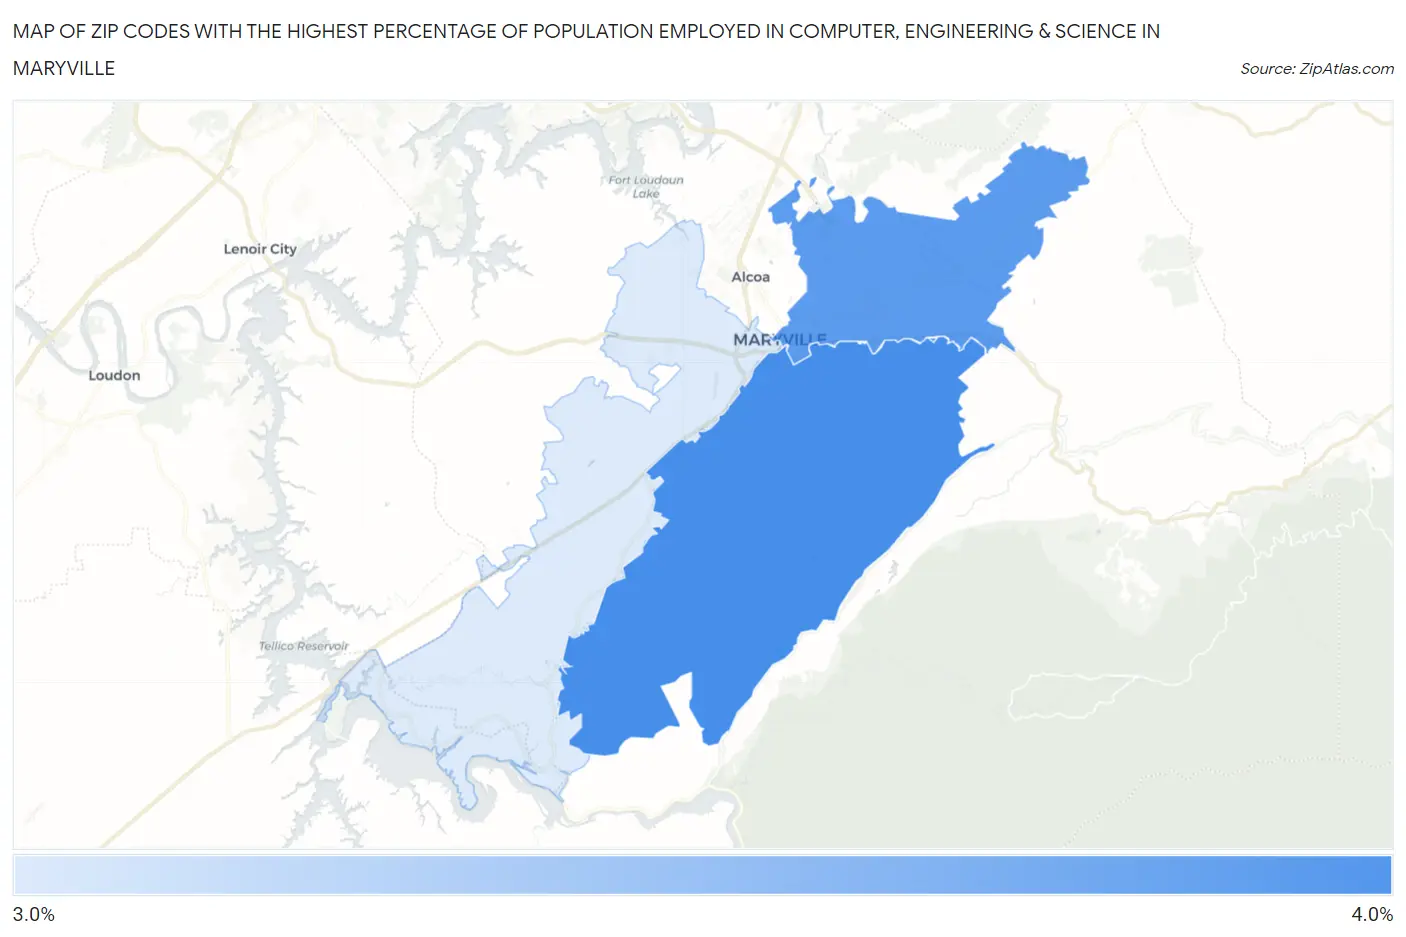
Map of Zip Codes with the Highest Percentage of Population Employed in Computer, Engineering & Science in Maryville
3.1%
3.8%
Zip Codes with the Highest Percentage of Population Employed in Computer, Engineering & Science in Maryville, TN
| Zip Code | % Employed | vs State | vs National | |
| 1. | 37803 | 3.8% | 5.1%(-1.33)#267 | 6.8%(-3.01)#15,304 |
| 2. | 37804 | 3.7% | 5.1%(-1.42)#275 | 6.8%(-3.10)#15,610 |
| 3. | 37801 | 3.1% | 5.1%(-1.98)#318 | 6.8%(-3.66)#17,729 |
1
Common Questions
What are the Top Zip Codes with the Highest Percentage of Population Employed in Computer, Engineering & Science in Maryville, TN?
Top Zip Codes with the Highest Percentage of Population Employed in Computer, Engineering & Science in Maryville, TN are:
What zip code has the Highest Percentage of Population Employed in Computer, Engineering & Science in Maryville, TN?
37803 has the Highest Percentage of Population Employed in Computer, Engineering & Science in Maryville, TN with 3.8%.
What is the Percentage of Population Employed in Computer, Engineering & Science in Maryville, TN?
Percentage of Population Employed in Computer, Engineering & Science in Maryville is 4.2%.
What is the Percentage of Population Employed in Computer, Engineering & Science in Tennessee?
Percentage of Population Employed in Computer, Engineering & Science in Tennessee is 5.1%.
What is the Percentage of Population Employed in Computer, Engineering & Science in the United States?
Percentage of Population Employed in Computer, Engineering & Science in the United States is 6.8%.