Zip Codes with the Highest Percentage of Population Employed in Computer, Engineering & Science in Crossville, TN
RELATED REPORTS & OPTIONS
Computer, Engineering & Science
Crossville
Compare Zip Codes
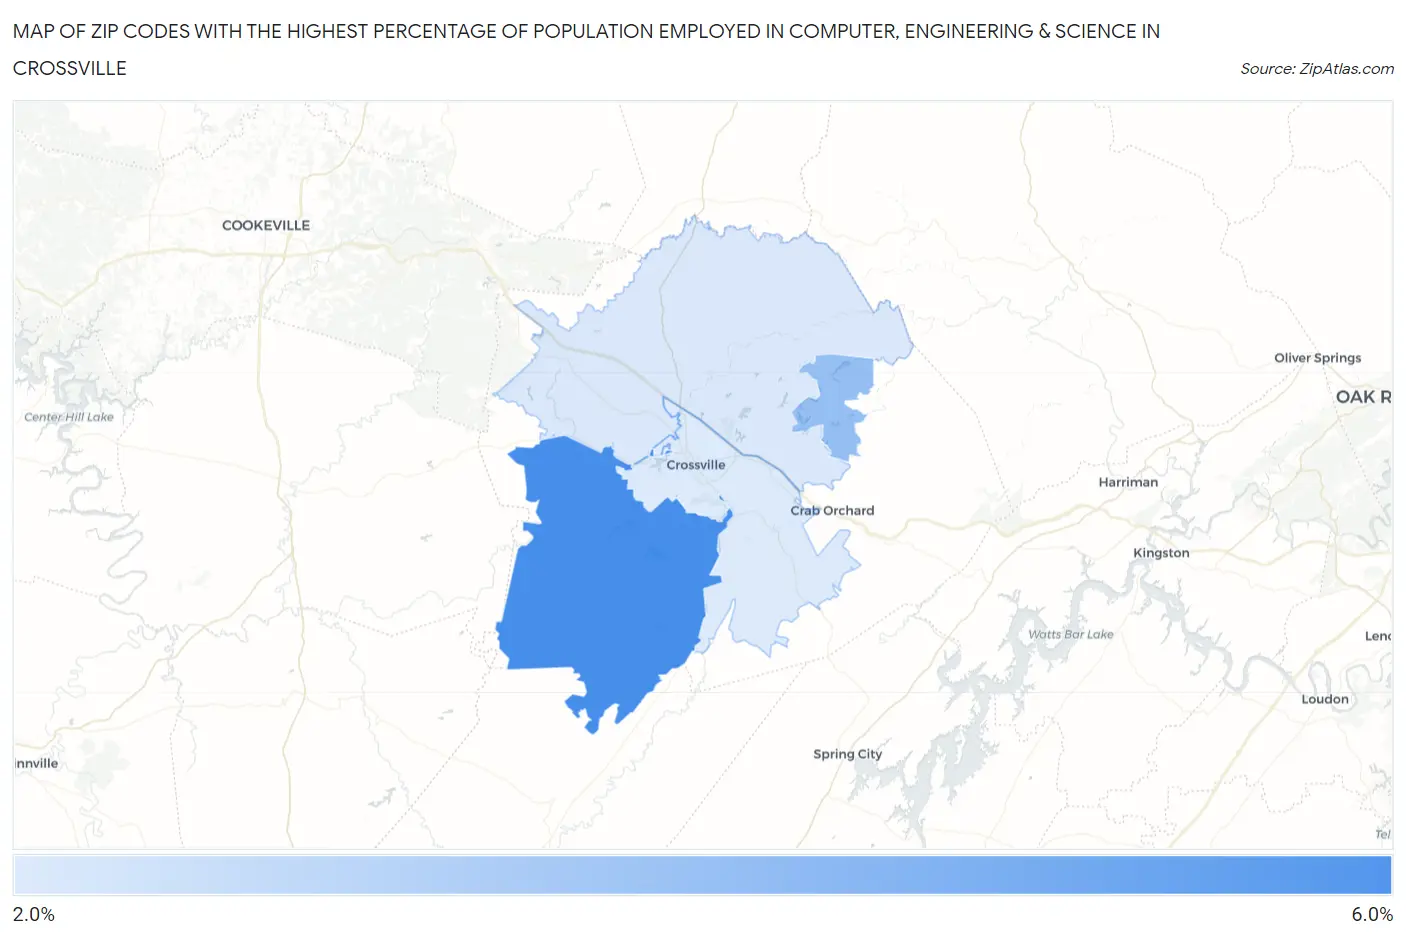
Map of Zip Codes with the Highest Percentage of Population Employed in Computer, Engineering & Science in Crossville
2.3%
5.2%
Zip Codes with the Highest Percentage of Population Employed in Computer, Engineering & Science in Crossville, TN
| Zip Code | % Employed | vs State | vs National | |
| 1. | 38572 | 5.2% | 5.1%(+0.169)#162 | 6.8%(-1.51)#10,694 |
| 2. | 38558 | 3.7% | 5.1%(-1.39)#273 | 6.8%(-3.07)#15,489 |
| 3. | 38571 | 2.4% | 5.1%(-2.73)#384 | 6.8%(-4.41)#20,561 |
| 4. | 38555 | 2.3% | 5.1%(-2.78)#385 | 6.8%(-4.46)#20,741 |
1
Common Questions
What are the Top 3 Zip Codes with the Highest Percentage of Population Employed in Computer, Engineering & Science in Crossville, TN?
Top 3 Zip Codes with the Highest Percentage of Population Employed in Computer, Engineering & Science in Crossville, TN are:
What zip code has the Highest Percentage of Population Employed in Computer, Engineering & Science in Crossville, TN?
38572 has the Highest Percentage of Population Employed in Computer, Engineering & Science in Crossville, TN with 5.2%.
What is the Percentage of Population Employed in Computer, Engineering & Science in Crossville, TN?
Percentage of Population Employed in Computer, Engineering & Science in Crossville is 1.6%.
What is the Percentage of Population Employed in Computer, Engineering & Science in Tennessee?
Percentage of Population Employed in Computer, Engineering & Science in Tennessee is 5.1%.
What is the Percentage of Population Employed in Computer, Engineering & Science in the United States?
Percentage of Population Employed in Computer, Engineering & Science in the United States is 6.8%.