Zip Codes with the Highest Percentage of Population Employed in Accommodation & Food Services in Rock Hill, SC
RELATED REPORTS & OPTIONS
Accommodation & Food Services
Rock Hill
Compare Zip Codes
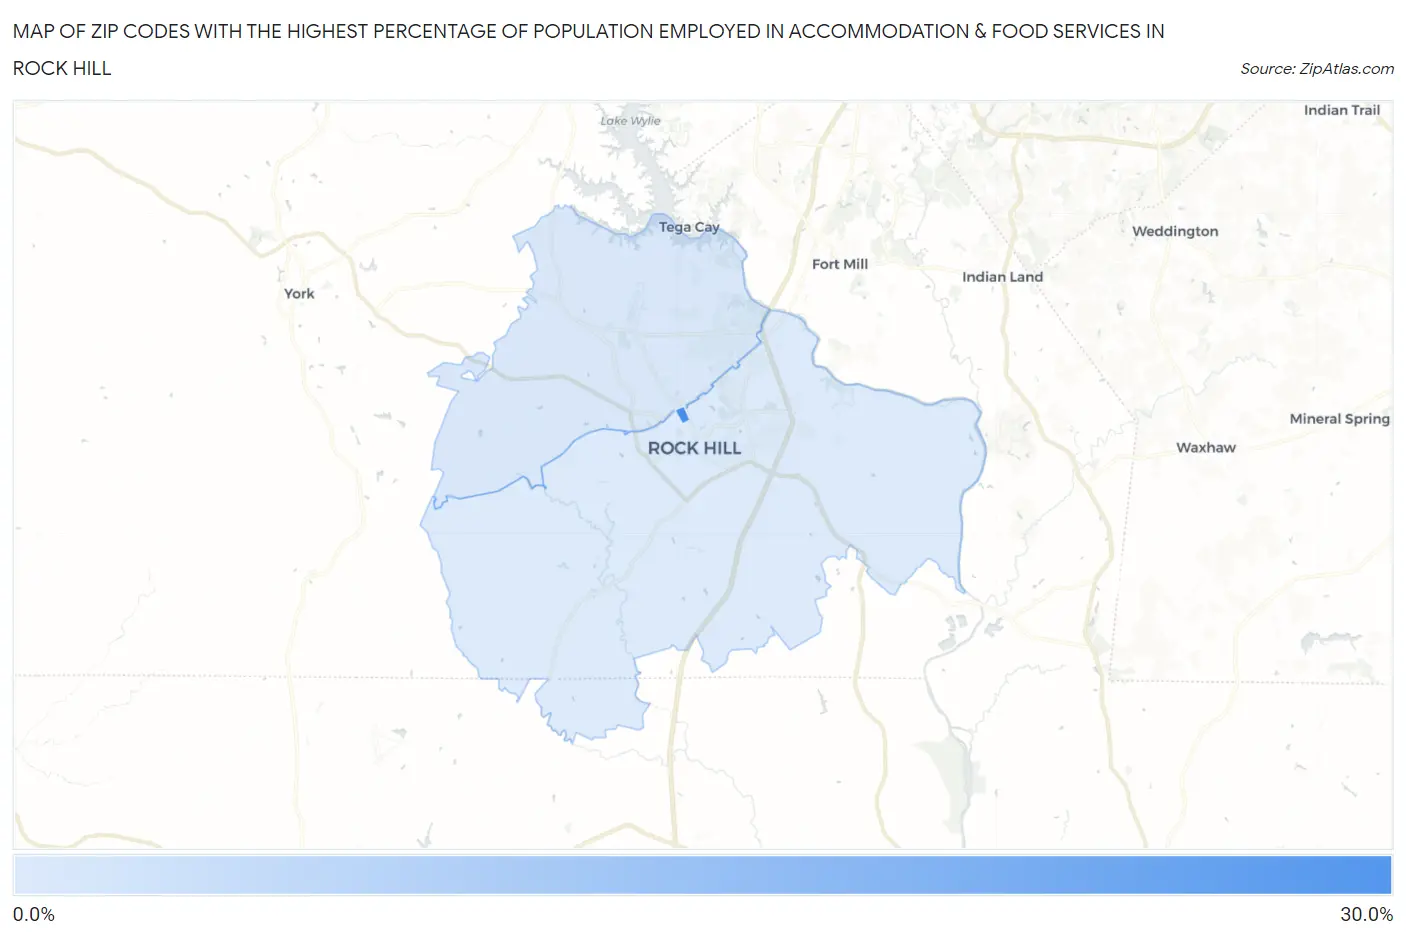
Map of Zip Codes with the Highest Percentage of Population Employed in Accommodation & Food Services in Rock Hill
8.0%
26.0%
Zip Codes with the Highest Percentage of Population Employed in Accommodation & Food Services in Rock Hill, SC
| Zip Code | % Employed | vs State | vs National | |
| 1. | 29733 | 26.0% | 8.0%(+18.0)#6 | 6.9%(+19.1)#463 |
| 2. | 29732 | 8.4% | 8.0%(+0.430)#126 | 6.9%(+1.52)#6,999 |
| 3. | 29730 | 8.0% | 8.0%(+0.036)#140 | 6.9%(+1.13)#7,809 |
1
Common Questions
What are the Top Zip Codes with the Highest Percentage of Population Employed in Accommodation & Food Services in Rock Hill, SC?
Top Zip Codes with the Highest Percentage of Population Employed in Accommodation & Food Services in Rock Hill, SC are:
What zip code has the Highest Percentage of Population Employed in Accommodation & Food Services in Rock Hill, SC?
29733 has the Highest Percentage of Population Employed in Accommodation & Food Services in Rock Hill, SC with 26.0%.
What is the Percentage of Population Employed in Accommodation & Food Services in Rock Hill, SC?
Percentage of Population Employed in Accommodation & Food Services in Rock Hill is 8.9%.
What is the Percentage of Population Employed in Accommodation & Food Services in South Carolina?
Percentage of Population Employed in Accommodation & Food Services in South Carolina is 8.0%.
What is the Percentage of Population Employed in Accommodation & Food Services in the United States?
Percentage of Population Employed in Accommodation & Food Services in the United States is 6.9%.