Zip Codes with the Highest Percentage of Population Employed in Accommodation & Food Services in Greenwood, SC
RELATED REPORTS & OPTIONS
Accommodation & Food Services
Greenwood
Compare Zip Codes
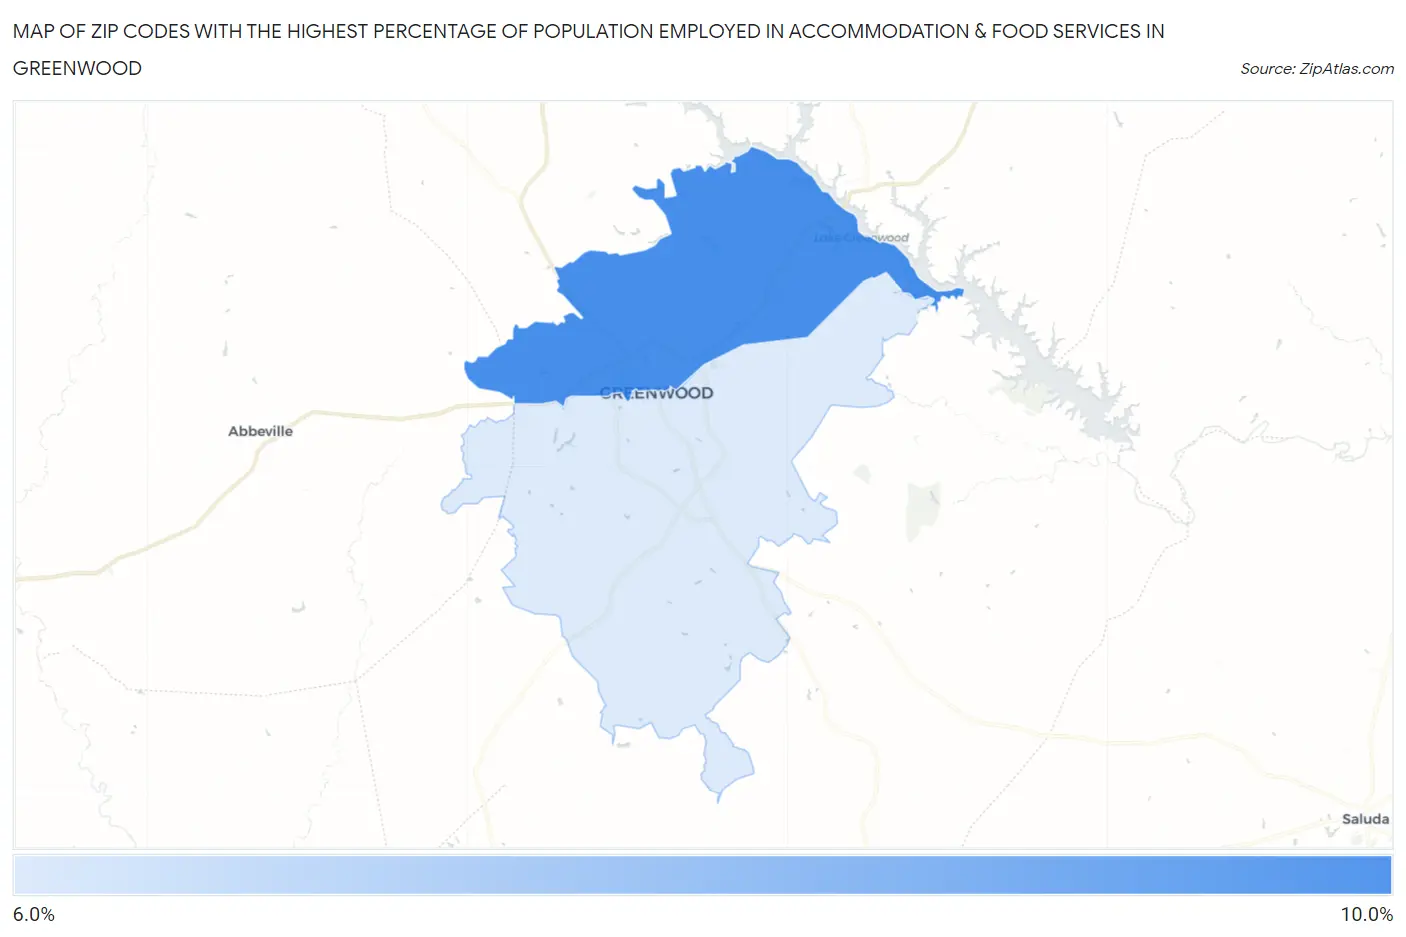
Map of Zip Codes with the Highest Percentage of Population Employed in Accommodation & Food Services in Greenwood
6.0%
9.3%
Zip Codes with the Highest Percentage of Population Employed in Accommodation & Food Services in Greenwood, SC
| Zip Code | % Employed | vs State | vs National | |
| 1. | 29649 | 9.3% | 8.0%(+1.36)#104 | 6.9%(+2.45)#5,454 |
| 2. | 29646 | 6.0% | 8.0%(-1.94)#223 | 6.9%(-0.853)#13,362 |
1
Common Questions
What are the Top Zip Codes with the Highest Percentage of Population Employed in Accommodation & Food Services in Greenwood, SC?
Top Zip Codes with the Highest Percentage of Population Employed in Accommodation & Food Services in Greenwood, SC are:
What zip code has the Highest Percentage of Population Employed in Accommodation & Food Services in Greenwood, SC?
29649 has the Highest Percentage of Population Employed in Accommodation & Food Services in Greenwood, SC with 9.3%.
What is the Percentage of Population Employed in Accommodation & Food Services in Greenwood, SC?
Percentage of Population Employed in Accommodation & Food Services in Greenwood is 11.0%.
What is the Percentage of Population Employed in Accommodation & Food Services in South Carolina?
Percentage of Population Employed in Accommodation & Food Services in South Carolina is 8.0%.
What is the Percentage of Population Employed in Accommodation & Food Services in the United States?
Percentage of Population Employed in Accommodation & Food Services in the United States is 6.9%.