Zip Codes with the Highest Percentage of Population Employed in Accommodation & Food Services in Darlington, SC
RELATED REPORTS & OPTIONS
Accommodation & Food Services
Darlington
Compare Zip Codes
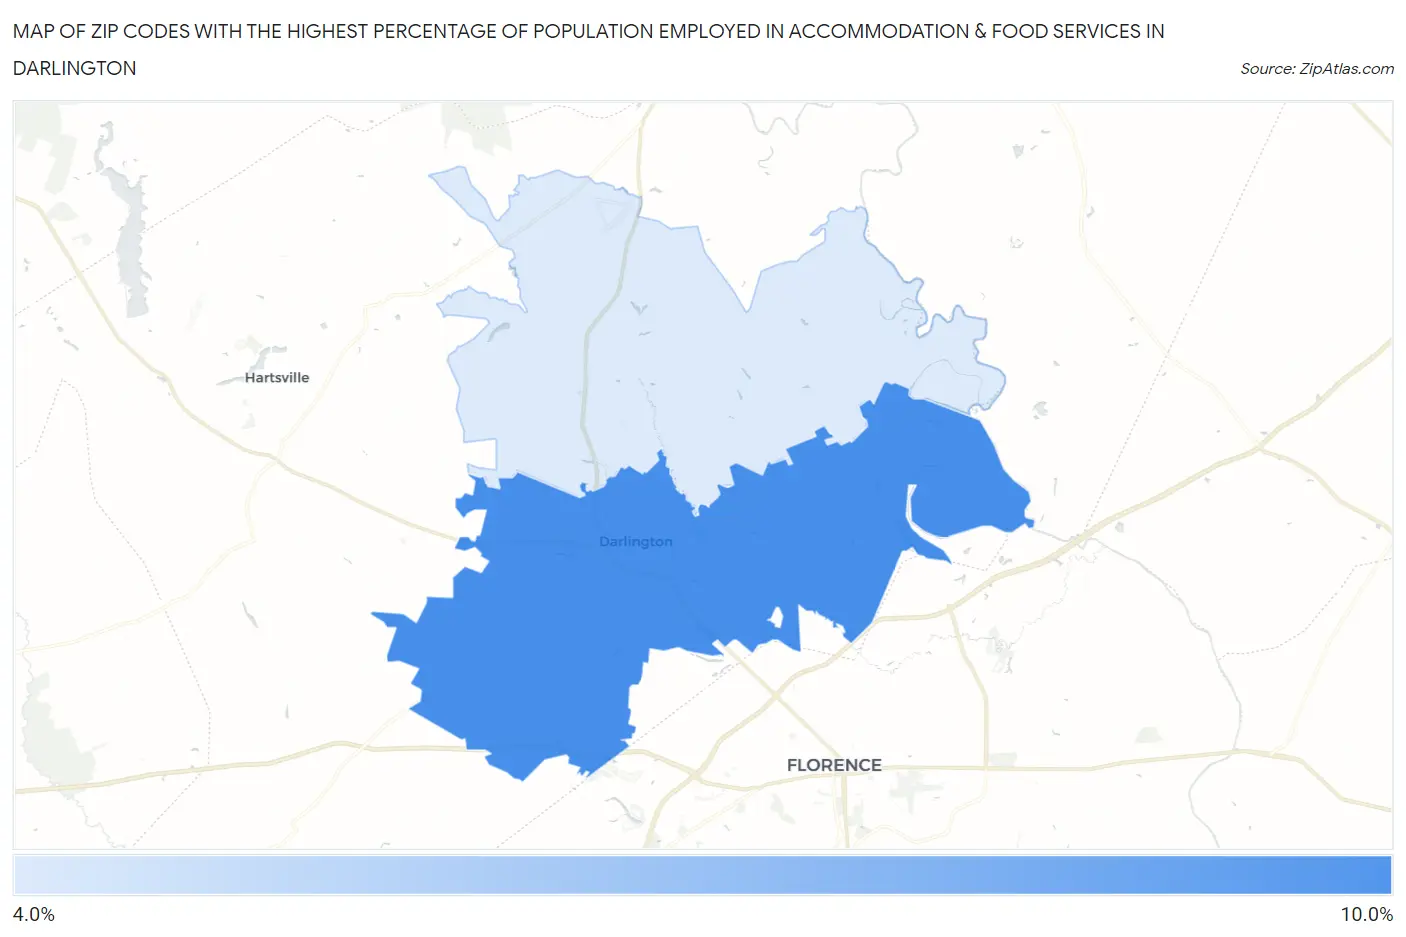
Map of Zip Codes with the Highest Percentage of Population Employed in Accommodation & Food Services in Darlington
4.5%
8.2%
Zip Codes with the Highest Percentage of Population Employed in Accommodation & Food Services in Darlington, SC
| Zip Code | % Employed | vs State | vs National | |
| 1. | 29532 | 8.2% | 8.0%(+0.219)#135 | 6.9%(+1.31)#7,431 |
| 2. | 29540 | 4.5% | 8.0%(-3.42)#295 | 6.9%(-2.33)#18,328 |
1
Common Questions
What are the Top Zip Codes with the Highest Percentage of Population Employed in Accommodation & Food Services in Darlington, SC?
Top Zip Codes with the Highest Percentage of Population Employed in Accommodation & Food Services in Darlington, SC are:
What zip code has the Highest Percentage of Population Employed in Accommodation & Food Services in Darlington, SC?
29532 has the Highest Percentage of Population Employed in Accommodation & Food Services in Darlington, SC with 8.2%.
What is the Percentage of Population Employed in Accommodation & Food Services in Darlington, SC?
Percentage of Population Employed in Accommodation & Food Services in Darlington is 11.7%.
What is the Percentage of Population Employed in Accommodation & Food Services in South Carolina?
Percentage of Population Employed in Accommodation & Food Services in South Carolina is 8.0%.
What is the Percentage of Population Employed in Accommodation & Food Services in the United States?
Percentage of Population Employed in Accommodation & Food Services in the United States is 6.9%.