Zip Codes with the Highest Percentage of Population Employed in Accommodation & Food Services in Lexington, SC
RELATED REPORTS & OPTIONS
Accommodation & Food Services
Lexington
Compare Zip Codes
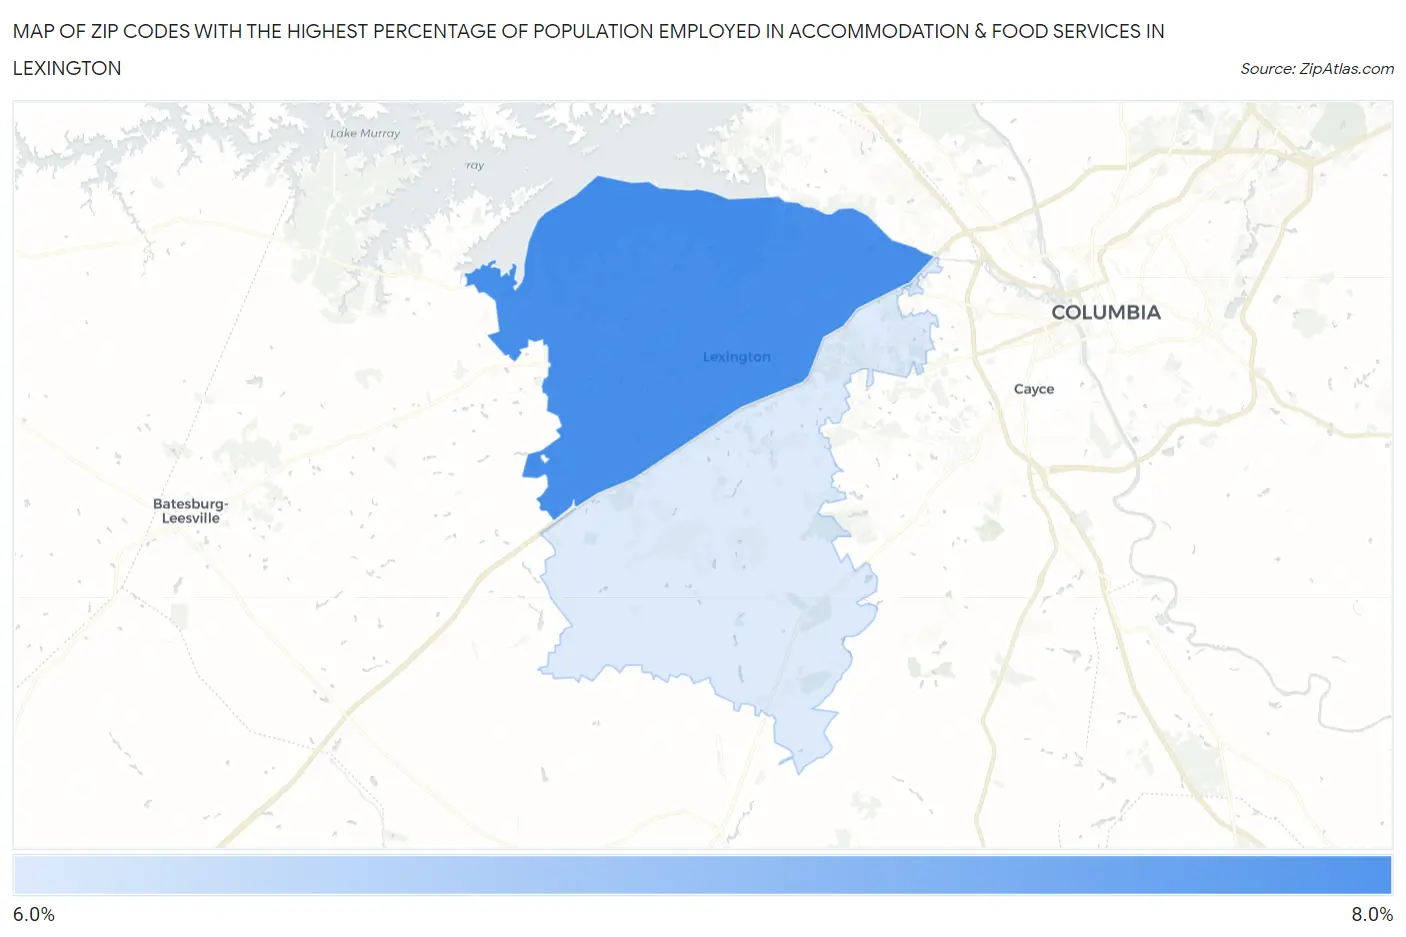
Map of Zip Codes with the Highest Percentage of Population Employed in Accommodation & Food Services in Lexington
6.3%
7.4%
Zip Codes with the Highest Percentage of Population Employed in Accommodation & Food Services in Lexington, SC
| Zip Code | % Employed | vs State | vs National | |
| 1. | 29072 | 7.4% | 8.0%(-0.564)#163 | 6.9%(+0.526)#9,239 |
| 2. | 29073 | 6.3% | 8.0%(-1.71)#215 | 6.9%(-0.625)#12,610 |
1
Common Questions
What are the Top Zip Codes with the Highest Percentage of Population Employed in Accommodation & Food Services in Lexington, SC?
Top Zip Codes with the Highest Percentage of Population Employed in Accommodation & Food Services in Lexington, SC are:
What zip code has the Highest Percentage of Population Employed in Accommodation & Food Services in Lexington, SC?
29072 has the Highest Percentage of Population Employed in Accommodation & Food Services in Lexington, SC with 7.4%.
What is the Percentage of Population Employed in Accommodation & Food Services in Lexington, SC?
Percentage of Population Employed in Accommodation & Food Services in Lexington is 8.3%.
What is the Percentage of Population Employed in Accommodation & Food Services in South Carolina?
Percentage of Population Employed in Accommodation & Food Services in South Carolina is 8.0%.
What is the Percentage of Population Employed in Accommodation & Food Services in the United States?
Percentage of Population Employed in Accommodation & Food Services in the United States is 6.9%.