Zip Codes with the Highest Percentage of Population Employed in Accommodation & Food Services in Summerville, SC
RELATED REPORTS & OPTIONS
Accommodation & Food Services
Summerville
Compare Zip Codes
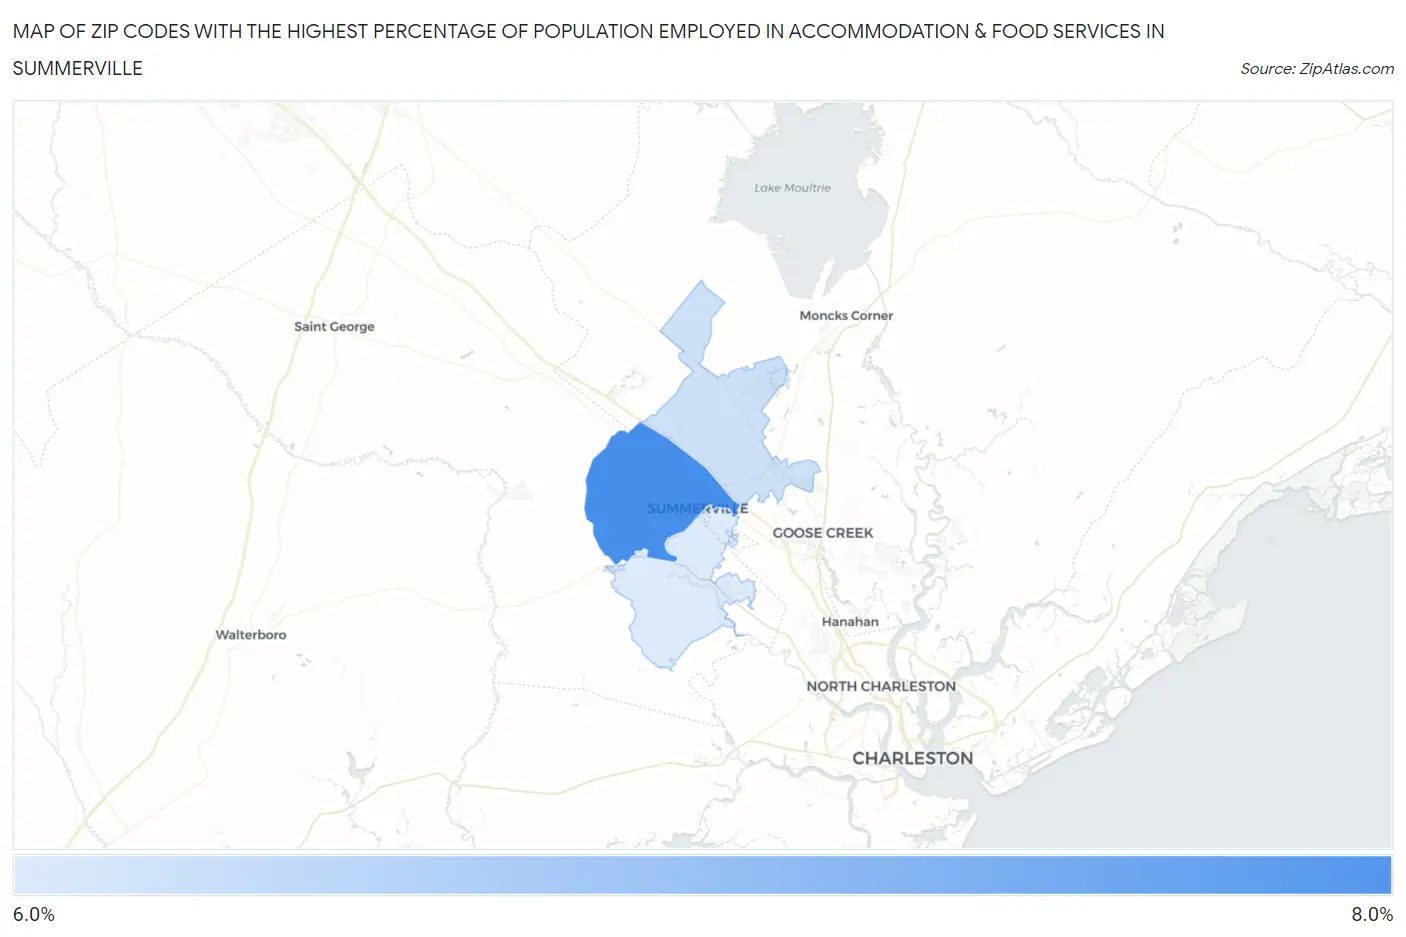
Map of Zip Codes with the Highest Percentage of Population Employed in Accommodation & Food Services in Summerville
6.6%
7.9%
Zip Codes with the Highest Percentage of Population Employed in Accommodation & Food Services in Summerville, SC
| Zip Code | % Employed | vs State | vs National | |
| 1. | 29483 | 7.9% | 8.0%(-0.100)#144 | 6.9%(+0.989)#8,097 |
| 2. | 29486 | 6.7% | 8.0%(-1.24)#195 | 6.9%(-0.146)#11,096 |
| 3. | 29485 | 6.6% | 8.0%(-1.36)#200 | 6.9%(-0.271)#11,492 |
1
Common Questions
What are the Top Zip Codes with the Highest Percentage of Population Employed in Accommodation & Food Services in Summerville, SC?
Top Zip Codes with the Highest Percentage of Population Employed in Accommodation & Food Services in Summerville, SC are:
What zip code has the Highest Percentage of Population Employed in Accommodation & Food Services in Summerville, SC?
29483 has the Highest Percentage of Population Employed in Accommodation & Food Services in Summerville, SC with 7.9%.
What is the Percentage of Population Employed in Accommodation & Food Services in Summerville, SC?
Percentage of Population Employed in Accommodation & Food Services in Summerville is 9.6%.
What is the Percentage of Population Employed in Accommodation & Food Services in South Carolina?
Percentage of Population Employed in Accommodation & Food Services in South Carolina is 8.0%.
What is the Percentage of Population Employed in Accommodation & Food Services in the United States?
Percentage of Population Employed in Accommodation & Food Services in the United States is 6.9%.