Immigrants from Zaire vs Immigrants from Jordan Married-Couple Family Poverty
COMPARE
Immigrants from Zaire
Immigrants from Jordan
Married-Couple Family Poverty
Married-Couple Family Poverty Comparison
Immigrants from Zaire
Immigrants from Jordan
5.6%
MARRIED-COUPLE FAMILY POVERTY
5.6/ 100
METRIC RATING
227th/ 347
METRIC RANK
5.1%
MARRIED-COUPLE FAMILY POVERTY
66.5/ 100
METRIC RATING
162nd/ 347
METRIC RANK
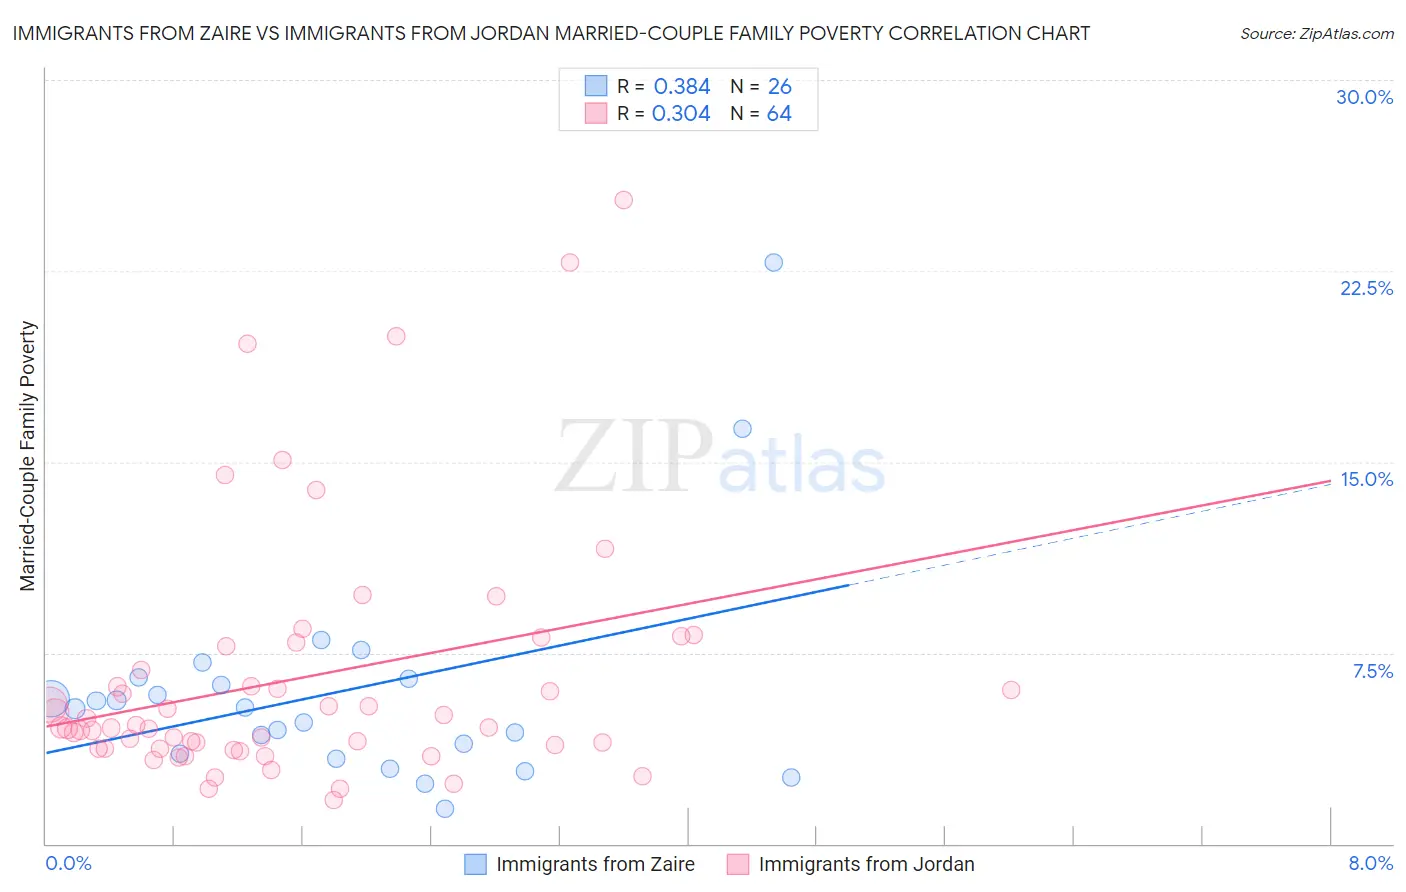
Immigrants from Zaire vs Immigrants from Jordan Married-Couple Family Poverty Correlation Chart
The statistical analysis conducted on geographies consisting of 106,970,215 people shows a mild positive correlation between the proportion of Immigrants from Zaire and poverty level among married-couple families in the United States with a correlation coefficient (R) of 0.384 and weighted average of 5.6%. Similarly, the statistical analysis conducted on geographies consisting of 180,872,287 people shows a mild positive correlation between the proportion of Immigrants from Jordan and poverty level among married-couple families in the United States with a correlation coefficient (R) of 0.304 and weighted average of 5.1%, a difference of 10.4%.
Married-Couple Family Poverty Correlation Summary
| Measurement | Immigrants from Zaire | Immigrants from Jordan |
| Minimum | 1.4% | 1.7% |
| Maximum | 22.9% | 25.3% |
| Range | 21.5% | 23.5% |
| Mean | 6.0% | 6.5% |
| Median | 5.3% | 4.6% |
| Interquartile 25% (IQ1) | 3.5% | 3.7% |
| Interquartile 75% (IQ3) | 6.5% | 7.3% |
| Interquartile Range (IQR) | 3.0% | 3.5% |
| Standard Deviation (Sample) | 4.4% | 4.9% |
| Standard Deviation (Population) | 4.4% | 4.9% |
Similar Demographics by Married-Couple Family Poverty
Demographics Similar to Immigrants from Zaire by Married-Couple Family Poverty
In terms of married-couple family poverty, the demographic groups most similar to Immigrants from Zaire are South American (5.6%, a difference of 0.020%), Arab (5.7%, a difference of 0.13%), Immigrants from Cambodia (5.6%, a difference of 0.24%), Sudanese (5.6%, a difference of 0.38%), and Subsaharan African (5.7%, a difference of 0.38%).
| Demographics | Rating | Rank | Married-Couple Family Poverty |
| Colombians | 9.2 /100 | #220 | Tragic 5.6% |
| Panamanians | 9.2 /100 | #221 | Tragic 5.6% |
| Cajuns | 6.9 /100 | #222 | Tragic 5.6% |
| Immigrants | Fiji | 6.7 /100 | #223 | Tragic 5.6% |
| Sudanese | 6.4 /100 | #224 | Tragic 5.6% |
| Immigrants | Cambodia | 6.1 /100 | #225 | Tragic 5.6% |
| South Americans | 5.7 /100 | #226 | Tragic 5.6% |
| Immigrants | Zaire | 5.6 /100 | #227 | Tragic 5.6% |
| Arabs | 5.4 /100 | #228 | Tragic 5.7% |
| Sub-Saharan Africans | 4.9 /100 | #229 | Tragic 5.7% |
| Moroccans | 4.9 /100 | #230 | Tragic 5.7% |
| Immigrants | Iraq | 4.4 /100 | #231 | Tragic 5.7% |
| Immigrants | Laos | 4.4 /100 | #232 | Tragic 5.7% |
| Immigrants | Colombia | 3.7 /100 | #233 | Tragic 5.7% |
| Immigrants | Uruguay | 3.7 /100 | #234 | Tragic 5.7% |
Demographics Similar to Immigrants from Jordan by Married-Couple Family Poverty
In terms of married-couple family poverty, the demographic groups most similar to Immigrants from Jordan are Ethiopian (5.1%, a difference of 0.22%), Pennsylvania German (5.1%, a difference of 0.27%), Sierra Leonean (5.1%, a difference of 0.31%), Immigrants from South Eastern Asia (5.1%, a difference of 0.53%), and Immigrants from Saudi Arabia (5.1%, a difference of 0.53%).
| Demographics | Rating | Rank | Married-Couple Family Poverty |
| Immigrants | Ethiopia | 72.4 /100 | #155 | Good 5.1% |
| Sri Lankans | 72.2 /100 | #156 | Good 5.1% |
| Argentineans | 70.7 /100 | #157 | Good 5.1% |
| Immigrants | South Eastern Asia | 70.4 /100 | #158 | Good 5.1% |
| Immigrants | Saudi Arabia | 70.3 /100 | #159 | Good 5.1% |
| Pennsylvania Germans | 68.5 /100 | #160 | Good 5.1% |
| Ethiopians | 68.1 /100 | #161 | Good 5.1% |
| Immigrants | Jordan | 66.5 /100 | #162 | Good 5.1% |
| Sierra Leoneans | 64.1 /100 | #163 | Good 5.1% |
| Hawaiians | 62.3 /100 | #164 | Good 5.1% |
| Immigrants | Malaysia | 62.2 /100 | #165 | Good 5.1% |
| Paraguayans | 61.5 /100 | #166 | Good 5.1% |
| Costa Ricans | 61.5 /100 | #167 | Good 5.1% |
| Immigrants | Uganda | 54.9 /100 | #168 | Average 5.2% |
| Ottawa | 54.5 /100 | #169 | Average 5.2% |