Immigrants from Zaire Wage/Income Gap
COMPARE
Immigrants from Zaire
Select to Compare
Wage/Income Gap
Immigrants from Zaire Wage/Income Gap
22.3%
WAGE/INCOME GAP
100.0/ 100
METRIC RATING
55th/ 347
METRIC RANK
Immigrants from Zaire Wage/Income Gap Correlation Chart
The statistical analysis conducted on geographies consisting of 107,239,731 people shows a moderate positive correlation between the proportion of Immigrants from Zaire and wage/income gap percentage in the United States with a correlation coefficient (R) of 0.478 and weighted average of 22.3%. On average, for every 1% (one percent) increase in Immigrants from Zaire within a typical geography, there is an increase of 3.1% in wage/income gap percentage.
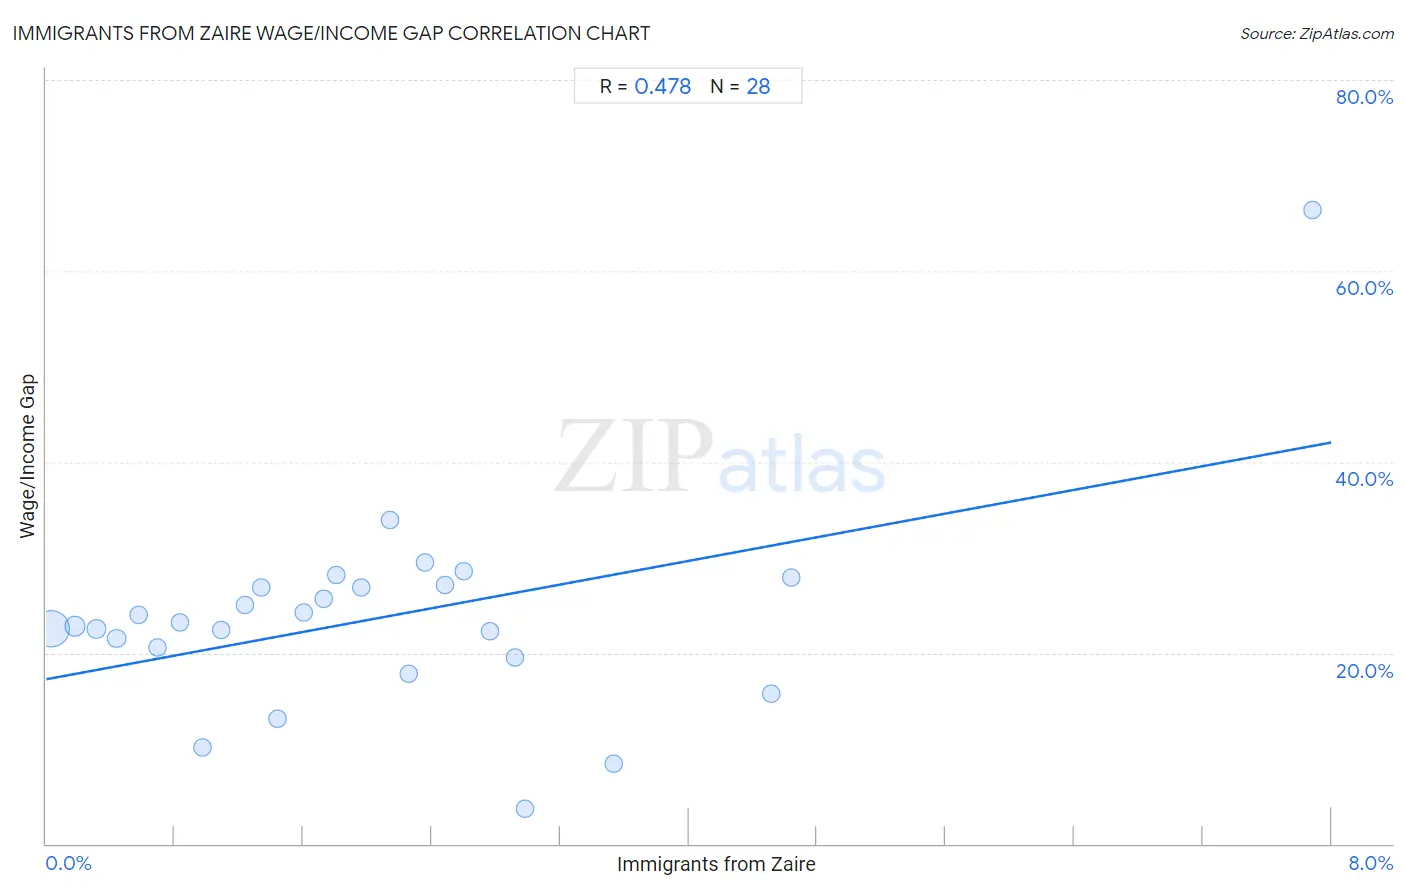
It is essential to understand that the correlation between the percentage of Immigrants from Zaire and wage/income gap percentage does not imply a direct cause-and-effect relationship. It remains uncertain whether the presence of Immigrants from Zaire influences an upward or downward trend in the level of wage/income gap percentage within an area, or if Immigrants from Zaire simply ended up residing in those areas with higher or lower levels of wage/income gap percentage due to other factors.
Demographics Similar to Immigrants from Zaire by Wage/Income Gap
In terms of wage/income gap, the demographic groups most similar to Immigrants from Zaire are Immigrants from Ghana (22.3%, a difference of 0.030%), Ghanaian (22.3%, a difference of 0.13%), Immigrants from Cuba (22.4%, a difference of 0.22%), Navajo (22.4%, a difference of 0.25%), and Immigrants from Middle Africa (22.4%, a difference of 0.27%).
| Demographics | Rating | Rank | Wage/Income Gap |
| Blacks/African Americans | 100.0 /100 | #48 | Exceptional 21.7% |
| Ethiopians | 100.0 /100 | #49 | Exceptional 21.8% |
| Immigrants from Western Africa | 100.0 /100 | #50 | Exceptional 22.0% |
| Tohono O'odham | 100.0 /100 | #51 | Exceptional 22.1% |
| Immigrants from Cameroon | 100.0 /100 | #52 | Exceptional 22.2% |
| Bangladeshis | 100.0 /100 | #53 | Exceptional 22.2% |
| Nepalese | 100.0 /100 | #54 | Exceptional 22.2% |
| Immigrants from Zaire | 100.0 /100 | #55 | Exceptional 22.3% |
| Immigrants from Ghana | 100.0 /100 | #56 | Exceptional 22.3% |
| Ghanaians | 100.0 /100 | #57 | Exceptional 22.3% |
| Immigrants from Cuba | 100.0 /100 | #58 | Exceptional 22.4% |
| Navajo | 100.0 /100 | #59 | Exceptional 22.4% |
| Immigrants from Middle Africa | 100.0 /100 | #60 | Exceptional 22.4% |
| Immigrants from Fiji | 100.0 /100 | #61 | Exceptional 22.4% |
| Immigrants from Guatemala | 100.0 /100 | #62 | Exceptional 22.5% |
Immigrants from Zaire Wage/Income Gap Correlation Summary
| Measurement | Immigrants from Zaire Data | Wage/Income Gap Data |
| Minimum | 0.034% | 3.7% |
| Maximum | 7.9% | 66.4% |
| Range | 7.8% | 62.8% |
| Mean | 2.0% | 23.6% |
| Median | 1.8% | 23.0% |
| Interquartile 25% (IQ1) | 0.90% | 20.1% |
| Interquartile 75% (IQ3) | 2.7% | 27.0% |
| Interquartile Range (IQR) | 1.8% | 6.9% |
| Standard Deviation (Sample) | 1.7% | 10.8% |
| Standard Deviation (Population) | 1.6% | 10.6% |
Correlation Details
| Immigrants from Zaire Percentile | Sample Size | Wage/Income Gap |
[ 0.0% - 0.5% ] 0.034% | 85,964,732 | 22.5% |
[ 0.0% - 0.5% ] 0.18% | 11,595,398 | 22.8% |
[ 0.0% - 0.5% ] 0.31% | 3,926,079 | 22.5% |
[ 0.0% - 0.5% ] 0.44% | 2,396,329 | 21.5% |
[ 0.5% - 1.0% ] 0.58% | 921,339 | 23.9% |
[ 0.5% - 1.0% ] 0.69% | 446,012 | 20.6% |
[ 0.5% - 1.0% ] 0.83% | 452,787 | 23.2% |
[ 0.5% - 1.0% ] 0.97% | 319,509 | 10.0% |
[ 1.0% - 1.5% ] 1.09% | 351,580 | 22.4% |
[ 1.0% - 1.5% ] 1.24% | 179,591 | 25.1% |
[ 1.0% - 1.5% ] 1.34% | 152,275 | 26.8% |
[ 1.0% - 1.5% ] 1.44% | 48,355 | 13.1% |
[ 1.5% - 2.0% ] 1.61% | 91,493 | 24.3% |
[ 1.5% - 2.0% ] 1.73% | 8,325 | 25.7% |
[ 1.5% - 2.0% ] 1.81% | 22,860 | 28.2% |
[ 1.5% - 2.0% ] 1.96% | 63,035 | 26.8% |
[ 2.0% - 2.5% ] 2.14% | 37,926 | 33.9% |
[ 2.0% - 2.5% ] 2.26% | 23,428 | 17.8% |
[ 2.0% - 2.5% ] 2.36% | 36,390 | 29.4% |
[ 2.0% - 2.5% ] 2.48% | 63,394 | 27.1% |
[ 2.5% - 3.0% ] 2.60% | 12,365 | 28.5% |
[ 2.5% - 3.0% ] 2.76% | 724 | 22.3% |
[ 2.5% - 3.0% ] 2.92% | 67,134 | 19.6% |
[ 2.5% - 3.0% ] 2.98% | 8,681 | 3.7% |
[ 3.5% - 4.0% ] 3.54% | 4,809 | 8.3% |
[ 4.5% - 5.0% ] 4.52% | 43,110 | 15.7% |
[ 4.5% - 5.0% ] 4.64% | 1,208 | 27.8% |
[ 7.5% - 8.0% ] 7.88% | 863 | 66.4% |