Immigrants from Sri Lanka vs Arab Married-Couple Family Poverty
COMPARE
Immigrants from Sri Lanka
Arab
Married-Couple Family Poverty
Married-Couple Family Poverty Comparison
Immigrants from Sri Lanka
Arabs
4.4%
MARRIED-COUPLE FAMILY POVERTY
99.6/ 100
METRIC RATING
63rd/ 347
METRIC RANK
5.7%
MARRIED-COUPLE FAMILY POVERTY
5.4/ 100
METRIC RATING
228th/ 347
METRIC RANK
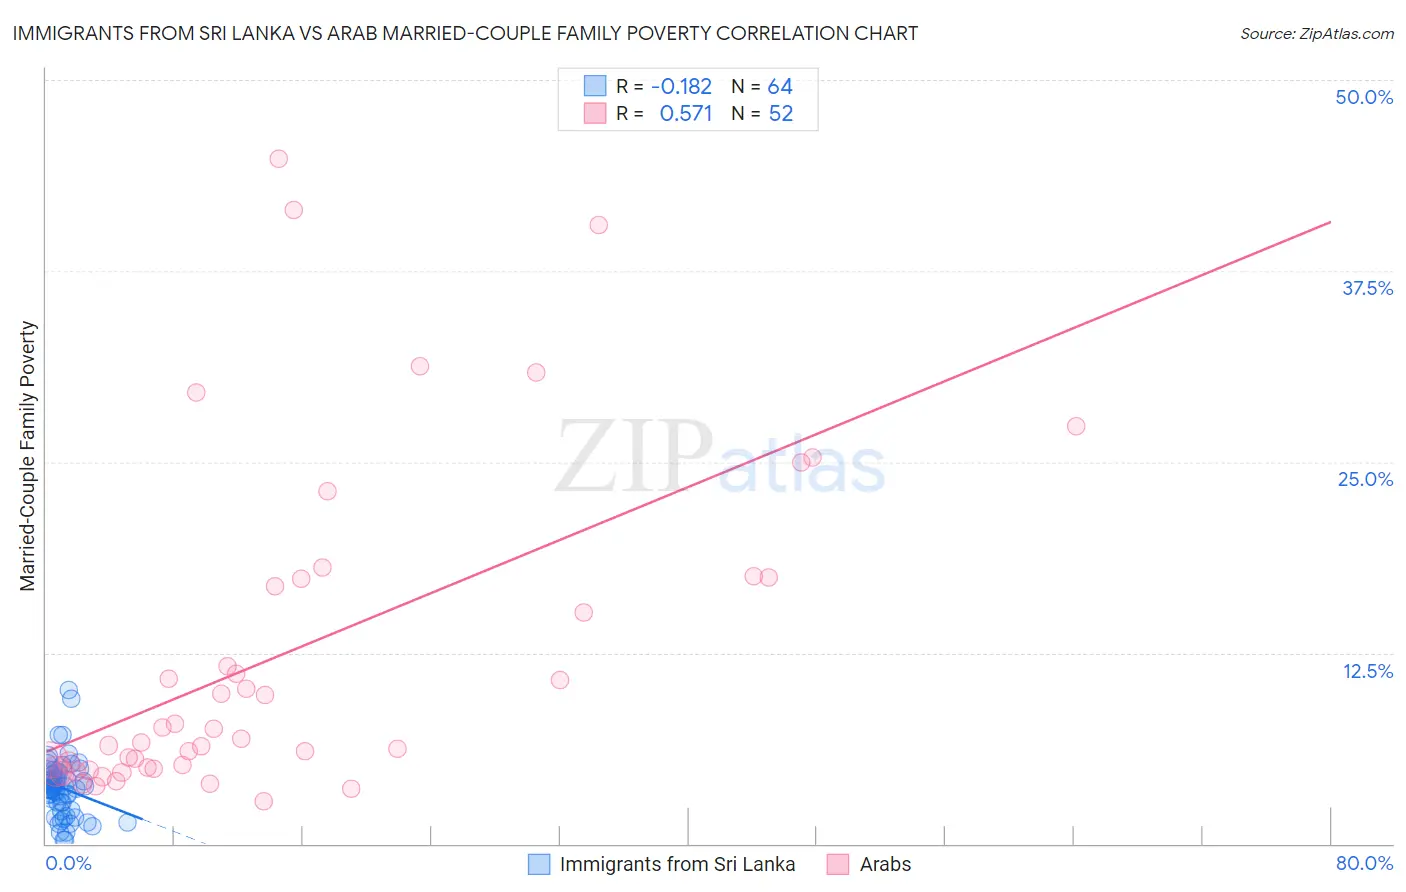
Immigrants from Sri Lanka vs Arab Married-Couple Family Poverty Correlation Chart
The statistical analysis conducted on geographies consisting of 149,331,706 people shows a poor negative correlation between the proportion of Immigrants from Sri Lanka and poverty level among married-couple families in the United States with a correlation coefficient (R) of -0.182 and weighted average of 4.4%. Similarly, the statistical analysis conducted on geographies consisting of 480,161,401 people shows a substantial positive correlation between the proportion of Arabs and poverty level among married-couple families in the United States with a correlation coefficient (R) of 0.571 and weighted average of 5.7%, a difference of 28.5%.
Married-Couple Family Poverty Correlation Summary
| Measurement | Immigrants from Sri Lanka | Arab |
| Minimum | 0.22% | 2.8% |
| Maximum | 10.1% | 44.8% |
| Range | 9.9% | 42.1% |
| Mean | 3.7% | 12.5% |
| Median | 3.7% | 7.2% |
| Interquartile 25% (IQ1) | 2.5% | 5.0% |
| Interquartile 75% (IQ3) | 4.6% | 17.4% |
| Interquartile Range (IQR) | 2.2% | 12.4% |
| Standard Deviation (Sample) | 1.9% | 10.8% |
| Standard Deviation (Population) | 1.9% | 10.7% |
Similar Demographics by Married-Couple Family Poverty
Demographics Similar to Immigrants from Sri Lanka by Married-Couple Family Poverty
In terms of married-couple family poverty, the demographic groups most similar to Immigrants from Sri Lanka are Immigrants from Australia (4.4%, a difference of 0.36%), Okinawan (4.4%, a difference of 0.37%), Immigrants from Bulgaria (4.4%, a difference of 0.41%), Tlingit-Haida (4.4%, a difference of 0.49%), and Immigrants from Sweden (4.4%, a difference of 0.56%).
| Demographics | Rating | Rank | Married-Couple Family Poverty |
| Immigrants | Zimbabwe | 99.7 /100 | #56 | Exceptional 4.3% |
| Immigrants | Netherlands | 99.7 /100 | #57 | Exceptional 4.3% |
| Czechoslovakians | 99.7 /100 | #58 | Exceptional 4.4% |
| Immigrants | Sweden | 99.6 /100 | #59 | Exceptional 4.4% |
| Tlingit-Haida | 99.6 /100 | #60 | Exceptional 4.4% |
| Okinawans | 99.6 /100 | #61 | Exceptional 4.4% |
| Immigrants | Australia | 99.6 /100 | #62 | Exceptional 4.4% |
| Immigrants | Sri Lanka | 99.6 /100 | #63 | Exceptional 4.4% |
| Immigrants | Bulgaria | 99.5 /100 | #64 | Exceptional 4.4% |
| Macedonians | 99.4 /100 | #65 | Exceptional 4.4% |
| Immigrants | Serbia | 99.4 /100 | #66 | Exceptional 4.4% |
| Immigrants | Canada | 99.4 /100 | #67 | Exceptional 4.4% |
| Slavs | 99.4 /100 | #68 | Exceptional 4.4% |
| New Zealanders | 99.4 /100 | #69 | Exceptional 4.4% |
| Immigrants | Korea | 99.4 /100 | #70 | Exceptional 4.5% |
Demographics Similar to Arabs by Married-Couple Family Poverty
In terms of married-couple family poverty, the demographic groups most similar to Arabs are Immigrants from Zaire (5.6%, a difference of 0.13%), South American (5.6%, a difference of 0.15%), Subsaharan African (5.7%, a difference of 0.25%), Moroccan (5.7%, a difference of 0.28%), and Immigrants from Cambodia (5.6%, a difference of 0.37%).
| Demographics | Rating | Rank | Married-Couple Family Poverty |
| Panamanians | 9.2 /100 | #221 | Tragic 5.6% |
| Cajuns | 6.9 /100 | #222 | Tragic 5.6% |
| Immigrants | Fiji | 6.7 /100 | #223 | Tragic 5.6% |
| Sudanese | 6.4 /100 | #224 | Tragic 5.6% |
| Immigrants | Cambodia | 6.1 /100 | #225 | Tragic 5.6% |
| South Americans | 5.7 /100 | #226 | Tragic 5.6% |
| Immigrants | Zaire | 5.6 /100 | #227 | Tragic 5.6% |
| Arabs | 5.4 /100 | #228 | Tragic 5.7% |
| Sub-Saharan Africans | 4.9 /100 | #229 | Tragic 5.7% |
| Moroccans | 4.9 /100 | #230 | Tragic 5.7% |
| Immigrants | Iraq | 4.4 /100 | #231 | Tragic 5.7% |
| Immigrants | Laos | 4.4 /100 | #232 | Tragic 5.7% |
| Immigrants | Colombia | 3.7 /100 | #233 | Tragic 5.7% |
| Immigrants | Uruguay | 3.7 /100 | #234 | Tragic 5.7% |
| Immigrants | Sudan | 3.5 /100 | #235 | Tragic 5.7% |