Immigrants from Sri Lanka Disability Age 5 to 17
COMPARE
Immigrants from Sri Lanka
Select to Compare
Disability Age 5 to 17
Immigrants from Sri Lanka Disability Age 5 to 17
5.0%
DISABILITY | AGE 5 TO 17
100.0/ 100
METRIC RATING
42nd/ 347
METRIC RANK
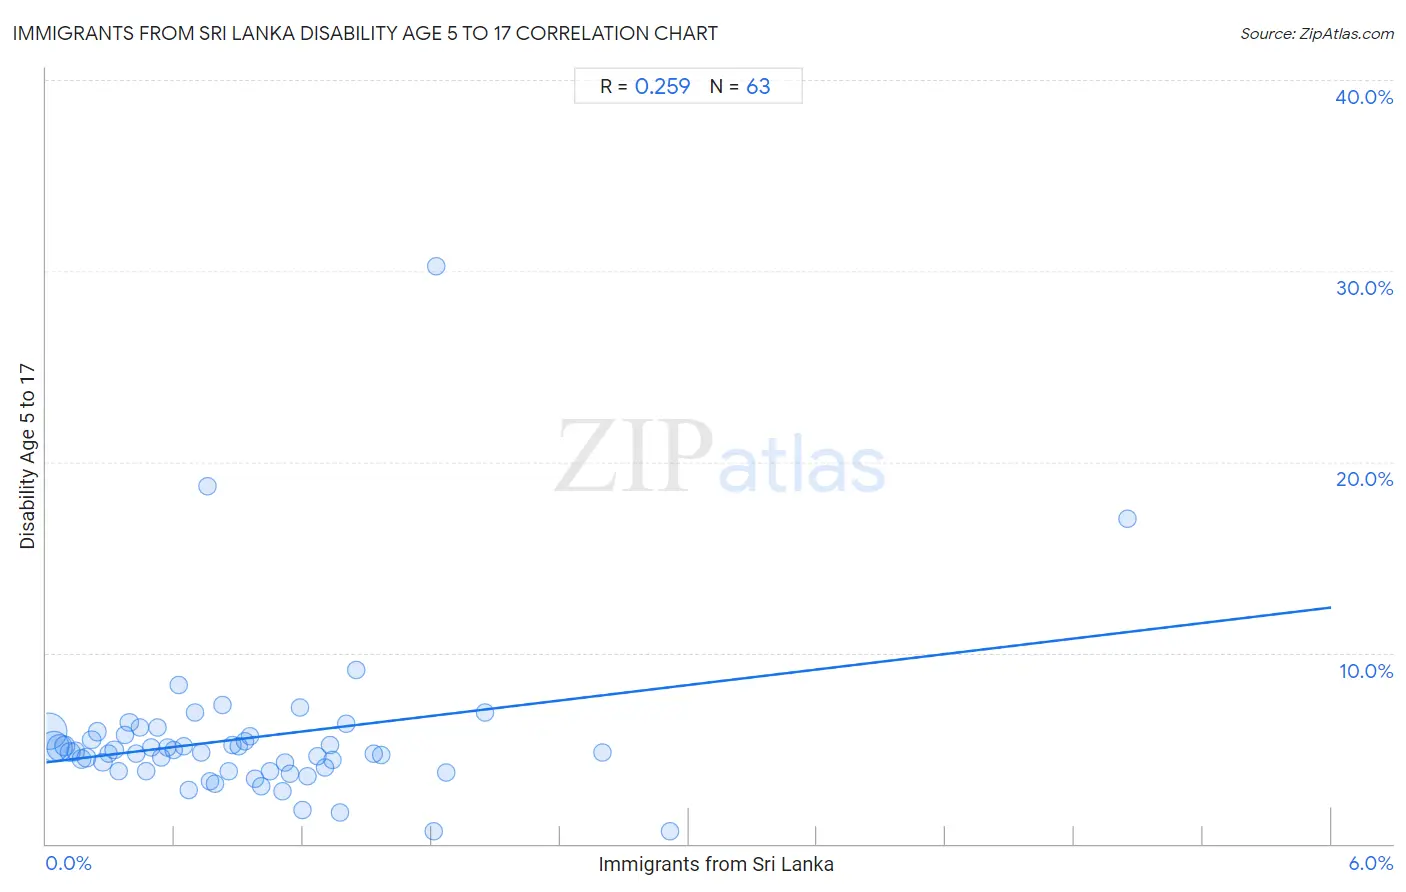
Immigrants from Sri Lanka Disability Age 5 to 17 Correlation Chart
The statistical analysis conducted on geographies consisting of 149,300,989 people shows a weak positive correlation between the proportion of Immigrants from Sri Lanka and percentage of population with a disability between the ages 5 and 17 in the United States with a correlation coefficient (R) of 0.259 and weighted average of 5.0%. On average, for every 1% (one percent) increase in Immigrants from Sri Lanka within a typical geography, there is an increase of 1.4% in percentage of population with a disability between the ages 5 and 17.
It is essential to understand that the correlation between the percentage of Immigrants from Sri Lanka and percentage of population with a disability between the ages 5 and 17 does not imply a direct cause-and-effect relationship. It remains uncertain whether the presence of Immigrants from Sri Lanka influences an upward or downward trend in the level of percentage of population with a disability between the ages 5 and 17 within an area, or if Immigrants from Sri Lanka simply ended up residing in those areas with higher or lower levels of percentage of population with a disability between the ages 5 and 17 due to other factors.
Demographics Similar to Immigrants from Sri Lanka by Disability Age 5 to 17
In terms of disability age 5 to 17, the demographic groups most similar to Immigrants from Sri Lanka are Immigrants from Australia (5.0%, a difference of 0.010%), Okinawan (5.0%, a difference of 0.090%), Immigrants from Philippines (5.0%, a difference of 0.17%), Immigrants from Argentina (5.0%, a difference of 0.17%), and Immigrants from Belarus (5.0%, a difference of 0.21%).
| Demographics | Rating | Rank | Disability Age 5 to 17 |
| Bolivians | 100.0 /100 | #35 | Exceptional 5.0% |
| Immigrants from Egypt | 100.0 /100 | #36 | Exceptional 5.0% |
| Immigrants from Belarus | 100.0 /100 | #37 | Exceptional 5.0% |
| Immigrants from Philippines | 100.0 /100 | #38 | Exceptional 5.0% |
| Immigrants from Argentina | 100.0 /100 | #39 | Exceptional 5.0% |
| Okinawans | 100.0 /100 | #40 | Exceptional 5.0% |
| Immigrants from Australia | 100.0 /100 | #41 | Exceptional 5.0% |
| Immigrants from Sri Lanka | 100.0 /100 | #42 | Exceptional 5.0% |
| Immigrants from Russia | 100.0 /100 | #43 | Exceptional 5.0% |
| Egyptians | 100.0 /100 | #44 | Exceptional 5.0% |
| Tongans | 100.0 /100 | #45 | Exceptional 5.0% |
| Assyrians/Chaldeans/Syriacs | 100.0 /100 | #46 | Exceptional 5.0% |
| Vietnamese | 100.0 /100 | #47 | Exceptional 5.1% |
| Koreans | 100.0 /100 | #48 | Exceptional 5.1% |
| Immigrants from Western Asia | 100.0 /100 | #49 | Exceptional 5.1% |
Immigrants from Sri Lanka Disability Age 5 to 17 Correlation Summary
| Measurement | Immigrants from Sri Lanka Data | Disability Age 5 to 17 Data |
| Minimum | 0.013% | 0.62% |
| Maximum | 5.0% | 30.2% |
| Range | 5.0% | 29.6% |
| Mean | 0.93% | 5.5% |
| Median | 0.79% | 4.8% |
| Interquartile 25% (IQ1) | 0.39% | 3.8% |
| Interquartile 75% (IQ3) | 1.3% | 5.7% |
| Interquartile Range (IQR) | 0.88% | 1.9% |
| Standard Deviation (Sample) | 0.81% | 4.2% |
| Standard Deviation (Population) | 0.80% | 4.2% |
Correlation Details
| Immigrants from Sri Lanka Percentile | Sample Size | Disability Age 5 to 17 |
[ 0.0% - 0.5% ] 0.013% | 55,611,571 | 5.9% |
[ 0.0% - 0.5% ] 0.037% | 36,277,664 | 5.1% |
[ 0.0% - 0.5% ] 0.062% | 24,307,490 | 5.0% |
[ 0.0% - 0.5% ] 0.087% | 8,823,784 | 5.1% |
[ 0.0% - 0.5% ] 0.11% | 6,203,948 | 4.8% |
[ 0.0% - 0.5% ] 0.14% | 3,265,353 | 4.8% |
[ 0.0% - 0.5% ] 0.16% | 2,208,277 | 4.4% |
[ 0.0% - 0.5% ] 0.19% | 2,513,730 | 4.5% |
[ 0.0% - 0.5% ] 0.21% | 1,563,630 | 5.4% |
[ 0.0% - 0.5% ] 0.24% | 1,141,528 | 5.9% |
[ 0.0% - 0.5% ] 0.27% | 1,424,637 | 4.3% |
[ 0.0% - 0.5% ] 0.29% | 823,596 | 4.7% |
[ 0.0% - 0.5% ] 0.32% | 746,064 | 4.9% |
[ 0.0% - 0.5% ] 0.34% | 414,589 | 3.8% |
[ 0.0% - 0.5% ] 0.37% | 308,945 | 5.7% |
[ 0.0% - 0.5% ] 0.39% | 255,710 | 6.3% |
[ 0.0% - 0.5% ] 0.42% | 645,791 | 4.7% |
[ 0.0% - 0.5% ] 0.44% | 265,889 | 6.1% |
[ 0.0% - 0.5% ] 0.47% | 499,445 | 3.8% |
[ 0.0% - 0.5% ] 0.49% | 269,869 | 5.1% |
[ 0.5% - 1.0% ] 0.52% | 124,855 | 6.1% |
[ 0.5% - 1.0% ] 0.54% | 155,687 | 4.5% |
[ 0.5% - 1.0% ] 0.57% | 232,192 | 5.0% |
[ 0.5% - 1.0% ] 0.60% | 126,190 | 4.9% |
[ 0.5% - 1.0% ] 0.62% | 48,463 | 8.3% |
[ 0.5% - 1.0% ] 0.64% | 31,999 | 5.1% |
[ 0.5% - 1.0% ] 0.67% | 33,449 | 2.8% |
[ 0.5% - 1.0% ] 0.70% | 116,022 | 6.8% |
[ 0.5% - 1.0% ] 0.72% | 69,021 | 4.8% |
[ 0.5% - 1.0% ] 0.75% | 13,819 | 18.7% |
[ 0.5% - 1.0% ] 0.76% | 104,875 | 3.3% |
[ 0.5% - 1.0% ] 0.79% | 39,791 | 3.1% |
[ 0.5% - 1.0% ] 0.82% | 31,743 | 7.2% |
[ 0.5% - 1.0% ] 0.85% | 18,482 | 3.8% |
[ 0.5% - 1.0% ] 0.87% | 51,982 | 5.2% |
[ 0.5% - 1.0% ] 0.90% | 4,669 | 5.1% |
[ 0.5% - 1.0% ] 0.93% | 64,339 | 5.4% |
[ 0.5% - 1.0% ] 0.95% | 60,574 | 5.6% |
[ 0.5% - 1.0% ] 0.98% | 63,423 | 3.4% |
[ 1.0% - 1.5% ] 1.01% | 51,470 | 3.0% |
[ 1.0% - 1.5% ] 1.05% | 23,615 | 3.8% |
[ 1.0% - 1.5% ] 1.10% | 10,516 | 2.7% |
[ 1.0% - 1.5% ] 1.12% | 34,492 | 4.2% |
[ 1.0% - 1.5% ] 1.14% | 8,071 | 3.7% |
[ 1.0% - 1.5% ] 1.19% | 26,239 | 7.1% |
[ 1.0% - 1.5% ] 1.20% | 17,308 | 1.8% |
[ 1.0% - 1.5% ] 1.22% | 45,052 | 3.6% |
[ 1.0% - 1.5% ] 1.27% | 4,254 | 4.6% |
[ 1.0% - 1.5% ] 1.30% | 20,325 | 4.0% |
[ 1.0% - 1.5% ] 1.33% | 6,635 | 5.2% |
[ 1.0% - 1.5% ] 1.34% | 1,570 | 4.4% |
[ 1.0% - 1.5% ] 1.37% | 9,324 | 1.6% |
[ 1.0% - 1.5% ] 1.40% | 1,497 | 6.3% |
[ 1.0% - 1.5% ] 1.45% | 4,761 | 9.1% |
[ 1.5% - 2.0% ] 1.53% | 1,308 | 4.7% |
[ 1.5% - 2.0% ] 1.57% | 27,083 | 4.6% |
[ 1.5% - 2.0% ] 1.81% | 2,653 | 0.68% |
[ 1.5% - 2.0% ] 1.82% | 2,585 | 30.2% |
[ 1.5% - 2.0% ] 1.87% | 18,567 | 3.8% |
[ 2.0% - 2.5% ] 2.05% | 1,026 | 6.9% |
[ 2.5% - 3.0% ] 2.60% | 4,851 | 4.8% |
[ 2.5% - 3.0% ] 2.91% | 9,312 | 0.62% |
[ 5.0% - 5.5% ] 5.05% | 5,390 | 17.0% |