Immigrants from South America 3 or more Vehicles in Household
COMPARE
Immigrants from South America
Select to Compare
3 or more Vehicles in Household
Immigrants from South America 3 or more Vehicles in Household
16.7%
3+ VEHICLES AVAILABLE
0.1/ 100
METRIC RATING
299th/ 347
METRIC RANK
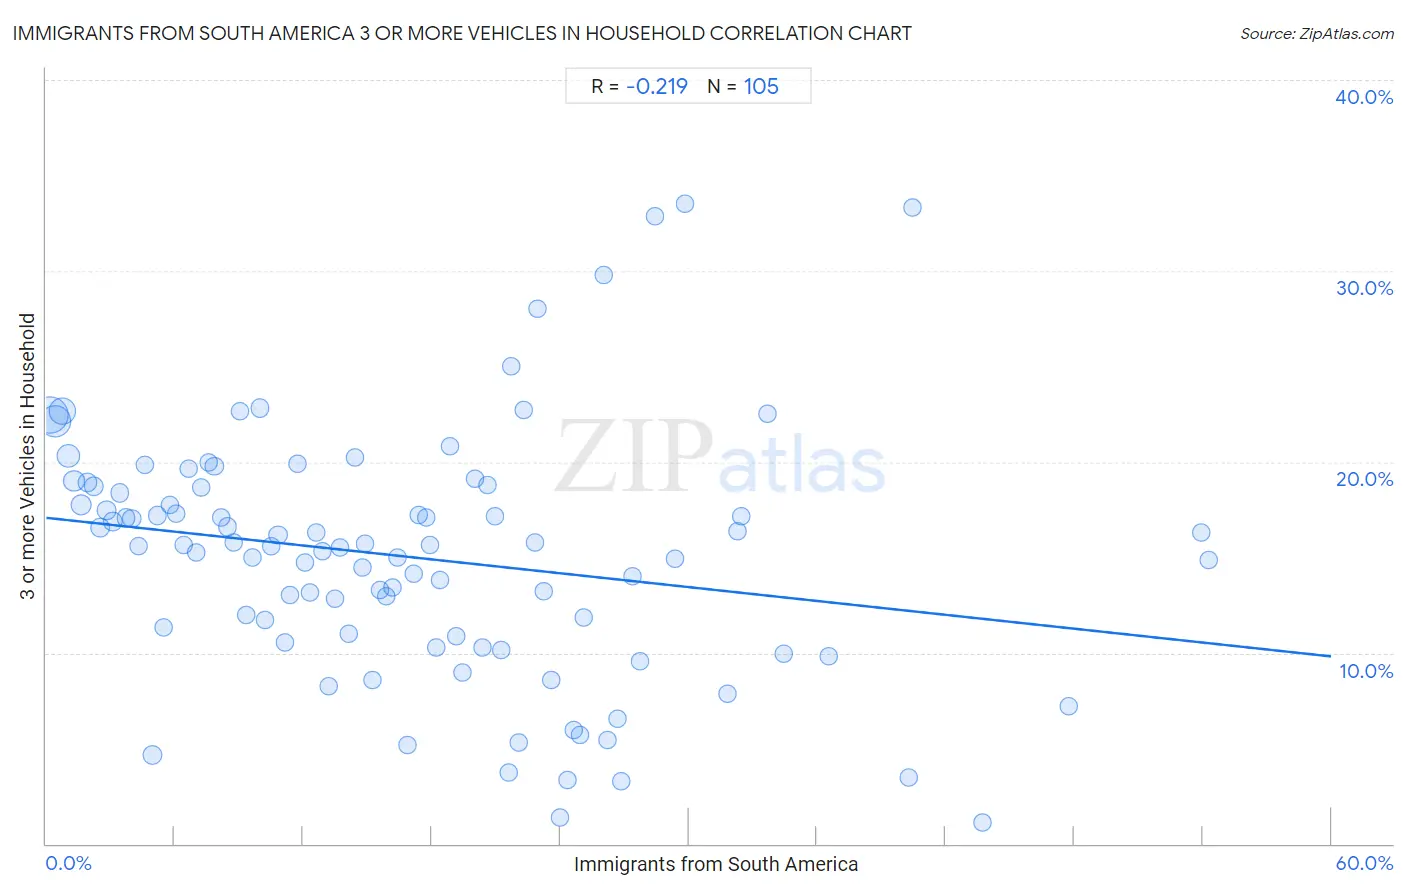
Immigrants from South America 3 or more Vehicles in Household Correlation Chart
The statistical analysis conducted on geographies consisting of 485,824,151 people shows a weak negative correlation between the proportion of Immigrants from South America and percentage of households with 3 or more vehicles available in the United States with a correlation coefficient (R) of -0.219 and weighted average of 16.7%. On average, for every 1% (one percent) increase in Immigrants from South America within a typical geography, there is a decrease of 0.12% in percentage of households with 3 or more vehicles available.
It is essential to understand that the correlation between the percentage of Immigrants from South America and percentage of households with 3 or more vehicles available does not imply a direct cause-and-effect relationship. It remains uncertain whether the presence of Immigrants from South America influences an upward or downward trend in the level of percentage of households with 3 or more vehicles available within an area, or if Immigrants from South America simply ended up residing in those areas with higher or lower levels of percentage of households with 3 or more vehicles available due to other factors.
Demographics Similar to Immigrants from South America by 3 or more Vehicles in Household
In terms of 3 or more vehicles in household, the demographic groups most similar to Immigrants from South America are Immigrants from Zaire (16.7%, a difference of 0.060%), Israeli (16.8%, a difference of 0.43%), Cypriot (16.6%, a difference of 0.48%), Paraguayan (16.6%, a difference of 0.89%), and Inupiat (16.9%, a difference of 0.90%).
| Demographics | Rating | Rank | 3 or more Vehicles in Household |
| Immigrants from Spain | 0.1 /100 | #292 | Tragic 17.0% |
| Bahamians | 0.1 /100 | #293 | Tragic 16.9% |
| Immigrants from Western Africa | 0.1 /100 | #294 | Tragic 16.9% |
| Immigrants from Russia | 0.1 /100 | #295 | Tragic 16.9% |
| Inupiat | 0.1 /100 | #296 | Tragic 16.9% |
| Israelis | 0.1 /100 | #297 | Tragic 16.8% |
| Immigrants from Zaire | 0.1 /100 | #298 | Tragic 16.7% |
| Immigrants from South America | 0.1 /100 | #299 | Tragic 16.7% |
| Cypriots | 0.0 /100 | #300 | Tragic 16.6% |
| Paraguayans | 0.0 /100 | #301 | Tragic 16.6% |
| Immigrants from Greece | 0.0 /100 | #302 | Tragic 16.5% |
| Immigrants from Serbia | 0.0 /100 | #303 | Tragic 16.4% |
| Ghanaians | 0.0 /100 | #304 | Tragic 16.4% |
| Immigrants from Morocco | 0.0 /100 | #305 | Tragic 16.3% |
| Somalis | 0.0 /100 | #306 | Tragic 16.2% |
Immigrants from South America 3 or more Vehicles in Household Correlation Summary
| Measurement | Immigrants from South America Data | 3 or more Vehicles in Household Data |
| Minimum | 0.15% | 1.1% |
| Maximum | 54.3% | 33.5% |
| Range | 54.1% | 32.4% |
| Mean | 17.0% | 15.0% |
| Median | 15.6% | 15.6% |
| Interquartile 25% (IQ1) | 7.7% | 10.7% |
| Interquartile 75% (IQ3) | 23.8% | 18.7% |
| Interquartile Range (IQR) | 16.1% | 8.0% |
| Standard Deviation (Sample) | 11.7% | 6.5% |
| Standard Deviation (Population) | 11.7% | 6.4% |
Correlation Details
| Immigrants from South America Percentile | Sample Size | 3 or more Vehicles in Household |
[ 0.0% - 0.5% ] 0.15% | 141,718,831 | 22.5% |
[ 0.0% - 0.5% ] 0.43% | 103,557,049 | 22.1% |
[ 0.5% - 1.0% ] 0.74% | 67,992,959 | 22.7% |
[ 1.0% - 1.5% ] 1.04% | 43,628,524 | 20.3% |
[ 1.0% - 1.5% ] 1.31% | 23,849,832 | 19.0% |
[ 1.5% - 2.0% ] 1.63% | 20,413,090 | 17.7% |
[ 1.5% - 2.0% ] 1.93% | 10,550,276 | 18.9% |
[ 2.0% - 2.5% ] 2.23% | 8,839,373 | 18.7% |
[ 2.5% - 3.0% ] 2.51% | 7,350,259 | 16.6% |
[ 2.5% - 3.0% ] 2.81% | 4,503,500 | 17.5% |
[ 3.0% - 3.5% ] 3.11% | 5,313,100 | 16.9% |
[ 3.0% - 3.5% ] 3.42% | 3,418,899 | 18.4% |
[ 3.5% - 4.0% ] 3.72% | 3,792,190 | 17.1% |
[ 3.5% - 4.0% ] 4.00% | 2,624,446 | 17.0% |
[ 4.0% - 4.5% ] 4.32% | 2,540,027 | 15.6% |
[ 4.5% - 5.0% ] 4.61% | 1,966,866 | 19.8% |
[ 4.5% - 5.0% ] 4.98% | 9,730,619 | 4.7% |
[ 5.0% - 5.5% ] 5.19% | 2,141,964 | 17.2% |
[ 5.0% - 5.5% ] 5.49% | 1,373,846 | 11.3% |
[ 5.5% - 6.0% ] 5.77% | 1,261,249 | 17.8% |
[ 6.0% - 6.5% ] 6.08% | 961,135 | 17.3% |
[ 6.0% - 6.5% ] 6.40% | 620,941 | 15.6% |
[ 6.5% - 7.0% ] 6.65% | 1,087,543 | 19.6% |
[ 6.5% - 7.0% ] 6.98% | 798,864 | 15.2% |
[ 7.0% - 7.5% ] 7.24% | 647,722 | 18.7% |
[ 7.5% - 8.0% ] 7.56% | 751,192 | 20.0% |
[ 7.5% - 8.0% ] 7.85% | 491,964 | 19.8% |
[ 8.0% - 8.5% ] 8.16% | 708,537 | 17.1% |
[ 8.0% - 8.5% ] 8.45% | 686,109 | 16.6% |
[ 8.5% - 9.0% ] 8.75% | 618,925 | 15.8% |
[ 9.0% - 9.5% ] 9.02% | 476,811 | 22.6% |
[ 9.0% - 9.5% ] 9.36% | 701,531 | 12.0% |
[ 9.5% - 10.0% ] 9.64% | 309,679 | 15.0% |
[ 9.5% - 10.0% ] 9.95% | 576,680 | 22.8% |
[ 10.0% - 10.5% ] 10.24% | 460,392 | 11.7% |
[ 10.5% - 11.0% ] 10.53% | 629,631 | 15.6% |
[ 10.5% - 11.0% ] 10.83% | 609,778 | 16.2% |
[ 11.0% - 11.5% ] 11.13% | 762,305 | 10.5% |
[ 11.0% - 11.5% ] 11.38% | 269,406 | 13.0% |
[ 11.5% - 12.0% ] 11.73% | 185,575 | 19.9% |
[ 12.0% - 12.5% ] 12.07% | 133,032 | 14.7% |
[ 12.0% - 12.5% ] 12.33% | 352,769 | 13.1% |
[ 12.5% - 13.0% ] 12.60% | 75,163 | 16.3% |
[ 12.5% - 13.0% ] 12.88% | 622,188 | 15.3% |
[ 13.0% - 13.5% ] 13.17% | 595,948 | 8.2% |
[ 13.0% - 13.5% ] 13.50% | 406,867 | 12.9% |
[ 13.5% - 14.0% ] 13.74% | 97,814 | 15.5% |
[ 14.0% - 14.5% ] 14.15% | 20,322 | 11.0% |
[ 14.0% - 14.5% ] 14.43% | 178,189 | 20.2% |
[ 14.5% - 15.0% ] 14.74% | 365,719 | 14.5% |
[ 14.5% - 15.0% ] 14.90% | 200,678 | 15.7% |
[ 15.0% - 15.5% ] 15.21% | 58,281 | 8.6% |
[ 15.5% - 16.0% ] 15.59% | 161,299 | 13.3% |
[ 15.5% - 16.0% ] 15.90% | 167,210 | 13.0% |
[ 16.0% - 16.5% ] 16.15% | 397,983 | 13.4% |
[ 16.0% - 16.5% ] 16.39% | 197,932 | 15.0% |
[ 16.5% - 17.0% ] 16.85% | 128,146 | 5.2% |
[ 17.0% - 17.5% ] 17.15% | 173,635 | 14.1% |
[ 17.0% - 17.5% ] 17.39% | 143,078 | 17.2% |
[ 17.5% - 18.0% ] 17.72% | 34,922 | 17.1% |
[ 17.5% - 18.0% ] 17.93% | 116,676 | 15.7% |
[ 18.0% - 18.5% ] 18.22% | 13,503 | 10.3% |
[ 18.0% - 18.5% ] 18.41% | 79,484 | 13.8% |
[ 18.5% - 19.0% ] 18.84% | 141,348 | 20.8% |
[ 19.0% - 19.5% ] 19.16% | 199,419 | 10.9% |
[ 19.0% - 19.5% ] 19.42% | 288,403 | 9.0% |
[ 19.5% - 20.0% ] 19.99% | 65,589 | 19.1% |
[ 20.0% - 20.5% ] 20.36% | 33,160 | 10.3% |
[ 20.5% - 21.0% ] 20.62% | 93,099 | 18.8% |
[ 20.5% - 21.0% ] 20.93% | 117,896 | 17.1% |
[ 21.0% - 21.5% ] 21.26% | 69,714 | 10.1% |
[ 21.5% - 22.0% ] 21.59% | 117,157 | 3.8% |
[ 21.5% - 22.0% ] 21.72% | 2,367 | 25.0% |
[ 22.0% - 22.5% ] 22.04% | 99,813 | 5.3% |
[ 22.0% - 22.5% ] 22.30% | 3,435 | 22.7% |
[ 22.5% - 23.0% ] 22.80% | 89,531 | 15.8% |
[ 22.5% - 23.0% ] 22.94% | 9,176 | 28.0% |
[ 23.0% - 23.5% ] 23.23% | 57,066 | 13.2% |
[ 23.5% - 24.0% ] 23.56% | 191 | 8.6% |
[ 24.0% - 24.5% ] 24.01% | 17,136 | 1.4% |
[ 24.0% - 24.5% ] 24.32% | 22,121 | 3.3% |
[ 24.5% - 25.0% ] 24.63% | 35,967 | 6.0% |
[ 24.5% - 25.0% ] 24.91% | 15,184 | 5.7% |
[ 25.0% - 25.5% ] 25.12% | 45,457 | 11.8% |
[ 26.0% - 26.5% ] 26.05% | 11,809 | 29.8% |
[ 26.0% - 26.5% ] 26.23% | 42,058 | 5.4% |
[ 26.5% - 27.0% ] 26.68% | 40,106 | 6.6% |
[ 26.5% - 27.0% ] 26.82% | 44,742 | 3.3% |
[ 27.0% - 27.5% ] 27.39% | 16,450 | 14.0% |
[ 27.5% - 28.0% ] 27.70% | 39,225 | 9.6% |
[ 28.0% - 28.5% ] 28.45% | 703 | 32.9% |
[ 29.0% - 29.5% ] 29.39% | 51,153 | 15.0% |
[ 29.5% - 30.0% ] 29.82% | 23,734 | 33.5% |
[ 31.5% - 32.0% ] 31.82% | 5,843 | 7.8% |
[ 32.0% - 32.5% ] 32.25% | 17,450 | 16.4% |
[ 32.0% - 32.5% ] 32.43% | 16,333 | 17.1% |
[ 33.5% - 34.0% ] 33.70% | 99,543 | 22.5% |
[ 34.0% - 34.5% ] 34.45% | 48,096 | 9.9% |
[ 36.5% - 37.0% ] 36.55% | 249 | 9.8% |
[ 40.0% - 40.5% ] 40.26% | 56,696 | 3.4% |
[ 40.0% - 40.5% ] 40.48% | 42 | 33.3% |
[ 43.5% - 44.0% ] 43.73% | 1,873 | 1.1% |
[ 47.5% - 48.0% ] 47.76% | 2,718 | 7.2% |
[ 53.5% - 54.0% ] 53.91% | 64,751 | 16.3% |
[ 54.0% - 54.5% ] 54.26% | 74,891 | 14.8% |