Immigrants from South America vs Dutch Married-Couple Family Poverty
COMPARE
Immigrants from South America
Dutch
Married-Couple Family Poverty
Married-Couple Family Poverty Comparison
Immigrants from South America
Dutch
5.7%
MARRIED-COUPLE FAMILY POVERTY
3.1/ 100
METRIC RATING
237th/ 347
METRIC RANK
4.2%
MARRIED-COUPLE FAMILY POVERTY
99.9/ 100
METRIC RATING
34th/ 347
METRIC RANK
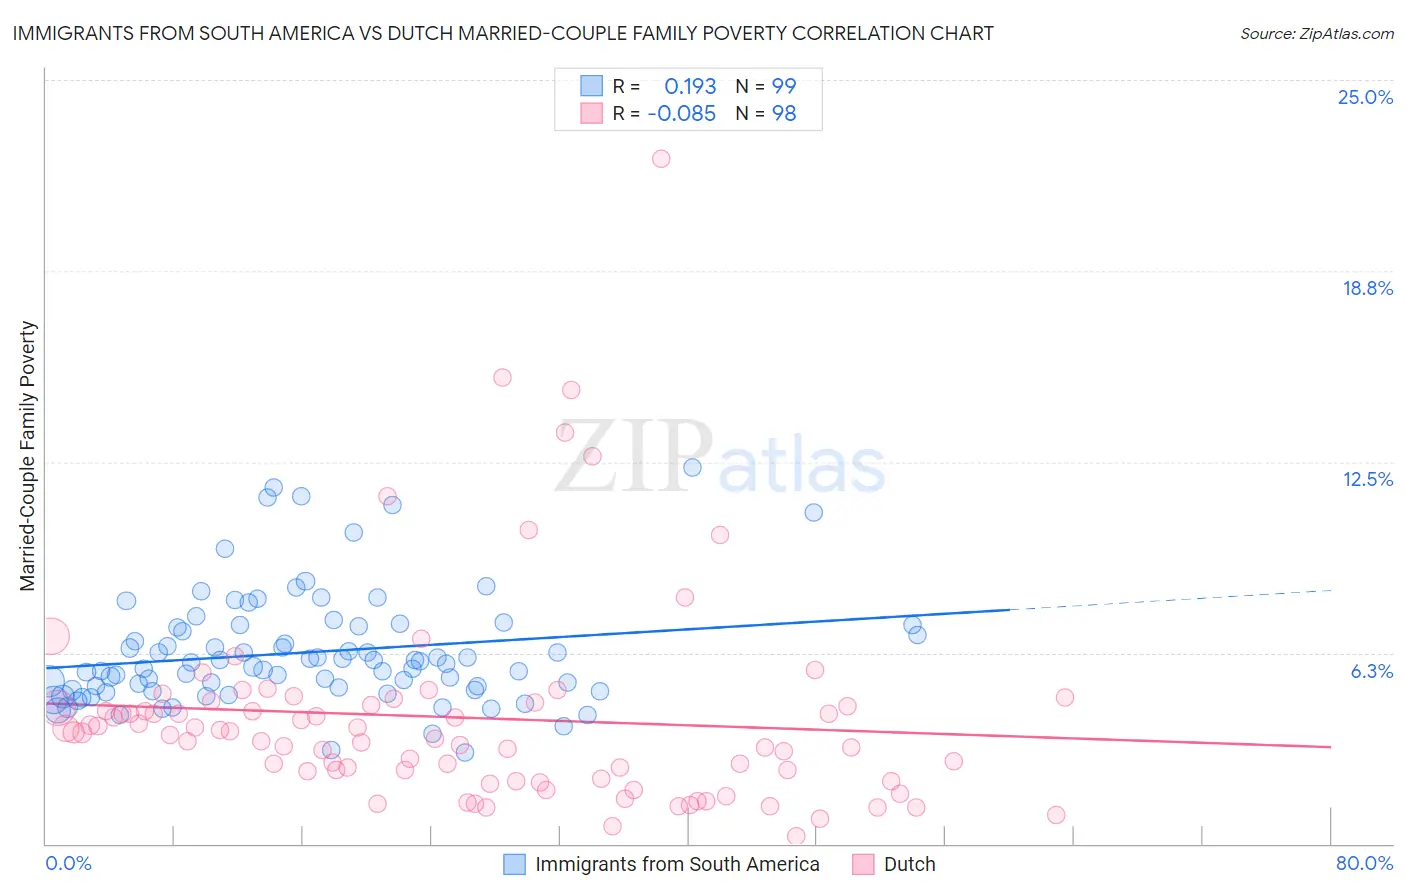
Immigrants from South America vs Dutch Married-Couple Family Poverty Correlation Chart
The statistical analysis conducted on geographies consisting of 479,571,466 people shows a poor positive correlation between the proportion of Immigrants from South America and poverty level among married-couple families in the United States with a correlation coefficient (R) of 0.193 and weighted average of 5.7%. Similarly, the statistical analysis conducted on geographies consisting of 541,561,341 people shows a slight negative correlation between the proportion of Dutch and poverty level among married-couple families in the United States with a correlation coefficient (R) of -0.085 and weighted average of 4.2%, a difference of 36.7%.
Married-Couple Family Poverty Correlation Summary
| Measurement | Immigrants from South America | Dutch |
| Minimum | 3.0% | 0.25% |
| Maximum | 12.3% | 22.4% |
| Range | 9.4% | 22.2% |
| Mean | 6.3% | 4.1% |
| Median | 5.9% | 3.6% |
| Interquartile 25% (IQ1) | 5.0% | 2.1% |
| Interquartile 75% (IQ3) | 7.1% | 4.5% |
| Interquartile Range (IQR) | 2.1% | 2.4% |
| Standard Deviation (Sample) | 1.9% | 3.4% |
| Standard Deviation (Population) | 1.9% | 3.4% |
Similar Demographics by Married-Couple Family Poverty
Demographics Similar to Immigrants from South America by Married-Couple Family Poverty
In terms of married-couple family poverty, the demographic groups most similar to Immigrants from South America are Ghanaian (5.7%, a difference of 0.16%), Immigrants from Sudan (5.7%, a difference of 0.32%), Cherokee (5.8%, a difference of 0.38%), Venezuelan (5.8%, a difference of 0.40%), and Immigrants from Uruguay (5.7%, a difference of 0.50%).
| Demographics | Rating | Rank | Married-Couple Family Poverty |
| Moroccans | 4.9 /100 | #230 | Tragic 5.7% |
| Immigrants | Iraq | 4.4 /100 | #231 | Tragic 5.7% |
| Immigrants | Laos | 4.4 /100 | #232 | Tragic 5.7% |
| Immigrants | Colombia | 3.7 /100 | #233 | Tragic 5.7% |
| Immigrants | Uruguay | 3.7 /100 | #234 | Tragic 5.7% |
| Immigrants | Sudan | 3.5 /100 | #235 | Tragic 5.7% |
| Ghanaians | 3.3 /100 | #236 | Tragic 5.7% |
| Immigrants | South America | 3.1 /100 | #237 | Tragic 5.7% |
| Cherokee | 2.7 /100 | #238 | Tragic 5.8% |
| Venezuelans | 2.7 /100 | #239 | Tragic 5.8% |
| Fijians | 2.5 /100 | #240 | Tragic 5.8% |
| Immigrants | Panama | 2.5 /100 | #241 | Tragic 5.8% |
| Immigrants | Western Africa | 2.4 /100 | #242 | Tragic 5.8% |
| Somalis | 2.3 /100 | #243 | Tragic 5.8% |
| Chickasaw | 2.3 /100 | #244 | Tragic 5.8% |
Demographics Similar to Dutch by Married-Couple Family Poverty
In terms of married-couple family poverty, the demographic groups most similar to Dutch are Irish (4.2%, a difference of 0.23%), European (4.2%, a difference of 0.57%), English (4.2%, a difference of 0.60%), Iranian (4.2%, a difference of 0.67%), and Greek (4.2%, a difference of 0.71%).
| Demographics | Rating | Rank | Married-Couple Family Poverty |
| Danes | 99.9 /100 | #27 | Exceptional 4.1% |
| Scandinavians | 99.9 /100 | #28 | Exceptional 4.1% |
| Immigrants | Scotland | 99.9 /100 | #29 | Exceptional 4.2% |
| Finns | 99.9 /100 | #30 | Exceptional 4.2% |
| Estonians | 99.9 /100 | #31 | Exceptional 4.2% |
| Greeks | 99.9 /100 | #32 | Exceptional 4.2% |
| Irish | 99.9 /100 | #33 | Exceptional 4.2% |
| Dutch | 99.9 /100 | #34 | Exceptional 4.2% |
| Europeans | 99.9 /100 | #35 | Exceptional 4.2% |
| English | 99.9 /100 | #36 | Exceptional 4.2% |
| Iranians | 99.9 /100 | #37 | Exceptional 4.2% |
| Belgians | 99.9 /100 | #38 | Exceptional 4.2% |
| Immigrants | Northern Europe | 99.8 /100 | #39 | Exceptional 4.2% |
| French Canadians | 99.8 /100 | #40 | Exceptional 4.2% |
| Northern Europeans | 99.8 /100 | #41 | Exceptional 4.3% |