Immigrants from South Africa Wage/Income Gap

COMPARE

Immigrants from South Africa
Race
Ancestry
AfghanAfricanAlaska NativeAlaskan AthabascanAlbanianAleutAlsatianAmericanApacheArabArapahoArgentineanArmenianAssyrian/Chaldean/SyriacAustralianAustrianBahamianBangladeshiBarbadianBasqueBelgianBelizeanBermudanBhutaneseBlackfeetBolivianBrazilianBritishBritish West IndianBulgarianBurmeseCajunCambodianCanadianCape VerdeanCarpatho RusynCelticCentral AmericanCentral American IndianCherokeeCheyenneChickasawChileanChineseChippewaChoctawColombianColvilleComancheCosta RicanCreeCreekCroatianCrowCubanCypriotCzechCzechoslovakianDanishDelawareDominicanDutchDutch West IndianEastern EuropeanEcuadorianEgyptianEnglishEstonianEthiopianEuropeanFijianFilipinoFinnishFrenchFrench American IndianFrench CanadianGermanGerman RussianGhanaianGreekGuamanian/ChamorroGuatemalanGuyaneseHaitianHmongHonduranHopiHoumaHungarianIcelanderIndian (Asian)IndonesianInupiatIranianIraqiIrishIroquoisIsraeliItalianJamaicanJapaneseJordanianKenyanKiowaKoreanLaotianLatvianLebaneseLiberianLithuanianLumbeeLuxembourgerMacedonianMalaysianMalteseMarshalleseMenomineeMexicanMexican American IndianMongolianMoroccanNative HawaiianNavajoNepaleseNew ZealanderNicaraguanNigerianNorthern EuropeanNorwegianOkinawanOsageOttawaPaiutePakistaniPalestinianPanamanianParaguayanPennsylvania GermanPeruvianPimaPolishPortuguesePotawatomiPuebloPuerto RicanPuget Sound SalishRomanianRussianSalvadoranSamoanScandinavianScotch-IrishScottishSeminoleSenegaleseSerbianShoshoneSierra LeoneanSiouxSlavicSlovakSloveneSomaliSouth AfricanSouth AmericanSouth American IndianSoviet UnionSpaniardSpanishSpanish AmericanSpanish American IndianSri LankanSubsaharan AfricanSudaneseSwedishSwissSyrianTaiwaneseThaiTlingit-HaidaTohono O'OdhamTonganTrinidadian and TobagonianTsimshianTurkishU.S. Virgin IslanderUgandanUkrainianUruguayanUteVenezuelanVietnameseWelshWest IndianYakamaYaquiYugoslavianYumanYup'ikZimbabwean
Immigration
NonimmigrantsImmigrantsAfghanistanAfricaAlbaniaArgentinaArmeniaAsiaAustraliaAustriaBahamasBangladeshBarbadosBelarusBelgiumBelizeBoliviaBosnia and HerzegovinaBrazilBulgariaBurma/MyanmarCabo VerdeCambodiaCameroonCanadaCaribbeanCentral AmericaChileChinaColombiaCongoCosta RicaCroatiaCubaCzechoslovakiaDenmarkDominicaDominican RepublicEastern AfricaEastern AsiaEastern EuropeEcuadorEgyptEl SalvadorEnglandEritreaEthiopiaEuropeFijiFranceGermanyGhanaGreeceGrenadaGuatemalaGuyanaHaitiHondurasHong KongHungaryIndiaIndonesiaIranIraqIrelandIsraelItalyJamaicaJapanJordanKazakhstanKenyaKoreaKuwaitLaosLatin AmericaLatviaLebanonLiberiaLithuaniaMalaysiaMexicoMicronesiaMiddle AfricaMoldovaMoroccoNepalNetherlandsNicaraguaNigeriaNorth AmericaNorth MacedoniaNorthern AfricaNorthern EuropeNorwayOceaniaPakistanPanamaPeruPhilippinesPolandPortugalRomaniaRussiaSaudi ArabiaScotlandSenegalSerbiaSierra LeoneSingaporeSomaliaSouth AfricaSouth AmericaSouth Central AsiaSouth Eastern AsiaSouthern EuropeSpainSri LankaSt. Vincent and the GrenadinesSudanSwedenSwitzerlandSyriaTaiwanThailandTrinidad and TobagoTurkeyUgandaUkraineUruguayUzbekistanVenezuelaVietnamWest IndiesWestern AfricaWestern AsiaWestern EuropeYemenZaireZimbabweAzores
Select to Compare
Race
Ancestry
AfghanAfricanAlaska NativeAlaskan AthabascanAlbanianAleutAlsatianAmericanApacheArabArapahoArgentineanArmenianAssyrian/Chaldean/SyriacAustralianAustrianBahamianBangladeshiBarbadianBasqueBelgianBelizeanBermudanBhutaneseBlackfeetBolivianBrazilianBritishBritish West IndianBulgarianBurmeseCajunCambodianCanadianCape VerdeanCarpatho RusynCelticCentral AmericanCentral American IndianCherokeeCheyenneChickasawChileanChineseChippewaChoctawColombianColvilleComancheCosta RicanCreeCreekCroatianCrowCubanCypriotCzechCzechoslovakianDanishDelawareDominicanDutchDutch West IndianEastern EuropeanEcuadorianEgyptianEnglishEstonianEthiopianEuropeanFijianFilipinoFinnishFrenchFrench American IndianFrench CanadianGermanGerman RussianGhanaianGreekGuamanian/ChamorroGuatemalanGuyaneseHaitianHmongHonduranHopiHoumaHungarianIcelanderIndian (Asian)IndonesianInupiatIranianIraqiIrishIroquoisIsraeliItalianJamaicanJapaneseJordanianKenyanKiowaKoreanLaotianLatvianLebaneseLiberianLithuanianLumbeeLuxembourgerMacedonianMalaysianMalteseMarshalleseMenomineeMexicanMexican American IndianMongolianMoroccanNative HawaiianNavajoNepaleseNew ZealanderNicaraguanNigerianNorthern EuropeanNorwegianOkinawanOsageOttawaPaiutePakistaniPalestinianPanamanianParaguayanPennsylvania GermanPeruvianPimaPolishPortuguesePotawatomiPuebloPuerto RicanPuget Sound SalishRomanianRussianSalvadoranSamoanScandinavianScotch-IrishScottishSeminoleSenegaleseSerbianShoshoneSierra LeoneanSiouxSlavicSlovakSloveneSomaliSouth AfricanSouth AmericanSouth American IndianSoviet UnionSpaniardSpanishSpanish AmericanSpanish American IndianSri LankanSubsaharan AfricanSudaneseSwedishSwissSyrianTaiwaneseThaiTlingit-HaidaTohono O'OdhamTonganTrinidadian and TobagonianTsimshianTurkishU.S. Virgin IslanderUgandanUkrainianUruguayanUteVenezuelanVietnameseWelshWest IndianYakamaYaquiYugoslavianYumanYup'ikZimbabwean
Immigration
NonimmigrantsImmigrantsAfghanistanAfricaAlbaniaArgentinaArmeniaAsiaAustraliaAustriaBahamasBangladeshBarbadosBelarusBelgiumBelizeBoliviaBosnia and HerzegovinaBrazilBulgariaBurma/MyanmarCabo VerdeCambodiaCameroonCanadaCaribbeanCentral AmericaChileChinaColombiaCongoCosta RicaCroatiaCubaCzechoslovakiaDenmarkDominicaDominican RepublicEastern AfricaEastern AsiaEastern EuropeEcuadorEgyptEl SalvadorEnglandEritreaEthiopiaEuropeFijiFranceGermanyGhanaGreeceGrenadaGuatemalaGuyanaHaitiHondurasHong KongHungaryIndiaIndonesiaIranIraqIrelandIsraelItalyJamaicaJapanJordanKazakhstanKenyaKoreaKuwaitLaosLatin AmericaLatviaLebanonLiberiaLithuaniaMalaysiaMexicoMicronesiaMiddle AfricaMoldovaMoroccoNepalNetherlandsNicaraguaNigeriaNorth AmericaNorth MacedoniaNorthern AfricaNorthern EuropeNorwayOceaniaPakistanPanamaPeruPhilippinesPolandPortugalRomaniaRussiaSaudi ArabiaScotlandSenegalSerbiaSierra LeoneSingaporeSomaliaSouth AmericaSouth Central AsiaSouth Eastern AsiaSouthern EuropeSpainSri LankaSt. Vincent and the GrenadinesSudanSwedenSwitzerlandSyriaTaiwanThailandTrinidad and TobagoTurkeyUgandaUkraineUruguayUzbekistanVenezuelaVietnamWest IndiesWestern AfricaWestern AsiaWestern EuropeYemenZaireZimbabweAzores
Wage/Income Gap
Income
Poverty
Unemployment
Labor Participation
Family Structure
Vehicle Availability
Education Level
Disability

Immigrants from South Africa Wage/Income Gap
Tragic

28.5%
WAGE/INCOME GAP
0.1/ 100
METRIC RATING
305th/ 347
METRIC RANK

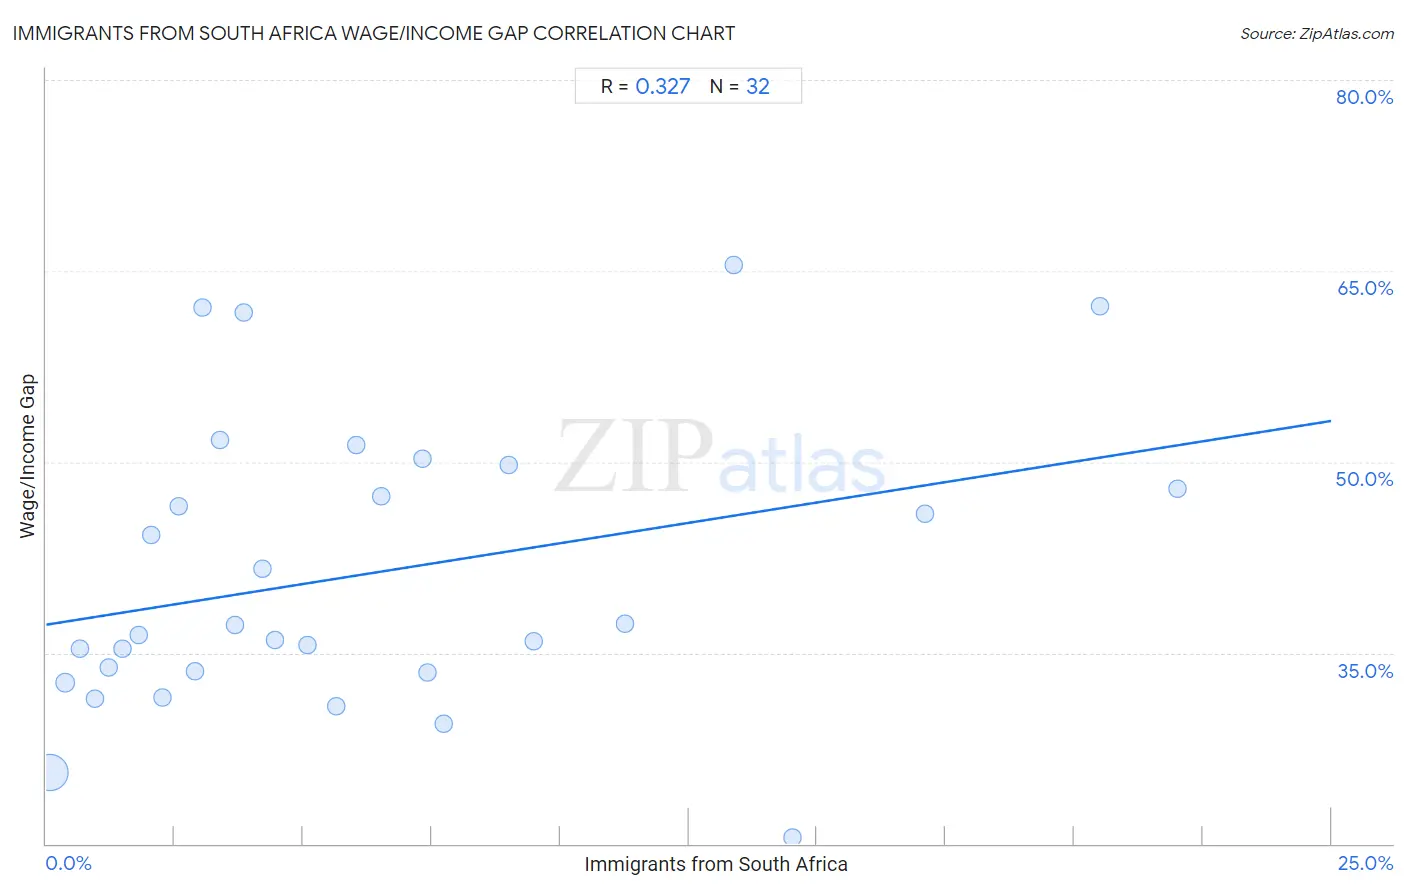
Immigrants from South Africa Wage/Income Gap Correlation Chart

The statistical analysis conducted on geographies consisting of 233,231,718 people shows a mild positive correlation between the proportion of Immigrants from South Africa and wage/income gap percentage in the United States with a correlation coefficient (R) of 0.327 and weighted average of 28.5%. On average, for every 1% (one percent) increase in Immigrants from South Africa within a typical geography, there is an increase of 0.64% in wage/income gap percentage.
Immigrants from South Africa Wage/Income Gap
It is essential to understand that the correlation between the percentage of Immigrants from South Africa and wage/income gap percentage does not imply a direct cause-and-effect relationship. It remains uncertain whether the presence of Immigrants from South Africa influences an upward or downward trend in the level of wage/income gap percentage within an area, or if Immigrants from South Africa simply ended up residing in those areas with higher or lower levels of wage/income gap percentage due to other factors.

Demographics Similar to Immigrants from South Africa by Wage/Income Gap

In terms of wage/income gap, the demographic groups most similar to Immigrants from South Africa are Immigrants from Netherlands (28.5%, a difference of 0.020%), White/Caucasian (28.5%, a difference of 0.050%), Immigrants from Denmark (28.5%, a difference of 0.050%), Scotch-Irish (28.5%, a difference of 0.10%), and Irish (28.5%, a difference of 0.10%).
DemographicsRating | RankWage/Income Gap
Austrians
0.2
/100
|
#298
Tragic
28.4%
Immigrants from North Macedonia
0.2
/100
|
#299
Tragic
28.4%
Immigrants from Northern Europe
0.2
/100
|
#300
Tragic
28.5%
Immigrants from Canada
0.2
/100
|
#301
Tragic
28.5%
Scotch-Irish
0.2
/100
|
#302
Tragic
28.5%
Irish
0.2
/100
|
#303
Tragic
28.5%
Immigrants from Netherlands
0.2
/100
|
#304
Tragic
28.5%
Immigrants from South Africa
0.1
/100
|
#305
Tragic
28.5%
Whites/Caucasians
0.1
/100
|
#306
Tragic
28.5%
Immigrants from Denmark
0.1
/100
|
#307
Tragic
28.5%
Poles
0.1
/100
|
#308
Tragic
28.5%
Macedonians
0.1
/100
|
#309
Tragic
28.6%
Finns
0.1
/100
|
#310
Tragic
28.6%
Immigrants from Lithuania
0.1
/100
|
#311
Tragic
28.6%
Eastern Europeans
0.1
/100
|
#312
Tragic
28.6%

Immigrants from South Africa Wage/Income Gap Correlation Summary

MeasurementImmigrants from South Africa DataWage/Income Gap Data
Minimum0.064%20.5%
Maximum22.0%65.5%
Range21.9%45.0%
Mean6.3%41.2%
Median4.3%36.8%
Interquartile 25% (IQ1)2.1%33.5%
Interquartile 75% (IQ3)8.4%48.8%
Interquartile Range (IQR)6.2%15.3%
Standard Deviation (Sample)5.8%11.3%
Standard Deviation (Population)5.7%11.1%

Correlation Details

Immigrants from South Africa PercentileSample SizeWage/Income Gap
[
0.0%
-
0.5%
]
0.064%
219,867,05525.6%
[
0.0%
-
0.5%
]
0.37%
10,317,44532.7%
[
0.5%
-
1.0%
]
0.66%
1,527,51735.3%
[
0.5%
-
1.0%
]
0.94%
801,95131.4%
[
1.0%
-
1.5%
]
1.22%
303,82833.9%
[
1.0%
-
1.5%
]
1.49%
216,38835.3%
[
1.5%
-
2.0%
]
1.79%
26,73036.4%
[
2.0%
-
2.5%
]
2.04%
39,89544.3%
[
2.0%
-
2.5%
]
2.25%
23,78931.5%
[
2.5%
-
3.0%
]
2.57%
15,35946.5%
[
2.5%
-
3.0%
]
2.88%
6,41333.6%
[
3.0%
-
3.5%
]
3.05%
30,96562.1%
[
3.0%
-
3.5%
]
3.37%
3,61551.7%
[
3.5%
-
4.0%
]
3.68%
4,01937.2%
[
3.5%
-
4.0%
]
3.84%
25,86961.7%
[
4.0%
-
4.5%
]
4.21%
2,32641.6%
[
4.0%
-
4.5%
]
4.46%
3,54136.0%
[
5.0%
-
5.5%
]
5.08%
1,33935.6%
[
5.5%
-
6.0%
]
5.64%
33730.9%
[
6.0%
-
6.5%
]
6.02%
8351.4%
[
6.5%
-
7.0%
]
6.53%
3,90847.3%
[
7.0%
-
7.5%
]
7.32%
5,12250.2%
[
7.0%
-
7.5%
]
7.41%
21633.5%
[
7.5%
-
8.0%
]
7.74%
96929.4%
[
9.0%
-
9.5%
]
9.01%
74449.8%
[
9.0%
-
9.5%
]
9.47%
19035.9%
[
11.0%
-
11.5%
]
11.26%
43537.3%
[
13.0%
-
13.5%
]
13.37%
17265.5%
[
14.5%
-
15.0%
]
14.52%
49620.5%
[
17.0%
-
17.5%
]
17.11%
53245.9%
[
20.0%
-
20.5%
]
20.50%
16162.2%
[
22.0%
-
22.5%
]
22.01%
30947.9%