Immigrants from South Africa 3 or more Vehicles in Household
COMPARE
Immigrants from South Africa
Select to Compare
3 or more Vehicles in Household
Immigrants from South Africa 3 or more Vehicles in Household
19.5%
3+ VEHICLES AVAILABLE
50.0/ 100
METRIC RATING
174th/ 347
METRIC RANK
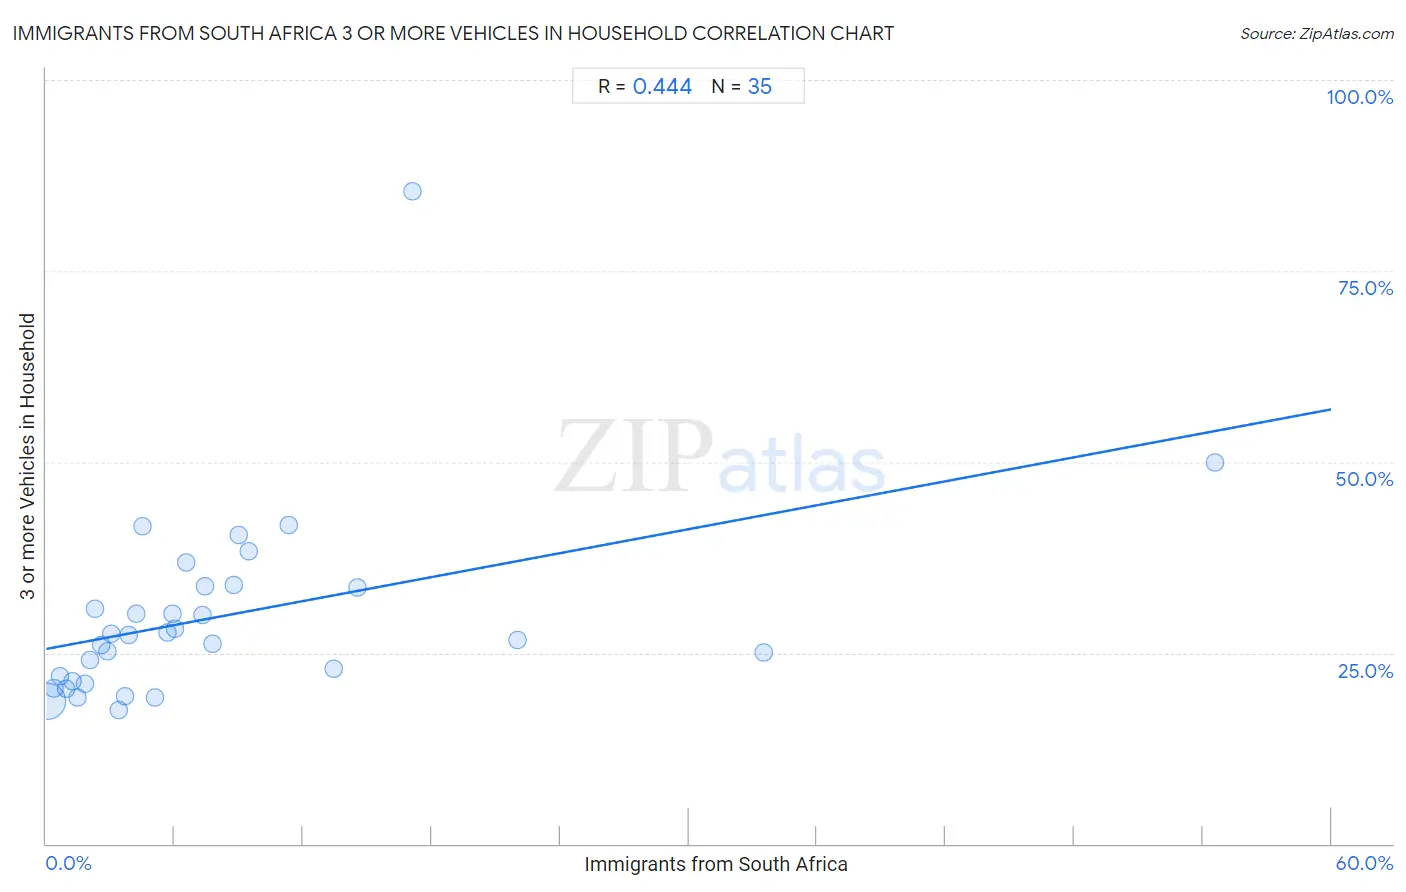
Immigrants from South Africa 3 or more Vehicles in Household Correlation Chart
The statistical analysis conducted on geographies consisting of 233,251,888 people shows a moderate positive correlation between the proportion of Immigrants from South Africa and percentage of households with 3 or more vehicles available in the United States with a correlation coefficient (R) of 0.444 and weighted average of 19.5%. On average, for every 1% (one percent) increase in Immigrants from South Africa within a typical geography, there is an increase of 0.52% in percentage of households with 3 or more vehicles available.
It is essential to understand that the correlation between the percentage of Immigrants from South Africa and percentage of households with 3 or more vehicles available does not imply a direct cause-and-effect relationship. It remains uncertain whether the presence of Immigrants from South Africa influences an upward or downward trend in the level of percentage of households with 3 or more vehicles available within an area, or if Immigrants from South Africa simply ended up residing in those areas with higher or lower levels of percentage of households with 3 or more vehicles available due to other factors.
Demographics Similar to Immigrants from South Africa by 3 or more Vehicles in Household
In terms of 3 or more vehicles in household, the demographic groups most similar to Immigrants from South Africa are Immigrants from Northern Europe (19.5%, a difference of 0.020%), Kiowa (19.5%, a difference of 0.070%), Syrian (19.5%, a difference of 0.23%), Immigrants from Western Europe (19.5%, a difference of 0.24%), and Iroquois (19.4%, a difference of 0.30%).
| Demographics | Rating | Rank | 3 or more Vehicles in Household |
| Ukrainians | 58.9 /100 | #167 | Average 19.6% |
| Peruvians | 58.8 /100 | #168 | Average 19.6% |
| Immigrants from Denmark | 57.6 /100 | #169 | Average 19.6% |
| Iraqis | 56.0 /100 | #170 | Average 19.6% |
| Immigrants from Western Europe | 53.2 /100 | #171 | Average 19.5% |
| Kiowa | 50.9 /100 | #172 | Average 19.5% |
| Immigrants from Northern Europe | 50.2 /100 | #173 | Average 19.5% |
| Immigrants from South Africa | 50.0 /100 | #174 | Average 19.5% |
| Syrians | 47.0 /100 | #175 | Average 19.5% |
| Iroquois | 46.0 /100 | #176 | Average 19.4% |
| Immigrants from Peru | 41.1 /100 | #177 | Average 19.4% |
| Immigrants from Syria | 40.3 /100 | #178 | Average 19.4% |
| Immigrants from South Central Asia | 38.9 /100 | #179 | Fair 19.3% |
| South Africans | 37.5 /100 | #180 | Fair 19.3% |
| Romanians | 37.1 /100 | #181 | Fair 19.3% |
Immigrants from South Africa 3 or more Vehicles in Household Correlation Summary
| Measurement | Immigrants from South Africa Data | 3 or more Vehicles in Household Data |
| Minimum | 0.064% | 17.5% |
| Maximum | 54.5% | 85.5% |
| Range | 54.5% | 68.0% |
| Mean | 8.1% | 29.8% |
| Median | 5.1% | 27.3% |
| Interquartile 25% (IQ1) | 2.3% | 21.3% |
| Interquartile 75% (IQ3) | 9.0% | 33.7% |
| Interquartile Range (IQR) | 6.7% | 12.4% |
| Standard Deviation (Sample) | 10.6% | 12.4% |
| Standard Deviation (Population) | 10.4% | 12.3% |
Correlation Details
| Immigrants from South Africa Percentile | Sample Size | 3 or more Vehicles in Household |
[ 0.0% - 0.5% ] 0.064% | 219,863,525 | 18.6% |
[ 0.0% - 0.5% ] 0.37% | 10,325,667 | 20.3% |
[ 0.5% - 1.0% ] 0.66% | 1,520,421 | 21.9% |
[ 0.5% - 1.0% ] 0.94% | 802,045 | 20.3% |
[ 1.0% - 1.5% ] 1.22% | 309,516 | 21.3% |
[ 1.0% - 1.5% ] 1.49% | 218,816 | 19.2% |
[ 1.5% - 2.0% ] 1.79% | 28,972 | 20.9% |
[ 2.0% - 2.5% ] 2.04% | 41,917 | 24.1% |
[ 2.0% - 2.5% ] 2.26% | 24,418 | 30.7% |
[ 2.5% - 3.0% ] 2.58% | 17,228 | 26.1% |
[ 2.5% - 3.0% ] 2.86% | 10,344 | 25.1% |
[ 3.0% - 3.5% ] 3.05% | 29,649 | 27.4% |
[ 3.0% - 3.5% ] 3.37% | 3,852 | 17.5% |
[ 3.5% - 4.0% ] 3.69% | 4,151 | 19.2% |
[ 3.5% - 4.0% ] 3.84% | 25,869 | 27.3% |
[ 4.0% - 4.5% ] 4.20% | 3,859 | 30.1% |
[ 4.0% - 4.5% ] 4.47% | 3,694 | 41.5% |
[ 5.0% - 5.5% ] 5.08% | 1,339 | 19.1% |
[ 5.5% - 6.0% ] 5.65% | 1,132 | 27.7% |
[ 5.5% - 6.0% ] 5.92% | 152 | 30.2% |
[ 6.0% - 6.5% ] 6.02% | 83 | 28.2% |
[ 6.5% - 7.0% ] 6.53% | 3,908 | 36.9% |
[ 7.0% - 7.5% ] 7.31% | 5,790 | 30.0% |
[ 7.0% - 7.5% ] 7.41% | 216 | 33.7% |
[ 7.5% - 8.0% ] 7.75% | 1,588 | 26.2% |
[ 8.5% - 9.0% ] 8.76% | 251 | 33.9% |
[ 9.0% - 9.5% ] 9.01% | 744 | 40.4% |
[ 9.0% - 9.5% ] 9.47% | 190 | 38.2% |
[ 11.0% - 11.5% ] 11.31% | 778 | 41.8% |
[ 13.0% - 13.5% ] 13.44% | 253 | 22.9% |
[ 14.5% - 15.0% ] 14.52% | 496 | 33.5% |
[ 17.0% - 17.5% ] 17.11% | 532 | 85.5% |
[ 22.0% - 22.5% ] 22.01% | 309 | 26.6% |
[ 33.5% - 34.0% ] 33.53% | 173 | 25.0% |
[ 54.5% - 55.0% ] 54.55% | 11 | 50.0% |