Immigrants from Serbia vs Bangladeshi Married-Couple Family Poverty
COMPARE
Immigrants from Serbia
Bangladeshi
Married-Couple Family Poverty
Married-Couple Family Poverty Comparison
Immigrants from Serbia
Bangladeshis
4.4%
MARRIED-COUPLE FAMILY POVERTY
99.4/ 100
METRIC RATING
66th/ 347
METRIC RANK
6.0%
MARRIED-COUPLE FAMILY POVERTY
0.5/ 100
METRIC RATING
256th/ 347
METRIC RANK
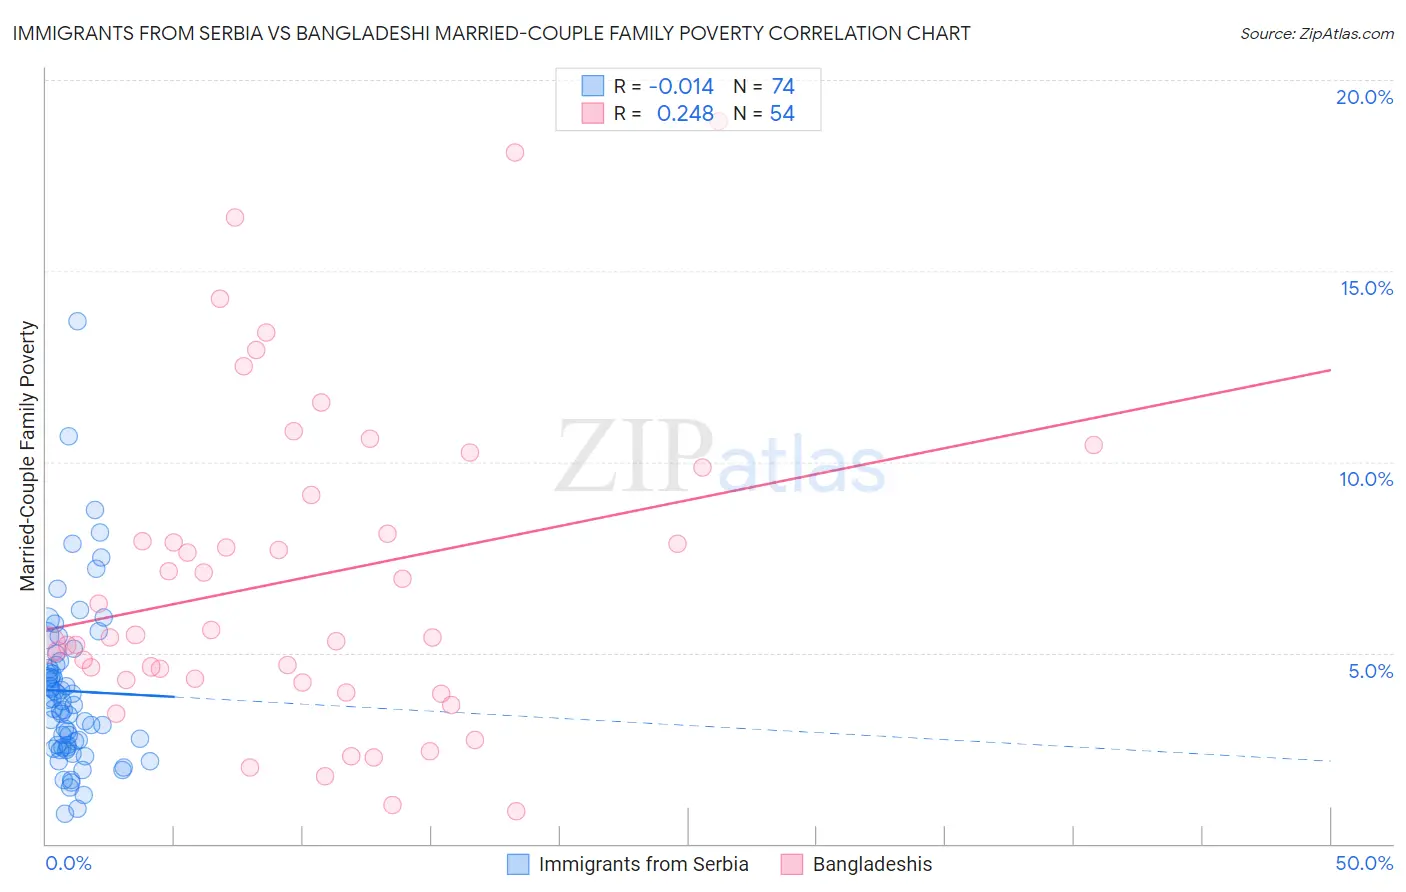
Immigrants from Serbia vs Bangladeshi Married-Couple Family Poverty Correlation Chart
The statistical analysis conducted on geographies consisting of 131,455,984 people shows no correlation between the proportion of Immigrants from Serbia and poverty level among married-couple families in the United States with a correlation coefficient (R) of -0.014 and weighted average of 4.4%. Similarly, the statistical analysis conducted on geographies consisting of 140,885,862 people shows a weak positive correlation between the proportion of Bangladeshis and poverty level among married-couple families in the United States with a correlation coefficient (R) of 0.248 and weighted average of 6.0%, a difference of 35.2%.
Married-Couple Family Poverty Correlation Summary
| Measurement | Immigrants from Serbia | Bangladeshi |
| Minimum | 0.78% | 0.85% |
| Maximum | 13.7% | 18.9% |
| Range | 12.9% | 18.1% |
| Mean | 4.0% | 7.0% |
| Median | 3.6% | 5.4% |
| Interquartile 25% (IQ1) | 2.5% | 4.3% |
| Interquartile 75% (IQ3) | 4.7% | 9.1% |
| Interquartile Range (IQR) | 2.2% | 4.9% |
| Standard Deviation (Sample) | 2.2% | 4.2% |
| Standard Deviation (Population) | 2.2% | 4.2% |
Similar Demographics by Married-Couple Family Poverty
Demographics Similar to Immigrants from Serbia by Married-Couple Family Poverty
In terms of married-couple family poverty, the demographic groups most similar to Immigrants from Serbia are Immigrants from Canada (4.4%, a difference of 0.050%), Slavic (4.4%, a difference of 0.060%), New Zealander (4.4%, a difference of 0.070%), Macedonian (4.4%, a difference of 0.13%), and Immigrants from Korea (4.5%, a difference of 0.20%).
| Demographics | Rating | Rank | Married-Couple Family Poverty |
| Immigrants | Sweden | 99.6 /100 | #59 | Exceptional 4.4% |
| Tlingit-Haida | 99.6 /100 | #60 | Exceptional 4.4% |
| Okinawans | 99.6 /100 | #61 | Exceptional 4.4% |
| Immigrants | Australia | 99.6 /100 | #62 | Exceptional 4.4% |
| Immigrants | Sri Lanka | 99.6 /100 | #63 | Exceptional 4.4% |
| Immigrants | Bulgaria | 99.5 /100 | #64 | Exceptional 4.4% |
| Macedonians | 99.4 /100 | #65 | Exceptional 4.4% |
| Immigrants | Serbia | 99.4 /100 | #66 | Exceptional 4.4% |
| Immigrants | Canada | 99.4 /100 | #67 | Exceptional 4.4% |
| Slavs | 99.4 /100 | #68 | Exceptional 4.4% |
| New Zealanders | 99.4 /100 | #69 | Exceptional 4.4% |
| Immigrants | Korea | 99.4 /100 | #70 | Exceptional 4.5% |
| Immigrants | North America | 99.3 /100 | #71 | Exceptional 4.5% |
| Immigrants | England | 99.3 /100 | #72 | Exceptional 4.5% |
| Ukrainians | 99.2 /100 | #73 | Exceptional 4.5% |
Demographics Similar to Bangladeshis by Married-Couple Family Poverty
In terms of married-couple family poverty, the demographic groups most similar to Bangladeshis are Immigrants from Burma/Myanmar (6.0%, a difference of 0.24%), Immigrants (6.0%, a difference of 0.37%), Comanche (6.0%, a difference of 0.50%), Immigrants from Somalia (6.0%, a difference of 0.65%), and African (6.0%, a difference of 0.71%).
| Demographics | Rating | Rank | Married-Couple Family Poverty |
| Tsimshian | 1.1 /100 | #249 | Tragic 5.9% |
| Immigrants | Eritrea | 1.1 /100 | #250 | Tragic 5.9% |
| Immigrants | Ghana | 1.0 /100 | #251 | Tragic 5.9% |
| Immigrants | Western Asia | 0.7 /100 | #252 | Tragic 6.0% |
| Africans | 0.7 /100 | #253 | Tragic 6.0% |
| Immigrants | Somalia | 0.7 /100 | #254 | Tragic 6.0% |
| Comanche | 0.7 /100 | #255 | Tragic 6.0% |
| Bangladeshis | 0.5 /100 | #256 | Tragic 6.0% |
| Immigrants | Burma/Myanmar | 0.5 /100 | #257 | Tragic 6.0% |
| Immigrants | Immigrants | 0.5 /100 | #258 | Tragic 6.0% |
| Alaskan Athabascans | 0.4 /100 | #259 | Tragic 6.1% |
| Jamaicans | 0.3 /100 | #260 | Tragic 6.1% |
| Senegalese | 0.3 /100 | #261 | Tragic 6.1% |
| Shoshone | 0.3 /100 | #262 | Tragic 6.1% |
| Immigrants | Senegal | 0.3 /100 | #263 | Tragic 6.1% |