Immigrants from Serbia vs Immigrants from Nicaragua Married-Couple Family Poverty
COMPARE
Immigrants from Serbia
Immigrants from Nicaragua
Married-Couple Family Poverty
Married-Couple Family Poverty Comparison
Immigrants from Serbia
Immigrants from Nicaragua
4.4%
MARRIED-COUPLE FAMILY POVERTY
99.4/ 100
METRIC RATING
66th/ 347
METRIC RANK
7.1%
MARRIED-COUPLE FAMILY POVERTY
0.0/ 100
METRIC RATING
310th/ 347
METRIC RANK
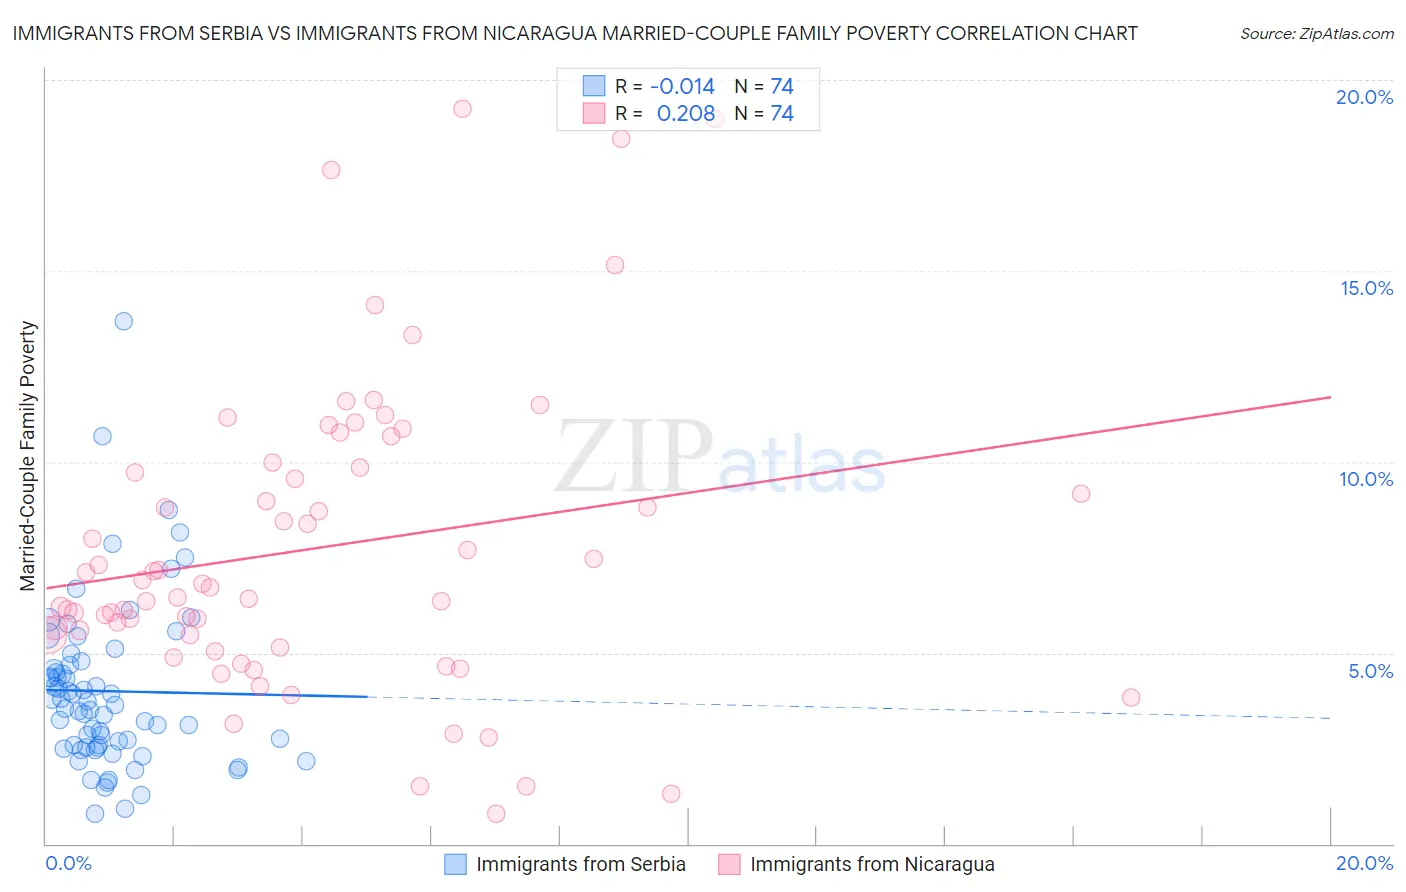
Immigrants from Serbia vs Immigrants from Nicaragua Married-Couple Family Poverty Correlation Chart
The statistical analysis conducted on geographies consisting of 131,455,984 people shows no correlation between the proportion of Immigrants from Serbia and poverty level among married-couple families in the United States with a correlation coefficient (R) of -0.014 and weighted average of 4.4%. Similarly, the statistical analysis conducted on geographies consisting of 235,581,482 people shows a weak positive correlation between the proportion of Immigrants from Nicaragua and poverty level among married-couple families in the United States with a correlation coefficient (R) of 0.208 and weighted average of 7.1%, a difference of 59.7%.
Married-Couple Family Poverty Correlation Summary
| Measurement | Immigrants from Serbia | Immigrants from Nicaragua |
| Minimum | 0.78% | 0.79% |
| Maximum | 13.7% | 19.2% |
| Range | 12.9% | 18.4% |
| Mean | 4.0% | 7.7% |
| Median | 3.6% | 6.8% |
| Interquartile 25% (IQ1) | 2.5% | 5.5% |
| Interquartile 75% (IQ3) | 4.7% | 9.9% |
| Interquartile Range (IQR) | 2.2% | 4.4% |
| Standard Deviation (Sample) | 2.2% | 4.0% |
| Standard Deviation (Population) | 2.2% | 3.9% |
Similar Demographics by Married-Couple Family Poverty
Demographics Similar to Immigrants from Serbia by Married-Couple Family Poverty
In terms of married-couple family poverty, the demographic groups most similar to Immigrants from Serbia are Immigrants from Canada (4.4%, a difference of 0.050%), Slavic (4.4%, a difference of 0.060%), New Zealander (4.4%, a difference of 0.070%), Macedonian (4.4%, a difference of 0.13%), and Immigrants from Korea (4.5%, a difference of 0.20%).
| Demographics | Rating | Rank | Married-Couple Family Poverty |
| Immigrants | Sweden | 99.6 /100 | #59 | Exceptional 4.4% |
| Tlingit-Haida | 99.6 /100 | #60 | Exceptional 4.4% |
| Okinawans | 99.6 /100 | #61 | Exceptional 4.4% |
| Immigrants | Australia | 99.6 /100 | #62 | Exceptional 4.4% |
| Immigrants | Sri Lanka | 99.6 /100 | #63 | Exceptional 4.4% |
| Immigrants | Bulgaria | 99.5 /100 | #64 | Exceptional 4.4% |
| Macedonians | 99.4 /100 | #65 | Exceptional 4.4% |
| Immigrants | Serbia | 99.4 /100 | #66 | Exceptional 4.4% |
| Immigrants | Canada | 99.4 /100 | #67 | Exceptional 4.4% |
| Slavs | 99.4 /100 | #68 | Exceptional 4.4% |
| New Zealanders | 99.4 /100 | #69 | Exceptional 4.4% |
| Immigrants | Korea | 99.4 /100 | #70 | Exceptional 4.5% |
| Immigrants | North America | 99.3 /100 | #71 | Exceptional 4.5% |
| Immigrants | England | 99.3 /100 | #72 | Exceptional 4.5% |
| Ukrainians | 99.2 /100 | #73 | Exceptional 4.5% |
Demographics Similar to Immigrants from Nicaragua by Married-Couple Family Poverty
In terms of married-couple family poverty, the demographic groups most similar to Immigrants from Nicaragua are Hopi (7.1%, a difference of 0.030%), Immigrants from Dominica (7.1%, a difference of 0.050%), Immigrants from Armenia (7.1%, a difference of 0.050%), Immigrants from St. Vincent and the Grenadines (7.1%, a difference of 0.17%), and British West Indian (7.1%, a difference of 0.47%).
| Demographics | Rating | Rank | Married-Couple Family Poverty |
| Immigrants | El Salvador | 0.0 /100 | #303 | Tragic 6.8% |
| Cubans | 0.0 /100 | #304 | Tragic 6.8% |
| Haitians | 0.0 /100 | #305 | Tragic 6.8% |
| Immigrants | Haiti | 0.0 /100 | #306 | Tragic 7.0% |
| Guatemalans | 0.0 /100 | #307 | Tragic 7.0% |
| Spanish American Indians | 0.0 /100 | #308 | Tragic 7.1% |
| Hopi | 0.0 /100 | #309 | Tragic 7.1% |
| Immigrants | Nicaragua | 0.0 /100 | #310 | Tragic 7.1% |
| Immigrants | Dominica | 0.0 /100 | #311 | Tragic 7.1% |
| Immigrants | Armenia | 0.0 /100 | #312 | Tragic 7.1% |
| Immigrants | St. Vincent and the Grenadines | 0.0 /100 | #313 | Tragic 7.1% |
| British West Indians | 0.0 /100 | #314 | Tragic 7.1% |
| Inupiat | 0.0 /100 | #315 | Tragic 7.1% |
| Hondurans | 0.0 /100 | #316 | Tragic 7.2% |
| Mexicans | 0.0 /100 | #317 | Tragic 7.2% |