Immigrants from Northern Africa vs Swiss Married-Couple Family Poverty
COMPARE
Immigrants from Northern Africa
Swiss
Married-Couple Family Poverty
Married-Couple Family Poverty Comparison
Immigrants from Northern Africa
Swiss
5.2%
MARRIED-COUPLE FAMILY POVERTY
51.3/ 100
METRIC RATING
172nd/ 347
METRIC RANK
4.3%
MARRIED-COUPLE FAMILY POVERTY
99.8/ 100
METRIC RATING
43rd/ 347
METRIC RANK
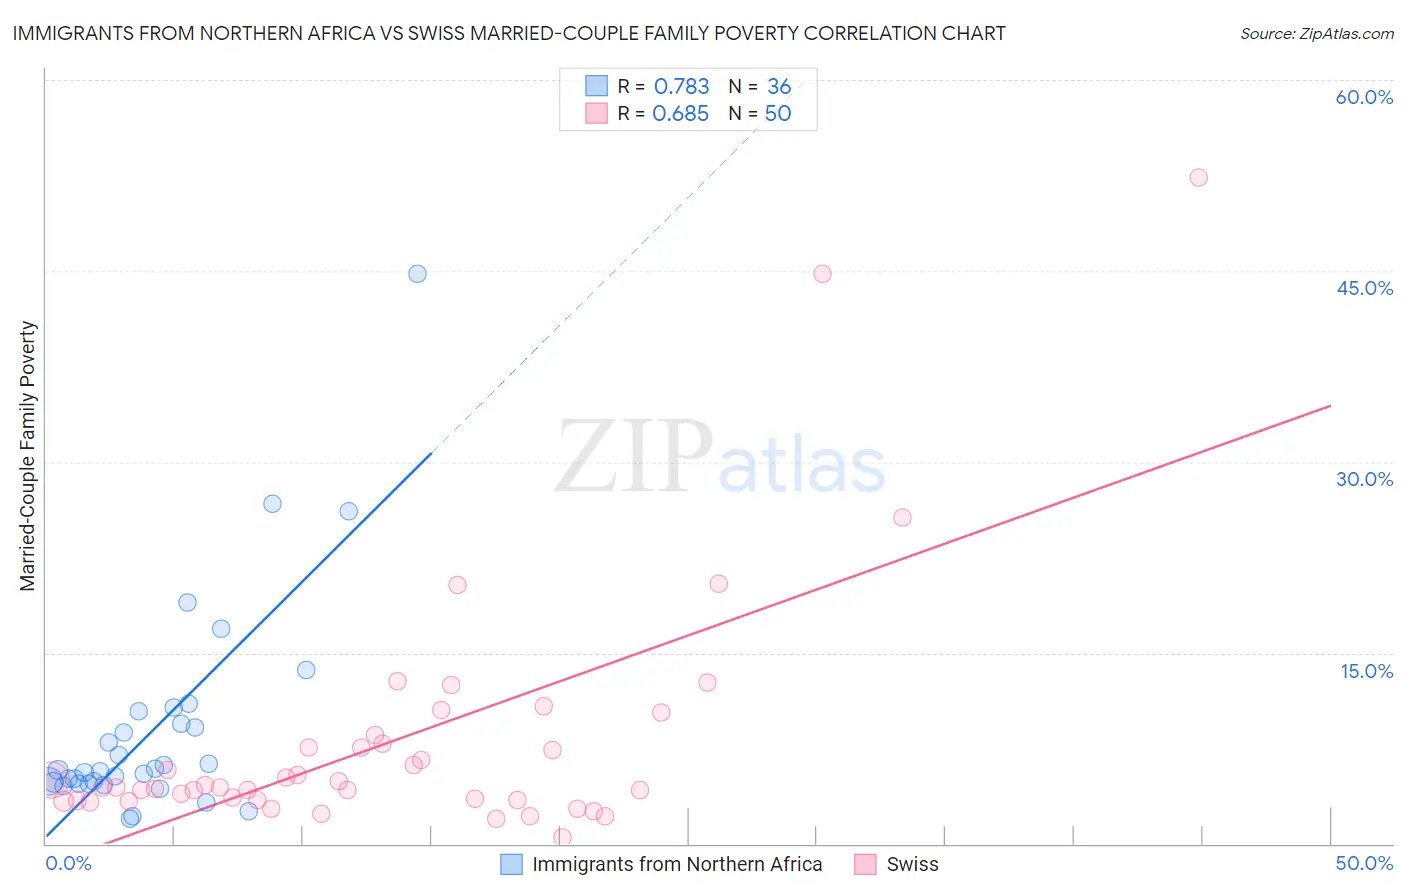
Immigrants from Northern Africa vs Swiss Married-Couple Family Poverty Correlation Chart
The statistical analysis conducted on geographies consisting of 319,156,358 people shows a strong positive correlation between the proportion of Immigrants from Northern Africa and poverty level among married-couple families in the United States with a correlation coefficient (R) of 0.783 and weighted average of 5.2%. Similarly, the statistical analysis conducted on geographies consisting of 457,863,093 people shows a significant positive correlation between the proportion of Swiss and poverty level among married-couple families in the United States with a correlation coefficient (R) of 0.685 and weighted average of 4.3%, a difference of 21.6%.
Married-Couple Family Poverty Correlation Summary
| Measurement | Immigrants from Northern Africa | Swiss |
| Minimum | 2.0% | 0.49% |
| Maximum | 44.8% | 52.4% |
| Range | 42.8% | 51.9% |
| Mean | 9.0% | 8.1% |
| Median | 5.7% | 4.4% |
| Interquartile 25% (IQ1) | 4.8% | 3.4% |
| Interquartile 75% (IQ3) | 9.9% | 7.8% |
| Interquartile Range (IQR) | 5.2% | 4.4% |
| Standard Deviation (Sample) | 8.5% | 9.8% |
| Standard Deviation (Population) | 8.4% | 9.7% |
Similar Demographics by Married-Couple Family Poverty
Demographics Similar to Immigrants from Northern Africa by Married-Couple Family Poverty
In terms of married-couple family poverty, the demographic groups most similar to Immigrants from Northern Africa are Alsatian (5.2%, a difference of 0.020%), Immigrants from Eastern Africa (5.2%, a difference of 0.16%), Bermudan (5.2%, a difference of 0.18%), Immigrants from Argentina (5.2%, a difference of 0.35%), and Ottawa (5.2%, a difference of 0.37%).
| Demographics | Rating | Rank | Married-Couple Family Poverty |
| Immigrants | Malaysia | 62.2 /100 | #165 | Good 5.1% |
| Paraguayans | 61.5 /100 | #166 | Good 5.1% |
| Costa Ricans | 61.5 /100 | #167 | Good 5.1% |
| Immigrants | Uganda | 54.9 /100 | #168 | Average 5.2% |
| Ottawa | 54.5 /100 | #169 | Average 5.2% |
| Immigrants | Argentina | 54.4 /100 | #170 | Average 5.2% |
| Bermudans | 52.9 /100 | #171 | Average 5.2% |
| Immigrants | Northern Africa | 51.3 /100 | #172 | Average 5.2% |
| Alsatians | 51.2 /100 | #173 | Average 5.2% |
| Immigrants | Eastern Africa | 50.0 /100 | #174 | Average 5.2% |
| Marshallese | 47.9 /100 | #175 | Average 5.2% |
| Menominee | 47.8 /100 | #176 | Average 5.2% |
| Immigrants | Kazakhstan | 45.1 /100 | #177 | Average 5.2% |
| Immigrants | Ukraine | 44.9 /100 | #178 | Average 5.2% |
| Spanish | 41.4 /100 | #179 | Average 5.3% |
Demographics Similar to Swiss by Married-Couple Family Poverty
In terms of married-couple family poverty, the demographic groups most similar to Swiss are Immigrants from Japan (4.3%, a difference of 0.38%), Serbian (4.3%, a difference of 0.39%), British (4.3%, a difference of 0.42%), Scottish (4.3%, a difference of 0.44%), and Immigrants from South Central Asia (4.3%, a difference of 0.54%).
| Demographics | Rating | Rank | Married-Couple Family Poverty |
| English | 99.9 /100 | #36 | Exceptional 4.2% |
| Iranians | 99.9 /100 | #37 | Exceptional 4.2% |
| Belgians | 99.9 /100 | #38 | Exceptional 4.2% |
| Immigrants | Northern Europe | 99.8 /100 | #39 | Exceptional 4.2% |
| French Canadians | 99.8 /100 | #40 | Exceptional 4.2% |
| Northern Europeans | 99.8 /100 | #41 | Exceptional 4.3% |
| Scottish | 99.8 /100 | #42 | Exceptional 4.3% |
| Swiss | 99.8 /100 | #43 | Exceptional 4.3% |
| Immigrants | Japan | 99.8 /100 | #44 | Exceptional 4.3% |
| Serbians | 99.8 /100 | #45 | Exceptional 4.3% |
| British | 99.8 /100 | #46 | Exceptional 4.3% |
| Immigrants | South Central Asia | 99.8 /100 | #47 | Exceptional 4.3% |
| Australians | 99.7 /100 | #48 | Exceptional 4.3% |
| Turks | 99.7 /100 | #49 | Exceptional 4.3% |
| Burmese | 99.7 /100 | #50 | Exceptional 4.3% |