Immigrants from Nepal vs Immigrants from Trinidad and Tobago Married-Couple Family Poverty
COMPARE
Immigrants from Nepal
Immigrants from Trinidad and Tobago
Married-Couple Family Poverty
Married-Couple Family Poverty Comparison
Immigrants from Nepal
Immigrants from Trinidad and Tobago
4.7%
MARRIED-COUPLE FAMILY POVERTY
95.9/ 100
METRIC RATING
113th/ 347
METRIC RANK
6.4%
MARRIED-COUPLE FAMILY POVERTY
0.1/ 100
METRIC RATING
278th/ 347
METRIC RANK
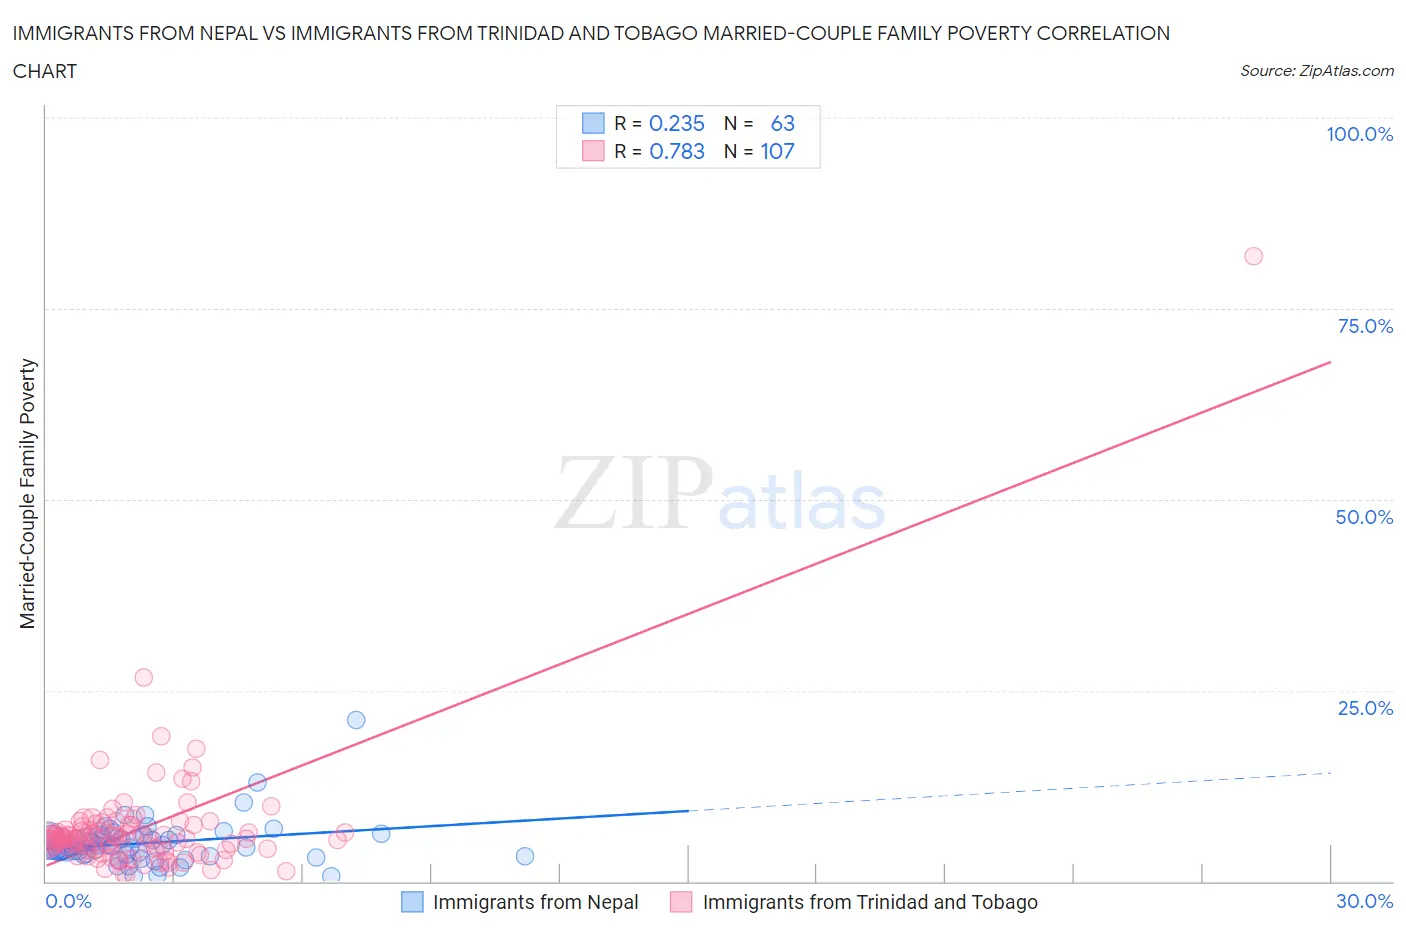
Immigrants from Nepal vs Immigrants from Trinidad and Tobago Married-Couple Family Poverty Correlation Chart
The statistical analysis conducted on geographies consisting of 185,979,517 people shows a weak positive correlation between the proportion of Immigrants from Nepal and poverty level among married-couple families in the United States with a correlation coefficient (R) of 0.235 and weighted average of 4.7%. Similarly, the statistical analysis conducted on geographies consisting of 222,433,461 people shows a strong positive correlation between the proportion of Immigrants from Trinidad and Tobago and poverty level among married-couple families in the United States with a correlation coefficient (R) of 0.783 and weighted average of 6.4%, a difference of 34.1%.
Married-Couple Family Poverty Correlation Summary
| Measurement | Immigrants from Nepal | Immigrants from Trinidad and Tobago |
| Minimum | 0.67% | 0.88% |
| Maximum | 21.1% | 81.8% |
| Range | 20.5% | 80.9% |
| Mean | 5.0% | 6.9% |
| Median | 4.6% | 5.6% |
| Interquartile 25% (IQ1) | 3.4% | 4.1% |
| Interquartile 75% (IQ3) | 5.9% | 7.4% |
| Interquartile Range (IQR) | 2.5% | 3.2% |
| Standard Deviation (Sample) | 3.0% | 8.2% |
| Standard Deviation (Population) | 3.0% | 8.2% |
Similar Demographics by Married-Couple Family Poverty
Demographics Similar to Immigrants from Nepal by Married-Couple Family Poverty
In terms of married-couple family poverty, the demographic groups most similar to Immigrants from Nepal are Tongan (4.7%, a difference of 0.070%), Pakistani (4.7%, a difference of 0.25%), Immigrants from Bolivia (4.7%, a difference of 0.29%), Immigrants from Hong Kong (4.7%, a difference of 0.45%), and Immigrants from Indonesia (4.8%, a difference of 0.58%).
| Demographics | Rating | Rank | Married-Couple Family Poverty |
| Immigrants | France | 96.9 /100 | #106 | Exceptional 4.7% |
| Immigrants | Germany | 96.8 /100 | #107 | Exceptional 4.7% |
| Laotians | 96.6 /100 | #108 | Exceptional 4.7% |
| Immigrants | Hong Kong | 96.4 /100 | #109 | Exceptional 4.7% |
| Immigrants | Bolivia | 96.2 /100 | #110 | Exceptional 4.7% |
| Pakistanis | 96.2 /100 | #111 | Exceptional 4.7% |
| Tongans | 95.9 /100 | #112 | Exceptional 4.7% |
| Immigrants | Nepal | 95.9 /100 | #113 | Exceptional 4.7% |
| Immigrants | Indonesia | 95.1 /100 | #114 | Exceptional 4.8% |
| Taiwanese | 94.8 /100 | #115 | Exceptional 4.8% |
| Celtics | 94.8 /100 | #116 | Exceptional 4.8% |
| Kenyans | 94.7 /100 | #117 | Exceptional 4.8% |
| Immigrants | Philippines | 94.6 /100 | #118 | Exceptional 4.8% |
| Immigrants | Eastern Asia | 94.0 /100 | #119 | Exceptional 4.8% |
| Immigrants | Southern Europe | 93.4 /100 | #120 | Exceptional 4.8% |
Demographics Similar to Immigrants from Trinidad and Tobago by Married-Couple Family Poverty
In terms of married-couple family poverty, the demographic groups most similar to Immigrants from Trinidad and Tobago are Houma (6.4%, a difference of 0.25%), West Indian (6.4%, a difference of 0.29%), Indonesian (6.3%, a difference of 0.48%), Yaqui (6.3%, a difference of 0.62%), and Mexican American Indian (6.4%, a difference of 0.80%).
| Demographics | Rating | Rank | Married-Couple Family Poverty |
| Immigrants | Bahamas | 0.1 /100 | #271 | Tragic 6.2% |
| Trinidadians and Tobagonians | 0.1 /100 | #272 | Tragic 6.2% |
| Colville | 0.1 /100 | #273 | Tragic 6.3% |
| Barbadians | 0.1 /100 | #274 | Tragic 6.3% |
| Choctaw | 0.1 /100 | #275 | Tragic 6.3% |
| Yaqui | 0.1 /100 | #276 | Tragic 6.3% |
| Indonesians | 0.1 /100 | #277 | Tragic 6.3% |
| Immigrants | Trinidad and Tobago | 0.1 /100 | #278 | Tragic 6.4% |
| Houma | 0.0 /100 | #279 | Tragic 6.4% |
| West Indians | 0.0 /100 | #280 | Tragic 6.4% |
| Mexican American Indians | 0.0 /100 | #281 | Tragic 6.4% |
| Seminole | 0.0 /100 | #282 | Tragic 6.4% |
| Ute | 0.0 /100 | #283 | Tragic 6.4% |
| Dutch West Indians | 0.0 /100 | #284 | Tragic 6.4% |
| Blacks/African Americans | 0.0 /100 | #285 | Tragic 6.5% |