Immigrants from Nepal GED/Equivalency
COMPARE
Immigrants from Nepal
Select to Compare
GED/Equivalency
Immigrants from Nepal GED/Equivalency
86.2%
GED/EQUIVALENCY
73.3/ 100
METRIC RATING
156th/ 347
METRIC RANK
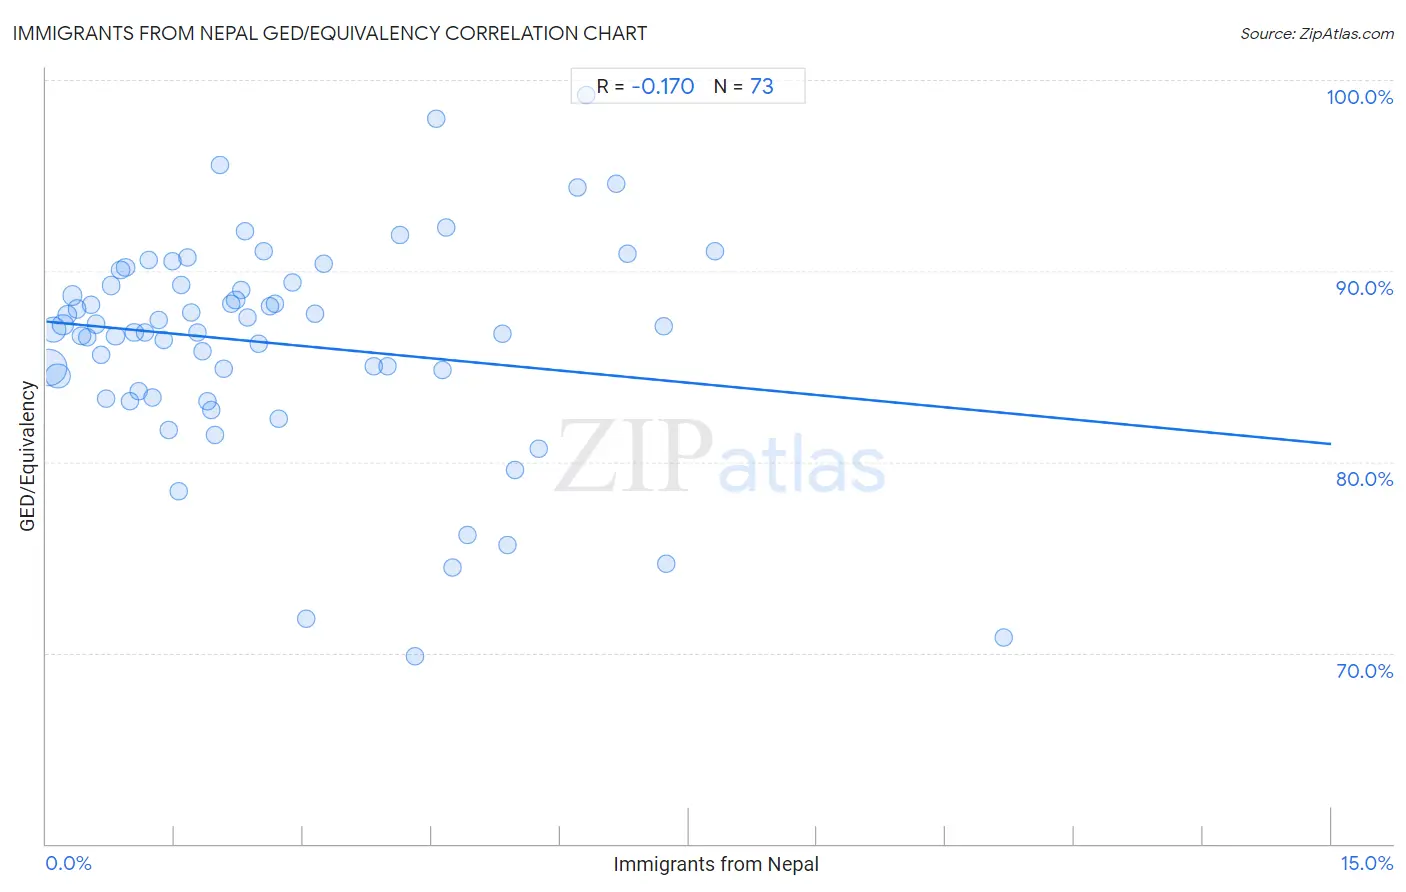
Immigrants from Nepal GED/Equivalency Correlation Chart
The statistical analysis conducted on geographies consisting of 186,780,807 people shows a poor negative correlation between the proportion of Immigrants from Nepal and percentage of population with at least ged/equivalency education in the United States with a correlation coefficient (R) of -0.170 and weighted average of 86.2%. On average, for every 1% (one percent) increase in Immigrants from Nepal within a typical geography, there is a decrease of 0.43% in percentage of population with at least ged/equivalency education.
It is essential to understand that the correlation between the percentage of Immigrants from Nepal and percentage of population with at least ged/equivalency education does not imply a direct cause-and-effect relationship. It remains uncertain whether the presence of Immigrants from Nepal influences an upward or downward trend in the level of percentage of population with at least ged/equivalency education within an area, or if Immigrants from Nepal simply ended up residing in those areas with higher or lower levels of percentage of population with at least ged/equivalency education due to other factors.
Demographics Similar to Immigrants from Nepal by GED/Equivalency
In terms of ged/equivalency, the demographic groups most similar to Immigrants from Nepal are White/Caucasian (86.2%, a difference of 0.030%), German Russian (86.2%, a difference of 0.030%), Immigrants from Kenya (86.2%, a difference of 0.040%), Iraqi (86.2%, a difference of 0.050%), and Armenian (86.3%, a difference of 0.080%).
| Demographics | Rating | Rank | GED/Equivalency |
| Menominee | 79.3 /100 | #149 | Good 86.3% |
| Immigrants from Western Asia | 78.8 /100 | #150 | Good 86.3% |
| Immigrants from Bosnia and Herzegovina | 77.9 /100 | #151 | Good 86.3% |
| Brazilians | 77.2 /100 | #152 | Good 86.3% |
| Kenyans | 76.6 /100 | #153 | Good 86.3% |
| Armenians | 76.4 /100 | #154 | Good 86.3% |
| Iraqis | 75.2 /100 | #155 | Good 86.2% |
| Immigrants from Nepal | 73.3 /100 | #156 | Good 86.2% |
| Whites/Caucasians | 72.2 /100 | #157 | Good 86.2% |
| German Russians | 72.1 /100 | #158 | Good 86.2% |
| Immigrants from Kenya | 71.8 /100 | #159 | Good 86.2% |
| Immigrants from Morocco | 69.5 /100 | #160 | Good 86.1% |
| Immigrants from Syria | 69.3 /100 | #161 | Good 86.1% |
| Immigrants from Iraq | 68.1 /100 | #162 | Good 86.1% |
| Ugandans | 66.3 /100 | #163 | Good 86.1% |
Immigrants from Nepal GED/Equivalency Correlation Summary
| Measurement | Immigrants from Nepal Data | GED/Equivalency Data |
| Minimum | 0.026% | 69.8% |
| Maximum | 11.2% | 99.2% |
| Range | 11.2% | 29.4% |
| Mean | 2.7% | 86.2% |
| Median | 2.0% | 86.9% |
| Interquartile 25% (IQ1) | 1.0% | 83.5% |
| Interquartile 75% (IQ3) | 4.2% | 89.3% |
| Interquartile Range (IQR) | 3.2% | 5.8% |
| Standard Deviation (Sample) | 2.3% | 5.7% |
| Standard Deviation (Population) | 2.3% | 5.7% |
Correlation Details
| Immigrants from Nepal Percentile | Sample Size | GED/Equivalency |
[ 0.0% - 0.5% ] 0.026% | 77,665,403 | 85.0% |
[ 0.0% - 0.5% ] 0.080% | 34,303,441 | 86.9% |
[ 0.0% - 0.5% ] 0.14% | 28,162,804 | 84.5% |
[ 0.0% - 0.5% ] 0.19% | 12,252,130 | 87.2% |
[ 0.0% - 0.5% ] 0.25% | 6,932,958 | 87.7% |
[ 0.0% - 0.5% ] 0.30% | 6,081,773 | 88.7% |
[ 0.0% - 0.5% ] 0.36% | 3,895,695 | 88.0% |
[ 0.0% - 0.5% ] 0.41% | 3,335,429 | 86.6% |
[ 0.0% - 0.5% ] 0.48% | 1,886,016 | 86.5% |
[ 0.5% - 1.0% ] 0.52% | 1,622,167 | 88.2% |
[ 0.5% - 1.0% ] 0.58% | 1,494,963 | 87.2% |
[ 0.5% - 1.0% ] 0.64% | 1,133,316 | 85.6% |
[ 0.5% - 1.0% ] 0.70% | 1,042,582 | 83.3% |
[ 0.5% - 1.0% ] 0.75% | 979,898 | 89.2% |
[ 0.5% - 1.0% ] 0.81% | 810,202 | 86.6% |
[ 0.5% - 1.0% ] 0.87% | 246,936 | 90.0% |
[ 0.5% - 1.0% ] 0.93% | 375,683 | 90.2% |
[ 0.5% - 1.0% ] 0.98% | 448,162 | 83.2% |
[ 1.0% - 1.5% ] 1.03% | 413,124 | 86.8% |
[ 1.0% - 1.5% ] 1.08% | 622,579 | 83.7% |
[ 1.0% - 1.5% ] 1.15% | 333,013 | 86.8% |
[ 1.0% - 1.5% ] 1.20% | 205,917 | 90.6% |
[ 1.0% - 1.5% ] 1.24% | 169,187 | 83.4% |
[ 1.0% - 1.5% ] 1.32% | 190,462 | 87.4% |
[ 1.0% - 1.5% ] 1.37% | 142,920 | 86.4% |
[ 1.0% - 1.5% ] 1.42% | 69,948 | 81.7% |
[ 1.0% - 1.5% ] 1.48% | 28,227 | 90.5% |
[ 1.5% - 2.0% ] 1.54% | 80,206 | 78.5% |
[ 1.5% - 2.0% ] 1.58% | 46,945 | 89.3% |
[ 1.5% - 2.0% ] 1.65% | 178,897 | 90.7% |
[ 1.5% - 2.0% ] 1.70% | 100,652 | 87.8% |
[ 1.5% - 2.0% ] 1.76% | 107,656 | 86.8% |
[ 1.5% - 2.0% ] 1.83% | 21,021 | 85.8% |
[ 1.5% - 2.0% ] 1.88% | 99,942 | 83.2% |
[ 1.5% - 2.0% ] 1.93% | 24,975 | 82.7% |
[ 1.5% - 2.0% ] 1.96% | 358,784 | 81.4% |
[ 2.0% - 2.5% ] 2.04% | 4,471 | 95.6% |
[ 2.0% - 2.5% ] 2.07% | 241 | 84.9% |
[ 2.0% - 2.5% ] 2.16% | 54,548 | 88.3% |
[ 2.0% - 2.5% ] 2.21% | 109,029 | 88.5% |
[ 2.0% - 2.5% ] 2.28% | 26,531 | 89.0% |
[ 2.0% - 2.5% ] 2.32% | 28,055 | 92.1% |
[ 2.0% - 2.5% ] 2.35% | 43,568 | 87.5% |
[ 2.0% - 2.5% ] 2.48% | 14,052 | 86.2% |
[ 2.5% - 3.0% ] 2.54% | 55,349 | 91.0% |
[ 2.5% - 3.0% ] 2.61% | 8,194 | 88.1% |
[ 2.5% - 3.0% ] 2.66% | 54,628 | 88.3% |
[ 2.5% - 3.0% ] 2.72% | 112,629 | 82.2% |
[ 2.5% - 3.0% ] 2.87% | 17,107 | 89.4% |
[ 3.0% - 3.5% ] 3.04% | 117,137 | 71.8% |
[ 3.0% - 3.5% ] 3.13% | 38,632 | 87.8% |
[ 3.0% - 3.5% ] 3.24% | 11,364 | 90.4% |
[ 3.5% - 4.0% ] 3.82% | 32,951 | 85.0% |
[ 3.5% - 4.0% ] 3.98% | 1,458 | 85.0% |
[ 4.0% - 4.5% ] 4.13% | 20,720 | 91.9% |
[ 4.0% - 4.5% ] 4.30% | 26,684 | 69.8% |
[ 4.5% - 5.0% ] 4.55% | 3,582 | 98.0% |
[ 4.5% - 5.0% ] 4.62% | 6,861 | 84.8% |
[ 4.5% - 5.0% ] 4.67% | 31,963 | 92.3% |
[ 4.5% - 5.0% ] 4.75% | 14,553 | 74.5% |
[ 4.5% - 5.0% ] 4.92% | 2,945 | 76.2% |
[ 5.0% - 5.5% ] 5.32% | 1,936 | 86.7% |
[ 5.0% - 5.5% ] 5.39% | 946 | 75.6% |
[ 5.0% - 5.5% ] 5.48% | 1,132 | 79.6% |
[ 5.5% - 6.0% ] 5.75% | 6,571 | 80.7% |
[ 6.0% - 6.5% ] 6.19% | 339 | 94.4% |
[ 6.0% - 6.5% ] 6.30% | 3,190 | 99.2% |
[ 6.5% - 7.0% ] 6.65% | 4,899 | 94.6% |
[ 6.5% - 7.0% ] 6.78% | 1,651 | 90.9% |
[ 7.0% - 7.5% ] 7.21% | 971 | 87.1% |
[ 7.0% - 7.5% ] 7.24% | 24,892 | 74.6% |
[ 7.5% - 8.0% ] 7.81% | 32,559 | 91.0% |
[ 11.0% - 11.5% ] 11.18% | 456 | 70.8% |