Immigrants from Italy vs Inupiat Married-Couple Family Poverty
COMPARE
Immigrants from Italy
Inupiat
Married-Couple Family Poverty
Married-Couple Family Poverty Comparison
Immigrants from Italy
Inupiat
4.6%
MARRIED-COUPLE FAMILY POVERTY
98.3/ 100
METRIC RATING
94th/ 347
METRIC RANK
7.1%
MARRIED-COUPLE FAMILY POVERTY
0.0/ 100
METRIC RATING
315th/ 347
METRIC RANK
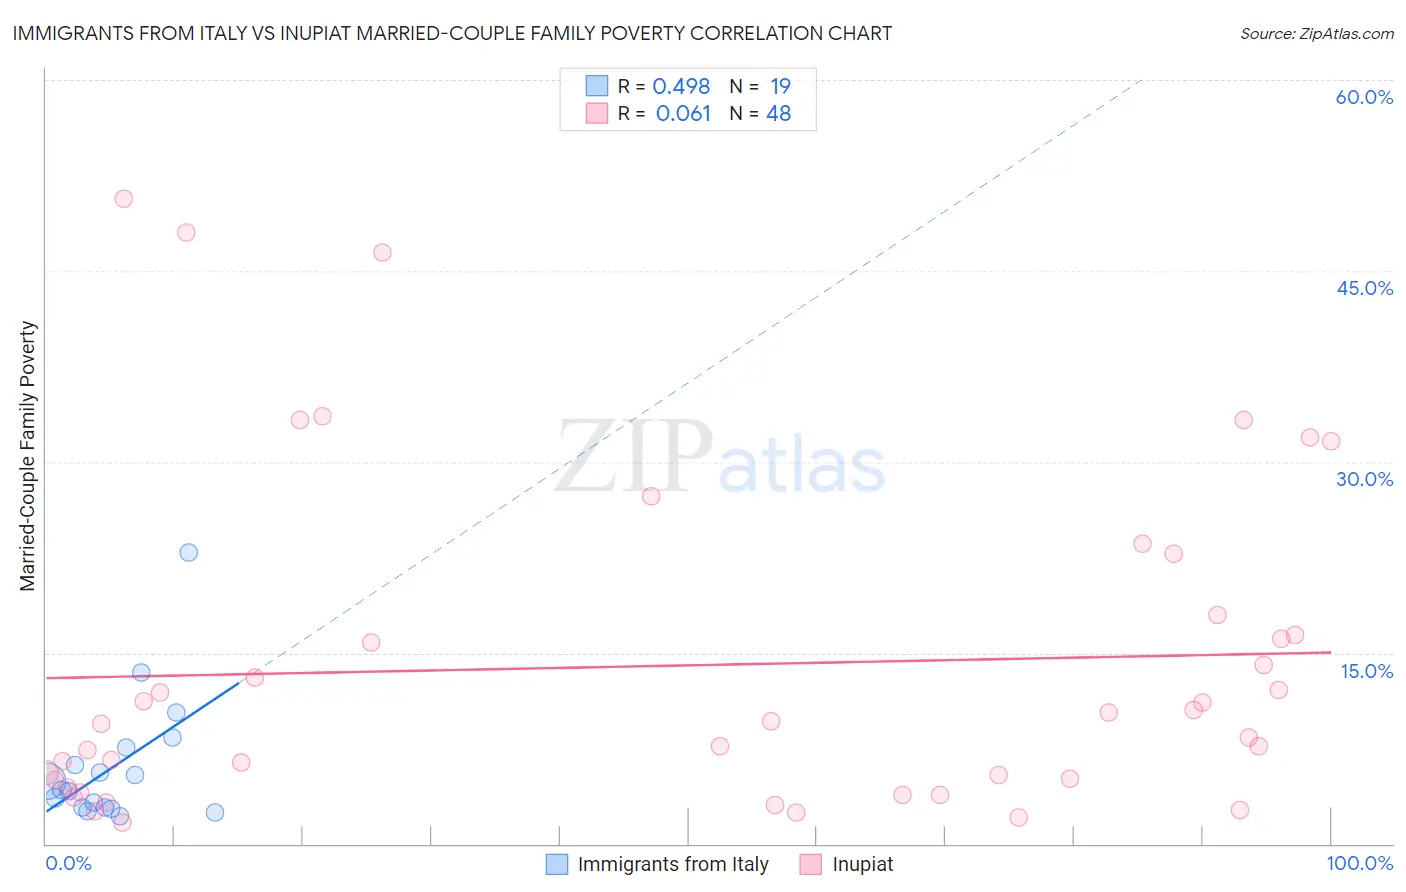
Immigrants from Italy vs Inupiat Married-Couple Family Poverty Correlation Chart
The statistical analysis conducted on geographies consisting of 321,486,465 people shows a moderate positive correlation between the proportion of Immigrants from Italy and poverty level among married-couple families in the United States with a correlation coefficient (R) of 0.498 and weighted average of 4.6%. Similarly, the statistical analysis conducted on geographies consisting of 96,004,773 people shows a slight positive correlation between the proportion of Inupiat and poverty level among married-couple families in the United States with a correlation coefficient (R) of 0.061 and weighted average of 7.1%, a difference of 55.2%.
Married-Couple Family Poverty Correlation Summary
| Measurement | Immigrants from Italy | Inupiat |
| Minimum | 2.2% | 1.6% |
| Maximum | 22.9% | 50.7% |
| Range | 20.7% | 49.0% |
| Mean | 6.1% | 14.0% |
| Median | 4.2% | 9.6% |
| Interquartile 25% (IQ1) | 2.8% | 4.7% |
| Interquartile 75% (IQ3) | 7.6% | 17.2% |
| Interquartile Range (IQR) | 4.7% | 12.5% |
| Standard Deviation (Sample) | 5.0% | 12.9% |
| Standard Deviation (Population) | 4.9% | 12.8% |
Similar Demographics by Married-Couple Family Poverty
Demographics Similar to Immigrants from Italy by Married-Couple Family Poverty
In terms of married-couple family poverty, the demographic groups most similar to Immigrants from Italy are Portuguese (4.6%, a difference of 0.040%), Korean (4.6%, a difference of 0.050%), Immigrants from Poland (4.6%, a difference of 0.12%), Immigrants from Belgium (4.6%, a difference of 0.17%), and Immigrants from Norway (4.6%, a difference of 0.23%).
| Demographics | Rating | Rank | Married-Couple Family Poverty |
| Immigrants | North Macedonia | 98.6 /100 | #87 | Exceptional 4.6% |
| Bolivians | 98.6 /100 | #88 | Exceptional 4.6% |
| Immigrants | Czechoslovakia | 98.5 /100 | #89 | Exceptional 4.6% |
| Immigrants | Switzerland | 98.5 /100 | #90 | Exceptional 4.6% |
| Basques | 98.5 /100 | #91 | Exceptional 4.6% |
| Immigrants | Norway | 98.4 /100 | #92 | Exceptional 4.6% |
| Koreans | 98.3 /100 | #93 | Exceptional 4.6% |
| Immigrants | Italy | 98.3 /100 | #94 | Exceptional 4.6% |
| Portuguese | 98.3 /100 | #95 | Exceptional 4.6% |
| Immigrants | Poland | 98.3 /100 | #96 | Exceptional 4.6% |
| Immigrants | Belgium | 98.2 /100 | #97 | Exceptional 4.6% |
| Native Hawaiians | 98.0 /100 | #98 | Exceptional 4.6% |
| Immigrants | Europe | 97.9 /100 | #99 | Exceptional 4.6% |
| Immigrants | Western Europe | 97.9 /100 | #100 | Exceptional 4.6% |
| Yugoslavians | 97.8 /100 | #101 | Exceptional 4.6% |
Demographics Similar to Inupiat by Married-Couple Family Poverty
In terms of married-couple family poverty, the demographic groups most similar to Inupiat are Honduran (7.2%, a difference of 0.15%), British West Indian (7.1%, a difference of 0.24%), Mexican (7.2%, a difference of 0.47%), Immigrants from St. Vincent and the Grenadines (7.1%, a difference of 0.54%), and Immigrants from Guatemala (7.2%, a difference of 0.63%).
| Demographics | Rating | Rank | Married-Couple Family Poverty |
| Spanish American Indians | 0.0 /100 | #308 | Tragic 7.1% |
| Hopi | 0.0 /100 | #309 | Tragic 7.1% |
| Immigrants | Nicaragua | 0.0 /100 | #310 | Tragic 7.1% |
| Immigrants | Dominica | 0.0 /100 | #311 | Tragic 7.1% |
| Immigrants | Armenia | 0.0 /100 | #312 | Tragic 7.1% |
| Immigrants | St. Vincent and the Grenadines | 0.0 /100 | #313 | Tragic 7.1% |
| British West Indians | 0.0 /100 | #314 | Tragic 7.1% |
| Inupiat | 0.0 /100 | #315 | Tragic 7.1% |
| Hondurans | 0.0 /100 | #316 | Tragic 7.2% |
| Mexicans | 0.0 /100 | #317 | Tragic 7.2% |
| Immigrants | Guatemala | 0.0 /100 | #318 | Tragic 7.2% |
| Immigrants | Latin America | 0.0 /100 | #319 | Tragic 7.2% |
| Immigrants | Grenada | 0.0 /100 | #320 | Tragic 7.3% |
| Immigrants | Caribbean | 0.0 /100 | #321 | Tragic 7.3% |
| Immigrants | Honduras | 0.0 /100 | #322 | Tragic 7.3% |