Immigrants from Italy 2 or more Vehicles in Household
COMPARE
Immigrants from Italy
Select to Compare
2 or more Vehicles in Household
Immigrants from Italy 2 or more Vehicles in Household
54.4%
2+ VEHICLES AVAILABLE
15.5/ 100
METRIC RATING
201st/ 347
METRIC RANK
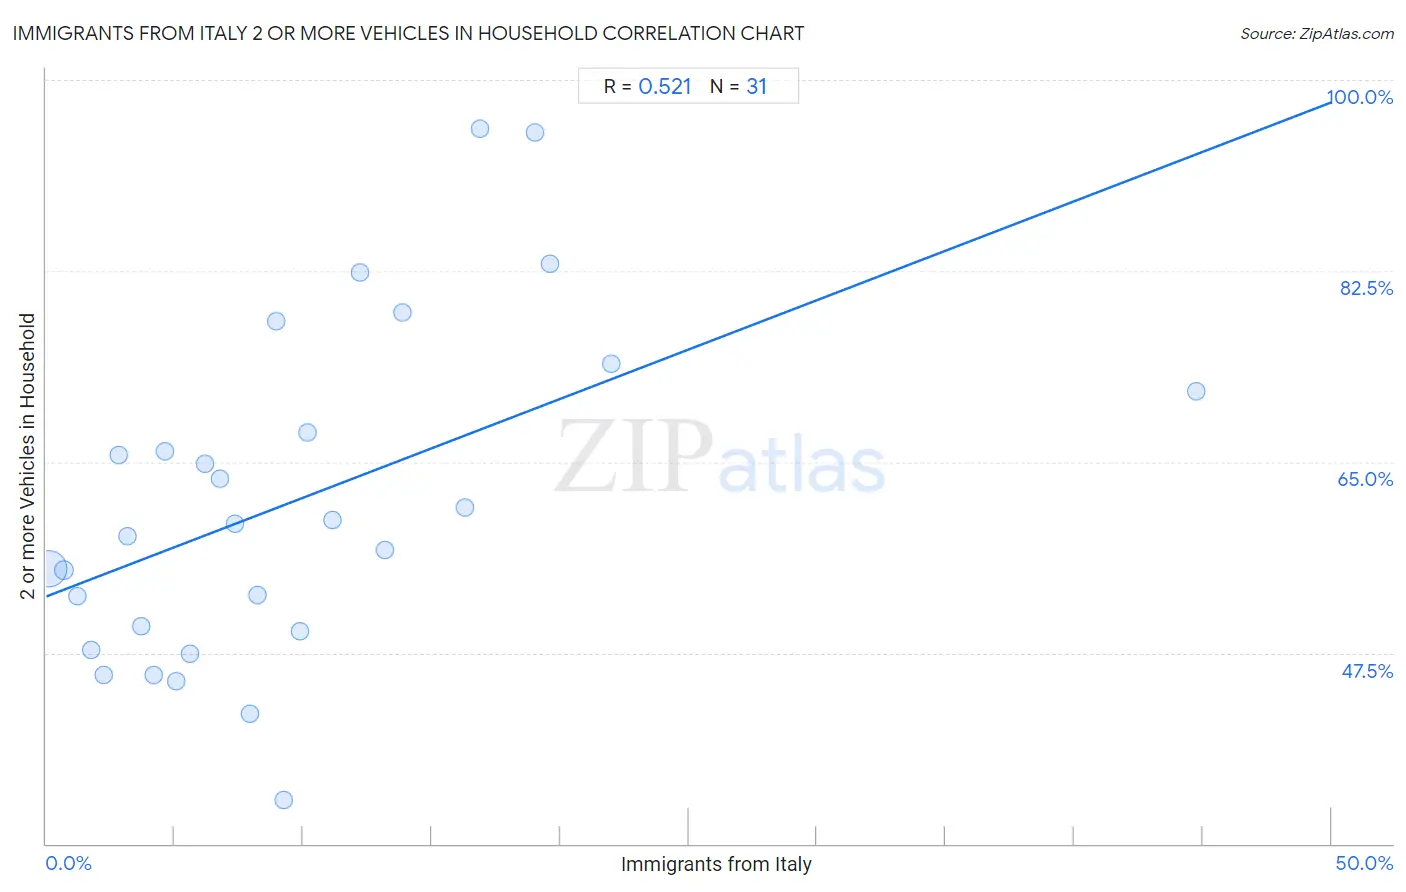
Immigrants from Italy 2 or more Vehicles in Household Correlation Chart
The statistical analysis conducted on geographies consisting of 324,160,818 people shows a substantial positive correlation between the proportion of Immigrants from Italy and percentage of households with 2 or more vehicles available in the United States with a correlation coefficient (R) of 0.521 and weighted average of 54.4%. On average, for every 1% (one percent) increase in Immigrants from Italy within a typical geography, there is an increase of 0.91% in percentage of households with 2 or more vehicles available.
It is essential to understand that the correlation between the percentage of Immigrants from Italy and percentage of households with 2 or more vehicles available does not imply a direct cause-and-effect relationship. It remains uncertain whether the presence of Immigrants from Italy influences an upward or downward trend in the level of percentage of households with 2 or more vehicles available within an area, or if Immigrants from Italy simply ended up residing in those areas with higher or lower levels of percentage of households with 2 or more vehicles available due to other factors.
Demographics Similar to Immigrants from Italy by 2 or more Vehicles in Household
In terms of 2 or more vehicles in household, the demographic groups most similar to Immigrants from Italy are Immigrants from Norway (54.4%, a difference of 0.030%), Houma (54.4%, a difference of 0.030%), Immigrants from North Macedonia (54.4%, a difference of 0.050%), Carpatho Rusyn (54.4%, a difference of 0.060%), and Immigrants from Peru (54.4%, a difference of 0.090%).
| Demographics | Rating | Rank | 2 or more Vehicles in Household |
| Central Americans | 23.0 /100 | #194 | Fair 54.7% |
| Iroquois | 22.6 /100 | #195 | Fair 54.7% |
| Immigrants from Poland | 19.3 /100 | #196 | Poor 54.6% |
| Argentineans | 17.5 /100 | #197 | Poor 54.5% |
| Carpatho Rusyns | 16.2 /100 | #198 | Poor 54.4% |
| Immigrants from Norway | 15.9 /100 | #199 | Poor 54.4% |
| Houma | 15.8 /100 | #200 | Poor 54.4% |
| Immigrants from Italy | 15.5 /100 | #201 | Poor 54.4% |
| Immigrants from North Macedonia | 14.9 /100 | #202 | Poor 54.4% |
| Immigrants from Peru | 14.3 /100 | #203 | Poor 54.4% |
| Immigrants from Belgium | 13.7 /100 | #204 | Poor 54.3% |
| Cheyenne | 13.6 /100 | #205 | Poor 54.3% |
| Immigrants from Latin America | 13.1 /100 | #206 | Poor 54.3% |
| Turks | 13.0 /100 | #207 | Poor 54.3% |
| Egyptians | 12.0 /100 | #208 | Poor 54.3% |
Immigrants from Italy 2 or more Vehicles in Household Correlation Summary
| Measurement | Immigrants from Italy Data | 2 or more Vehicles in Household Data |
| Minimum | 0.12% | 34.1% |
| Maximum | 44.7% | 95.6% |
| Range | 44.6% | 61.5% |
| Mean | 9.6% | 61.4% |
| Median | 7.9% | 59.4% |
| Interquartile 25% (IQ1) | 3.7% | 49.4% |
| Interquartile 75% (IQ3) | 13.2% | 71.4% |
| Interquartile Range (IQR) | 9.5% | 22.0% |
| Standard Deviation (Sample) | 8.8% | 15.3% |
| Standard Deviation (Population) | 8.6% | 15.0% |
Correlation Details
| Immigrants from Italy Percentile | Sample Size | 2 or more Vehicles in Household |
[ 0.0% - 0.5% ] 0.12% | 302,744,772 | 55.2% |
[ 0.5% - 1.0% ] 0.68% | 15,221,805 | 55.1% |
[ 1.0% - 1.5% ] 1.21% | 3,538,387 | 52.6% |
[ 1.5% - 2.0% ] 1.76% | 1,204,498 | 47.8% |
[ 2.0% - 2.5% ] 2.23% | 814,965 | 45.5% |
[ 2.5% - 3.0% ] 2.84% | 132,910 | 65.6% |
[ 3.0% - 3.5% ] 3.18% | 208,125 | 58.2% |
[ 3.5% - 4.0% ] 3.69% | 84,013 | 49.9% |
[ 4.0% - 4.5% ] 4.20% | 130,511 | 45.5% |
[ 4.5% - 5.0% ] 4.61% | 19,537 | 65.9% |
[ 5.0% - 5.5% ] 5.07% | 34,820 | 44.9% |
[ 5.5% - 6.0% ] 5.61% | 2,959 | 47.4% |
[ 6.0% - 6.5% ] 6.18% | 4,614 | 64.8% |
[ 6.5% - 7.0% ] 6.77% | 3,768 | 63.4% |
[ 7.0% - 7.5% ] 7.37% | 3,149 | 59.4% |
[ 7.5% - 8.0% ] 7.91% | 1,910 | 41.9% |
[ 8.0% - 8.5% ] 8.24% | 825 | 52.8% |
[ 8.5% - 9.0% ] 8.93% | 1,164 | 77.9% |
[ 9.0% - 9.5% ] 9.23% | 260 | 34.1% |
[ 9.5% - 10.0% ] 9.89% | 1,294 | 49.4% |
[ 10.0% - 10.5% ] 10.17% | 1,072 | 67.7% |
[ 11.0% - 11.5% ] 11.16% | 233 | 59.7% |
[ 12.0% - 12.5% ] 12.20% | 41 | 82.4% |
[ 13.0% - 13.5% ] 13.18% | 2,998 | 56.9% |
[ 13.5% - 14.0% ] 13.84% | 289 | 78.7% |
[ 16.0% - 16.5% ] 16.30% | 92 | 60.8% |
[ 16.5% - 17.0% ] 16.88% | 160 | 95.6% |
[ 19.0% - 19.5% ] 19.01% | 142 | 95.2% |
[ 19.5% - 20.0% ] 19.58% | 1,144 | 83.2% |
[ 21.5% - 22.0% ] 21.98% | 323 | 73.9% |
[ 44.5% - 45.0% ] 44.74% | 38 | 71.4% |