Immigrants from Greece Self-Care Disability
COMPARE
Immigrants from Greece
Select to Compare
Self-Care Disability
Immigrants from Greece Self-Care Disability
2.5%
SELF-CARE DISABILITY
57.3/ 100
METRIC RATING
167th/ 347
METRIC RANK
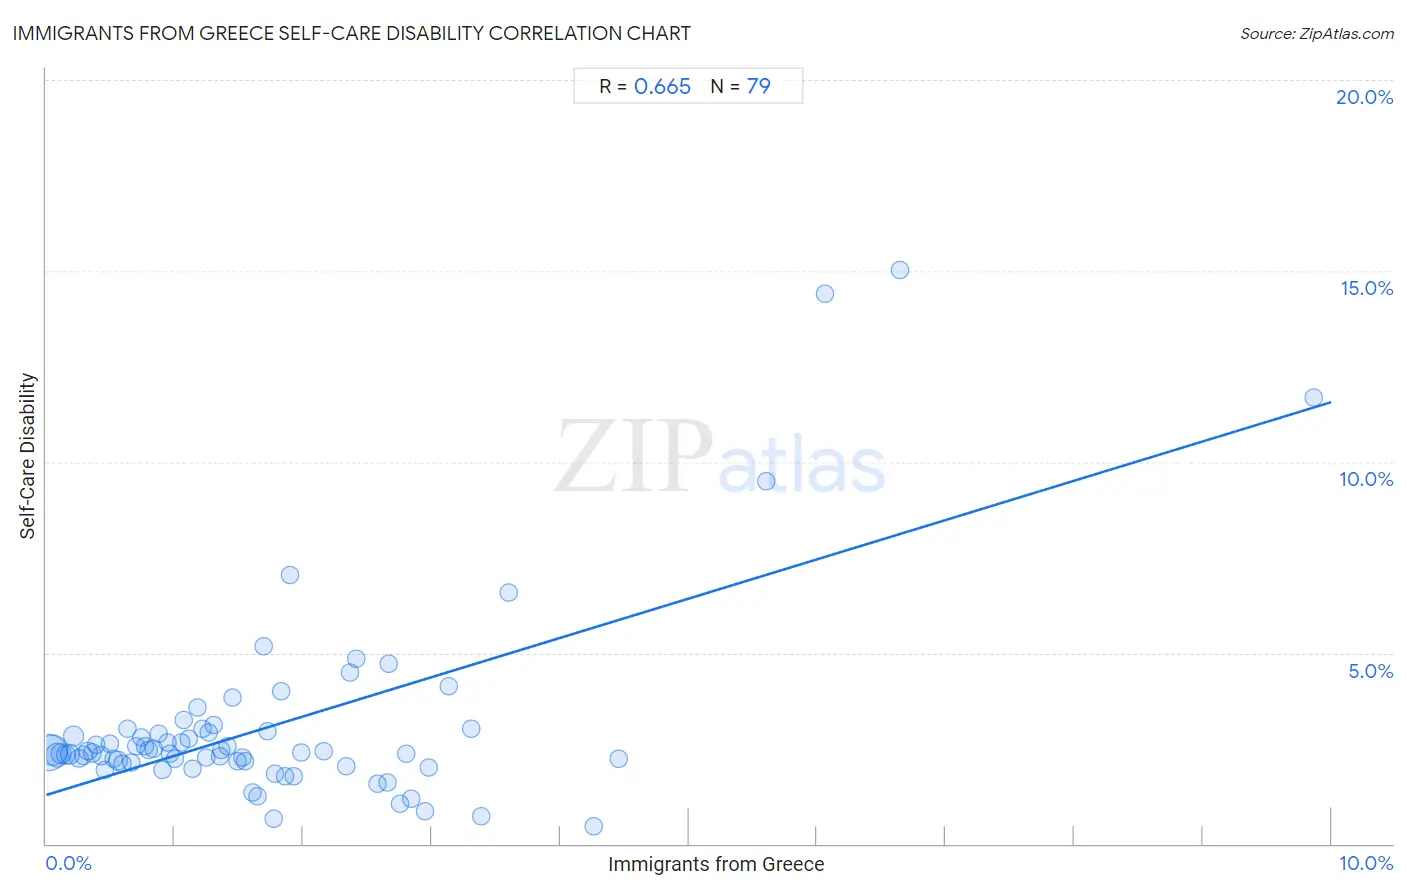
Immigrants from Greece Self-Care Disability Correlation Chart
The statistical analysis conducted on geographies consisting of 216,801,636 people shows a significant positive correlation between the proportion of Immigrants from Greece and percentage of population with self-care disability in the United States with a correlation coefficient (R) of 0.665 and weighted average of 2.5%. On average, for every 1% (one percent) increase in Immigrants from Greece within a typical geography, there is an increase of 1.0% in percentage of population with self-care disability.
It is essential to understand that the correlation between the percentage of Immigrants from Greece and percentage of population with self-care disability does not imply a direct cause-and-effect relationship. It remains uncertain whether the presence of Immigrants from Greece influences an upward or downward trend in the level of percentage of population with self-care disability within an area, or if Immigrants from Greece simply ended up residing in those areas with higher or lower levels of percentage of population with self-care disability due to other factors.
Demographics Similar to Immigrants from Greece by Self-Care Disability
In terms of self-care disability, the demographic groups most similar to Immigrants from Greece are Ute (2.5%, a difference of 0.010%), Canadian (2.5%, a difference of 0.070%), Immigrants from Somalia (2.5%, a difference of 0.070%), Syrian (2.5%, a difference of 0.080%), and Immigrants from Vietnam (2.5%, a difference of 0.10%).
| Demographics | Rating | Rank | Self-Care Disability |
| Finns | 67.0 /100 | #160 | Good 2.4% |
| Lebanese | 66.5 /100 | #161 | Good 2.4% |
| Somalis | 63.7 /100 | #162 | Good 2.5% |
| German Russians | 62.7 /100 | #163 | Good 2.5% |
| Immigrants from Vietnam | 59.3 /100 | #164 | Average 2.5% |
| Syrians | 59.0 /100 | #165 | Average 2.5% |
| Canadians | 58.8 /100 | #166 | Average 2.5% |
| Immigrants from Greece | 57.3 /100 | #167 | Average 2.5% |
| Ute | 57.1 /100 | #168 | Average 2.5% |
| Immigrants from Somalia | 55.9 /100 | #169 | Average 2.5% |
| Scottish | 54.3 /100 | #170 | Average 2.5% |
| Pennsylvania Germans | 53.5 /100 | #171 | Average 2.5% |
| Czechoslovakians | 53.5 /100 | #172 | Average 2.5% |
| Immigrants from Burma/Myanmar | 52.8 /100 | #173 | Average 2.5% |
| Welsh | 50.0 /100 | #174 | Average 2.5% |
Immigrants from Greece Self-Care Disability Correlation Summary
| Measurement | Immigrants from Greece Data | Self-Care Disability Data |
| Minimum | 0.018% | 0.45% |
| Maximum | 9.9% | 15.0% |
| Range | 9.8% | 14.6% |
| Mean | 1.7% | 3.1% |
| Median | 1.4% | 2.4% |
| Interquartile 25% (IQ1) | 0.66% | 2.1% |
| Interquartile 75% (IQ3) | 2.4% | 2.9% |
| Interquartile Range (IQR) | 1.7% | 0.81% |
| Standard Deviation (Sample) | 1.6% | 2.5% |
| Standard Deviation (Population) | 1.6% | 2.5% |
Correlation Details
| Immigrants from Greece Percentile | Sample Size | Self-Care Disability |
[ 0.0% - 0.5% ] 0.018% | 81,497,248 | 2.4% |
[ 0.0% - 0.5% ] 0.048% | 52,838,212 | 2.4% |
[ 0.0% - 0.5% ] 0.085% | 25,620,942 | 2.3% |
[ 0.0% - 0.5% ] 0.12% | 12,020,819 | 2.4% |
[ 0.0% - 0.5% ] 0.15% | 7,916,765 | 2.3% |
[ 0.0% - 0.5% ] 0.19% | 6,189,024 | 2.3% |
[ 0.0% - 0.5% ] 0.22% | 12,543,961 | 2.8% |
[ 0.0% - 0.5% ] 0.25% | 3,495,627 | 2.2% |
[ 0.0% - 0.5% ] 0.29% | 2,764,173 | 2.3% |
[ 0.0% - 0.5% ] 0.33% | 1,510,684 | 2.4% |
[ 0.0% - 0.5% ] 0.36% | 1,270,441 | 2.4% |
[ 0.0% - 0.5% ] 0.39% | 1,500,038 | 2.6% |
[ 0.0% - 0.5% ] 0.43% | 858,533 | 2.3% |
[ 0.0% - 0.5% ] 0.46% | 768,481 | 1.9% |
[ 0.0% - 0.5% ] 0.50% | 495,756 | 2.6% |
[ 0.5% - 1.0% ] 0.53% | 591,509 | 2.2% |
[ 0.5% - 1.0% ] 0.56% | 580,890 | 2.2% |
[ 0.5% - 1.0% ] 0.59% | 395,445 | 2.1% |
[ 0.5% - 1.0% ] 0.63% | 260,581 | 3.0% |
[ 0.5% - 1.0% ] 0.66% | 320,172 | 2.1% |
[ 0.5% - 1.0% ] 0.70% | 416,246 | 2.6% |
[ 0.5% - 1.0% ] 0.74% | 436,879 | 2.8% |
[ 0.5% - 1.0% ] 0.77% | 271,969 | 2.6% |
[ 0.5% - 1.0% ] 0.80% | 188,038 | 2.4% |
[ 0.5% - 1.0% ] 0.84% | 91,076 | 2.5% |
[ 0.5% - 1.0% ] 0.88% | 103,539 | 2.9% |
[ 0.5% - 1.0% ] 0.91% | 340,646 | 1.9% |
[ 0.5% - 1.0% ] 0.94% | 132,714 | 2.7% |
[ 0.5% - 1.0% ] 0.96% | 80,297 | 2.4% |
[ 1.0% - 1.5% ] 1.00% | 81,127 | 2.2% |
[ 1.0% - 1.5% ] 1.05% | 44,604 | 2.6% |
[ 1.0% - 1.5% ] 1.07% | 190,464 | 3.3% |
[ 1.0% - 1.5% ] 1.11% | 73,197 | 2.8% |
[ 1.0% - 1.5% ] 1.14% | 55,003 | 2.0% |
[ 1.0% - 1.5% ] 1.18% | 36,579 | 3.6% |
[ 1.0% - 1.5% ] 1.22% | 15,324 | 3.0% |
[ 1.0% - 1.5% ] 1.25% | 147,609 | 2.3% |
[ 1.0% - 1.5% ] 1.26% | 19,934 | 2.9% |
[ 1.0% - 1.5% ] 1.31% | 23,333 | 3.1% |
[ 1.0% - 1.5% ] 1.35% | 29,920 | 2.3% |
[ 1.0% - 1.5% ] 1.36% | 5,131 | 2.4% |
[ 1.0% - 1.5% ] 1.41% | 62,329 | 2.6% |
[ 1.0% - 1.5% ] 1.45% | 12,672 | 3.8% |
[ 1.0% - 1.5% ] 1.49% | 43,367 | 2.2% |
[ 1.5% - 2.0% ] 1.53% | 35,356 | 2.3% |
[ 1.5% - 2.0% ] 1.55% | 32,400 | 2.2% |
[ 1.5% - 2.0% ] 1.61% | 1,057 | 1.3% |
[ 1.5% - 2.0% ] 1.65% | 4,801 | 1.2% |
[ 1.5% - 2.0% ] 1.69% | 8,620 | 5.2% |
[ 1.5% - 2.0% ] 1.72% | 57,708 | 2.9% |
[ 1.5% - 2.0% ] 1.77% | 5,939 | 0.65% |
[ 1.5% - 2.0% ] 1.78% | 5,100 | 1.8% |
[ 1.5% - 2.0% ] 1.83% | 3,277 | 4.0% |
[ 1.5% - 2.0% ] 1.86% | 10,439 | 1.8% |
[ 1.5% - 2.0% ] 1.89% | 317 | 7.0% |
[ 1.5% - 2.0% ] 1.93% | 4,726 | 1.8% |
[ 1.5% - 2.0% ] 1.99% | 302 | 2.4% |
[ 2.0% - 2.5% ] 2.15% | 45,387 | 2.4% |
[ 2.0% - 2.5% ] 2.34% | 37,647 | 2.0% |
[ 2.0% - 2.5% ] 2.36% | 27,076 | 4.5% |
[ 2.0% - 2.5% ] 2.41% | 27,959 | 4.8% |
[ 2.5% - 3.0% ] 2.57% | 272 | 1.6% |
[ 2.5% - 3.0% ] 2.65% | 34,978 | 1.6% |
[ 2.5% - 3.0% ] 2.66% | 19,719 | 4.7% |
[ 2.5% - 3.0% ] 2.76% | 8,565 | 1.0% |
[ 2.5% - 3.0% ] 2.80% | 1,642 | 2.4% |
[ 2.5% - 3.0% ] 2.84% | 1,515 | 1.2% |
[ 2.5% - 3.0% ] 2.95% | 2,914 | 0.85% |
[ 2.5% - 3.0% ] 2.98% | 1,880 | 2.0% |
[ 3.0% - 3.5% ] 3.14% | 7,365 | 4.1% |
[ 3.0% - 3.5% ] 3.31% | 28,882 | 3.0% |
[ 3.0% - 3.5% ] 3.39% | 3,128 | 0.72% |
[ 3.5% - 4.0% ] 3.60% | 694 | 6.6% |
[ 4.0% - 4.5% ] 4.26% | 938 | 0.45% |
[ 4.0% - 4.5% ] 4.45% | 38,756 | 2.2% |
[ 5.5% - 6.0% ] 5.60% | 125 | 9.5% |
[ 6.0% - 6.5% ] 6.06% | 132 | 14.4% |
[ 6.5% - 7.0% ] 6.64% | 286 | 15.0% |
[ 9.5% - 10.0% ] 9.86% | 436 | 11.7% |