Immigrants from Greece 2 or more Vehicles in Household
COMPARE
Immigrants from Greece
Select to Compare
2 or more Vehicles in Household
Immigrants from Greece 2 or more Vehicles in Household
50.2%
2+ VEHICLES AVAILABLE
0.0/ 100
METRIC RATING
301st/ 347
METRIC RANK
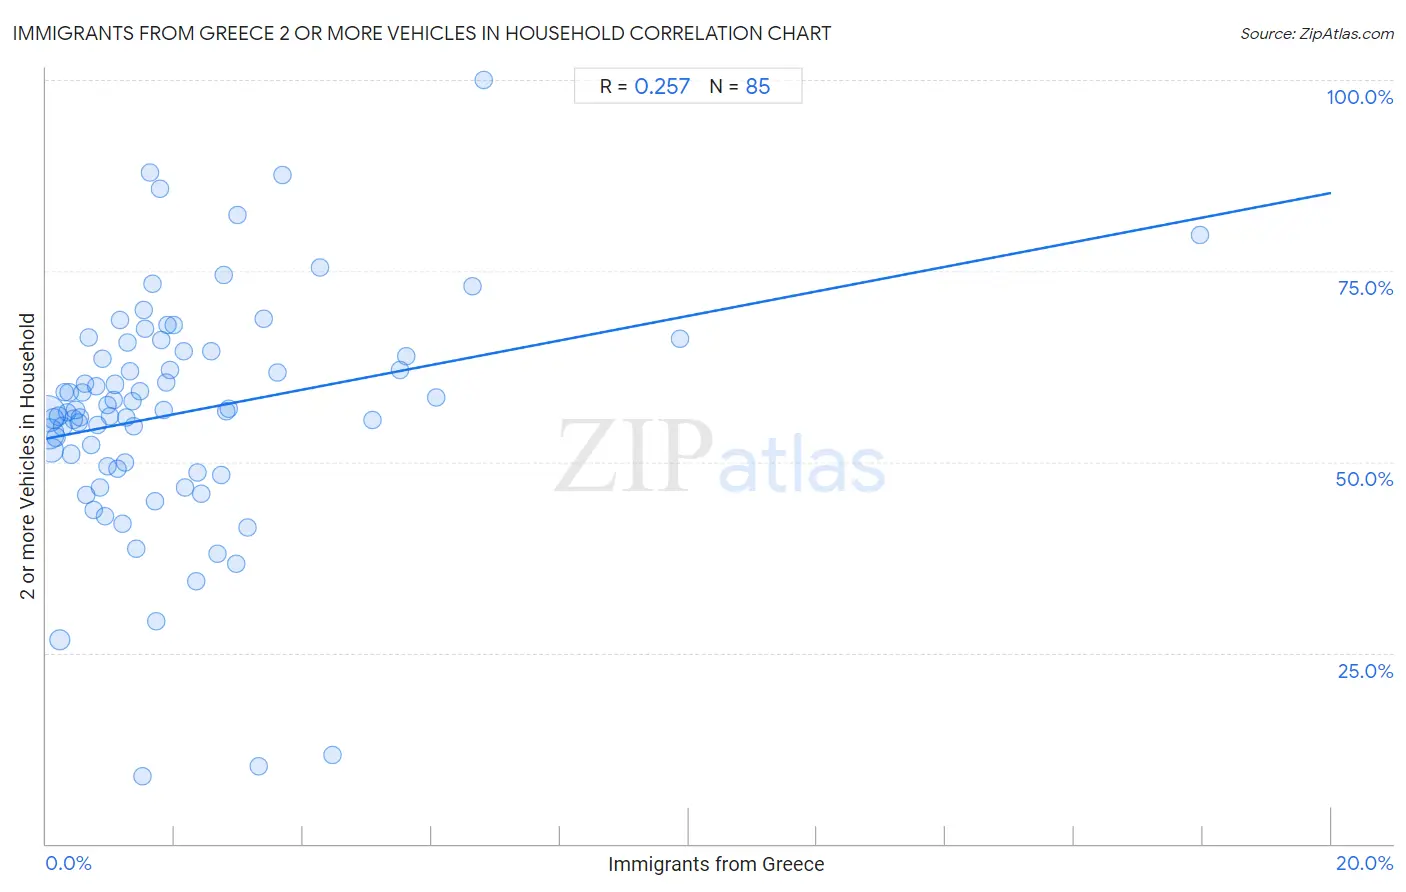
Immigrants from Greece 2 or more Vehicles in Household Correlation Chart
The statistical analysis conducted on geographies consisting of 216,819,966 people shows a weak positive correlation between the proportion of Immigrants from Greece and percentage of households with 2 or more vehicles available in the United States with a correlation coefficient (R) of 0.257 and weighted average of 50.2%. On average, for every 1% (one percent) increase in Immigrants from Greece within a typical geography, there is an increase of 1.6% in percentage of households with 2 or more vehicles available.
It is essential to understand that the correlation between the percentage of Immigrants from Greece and percentage of households with 2 or more vehicles available does not imply a direct cause-and-effect relationship. It remains uncertain whether the presence of Immigrants from Greece influences an upward or downward trend in the level of percentage of households with 2 or more vehicles available within an area, or if Immigrants from Greece simply ended up residing in those areas with higher or lower levels of percentage of households with 2 or more vehicles available due to other factors.
Demographics Similar to Immigrants from Greece by 2 or more Vehicles in Household
In terms of 2 or more vehicles in household, the demographic groups most similar to Immigrants from Greece are Immigrants from South America (50.2%, a difference of 0.060%), Immigrants from Russia (50.3%, a difference of 0.18%), Immigrants from Morocco (50.3%, a difference of 0.22%), Paraguayan (50.3%, a difference of 0.25%), and Immigrants from Spain (50.4%, a difference of 0.38%).
| Demographics | Rating | Rank | 2 or more Vehicles in Household |
| Bermudans | 0.0 /100 | #294 | Tragic 50.6% |
| Cypriots | 0.0 /100 | #295 | Tragic 50.6% |
| Immigrants from Somalia | 0.0 /100 | #296 | Tragic 50.5% |
| Immigrants from Spain | 0.0 /100 | #297 | Tragic 50.4% |
| Paraguayans | 0.0 /100 | #298 | Tragic 50.3% |
| Immigrants from Morocco | 0.0 /100 | #299 | Tragic 50.3% |
| Immigrants from Russia | 0.0 /100 | #300 | Tragic 50.3% |
| Immigrants from Greece | 0.0 /100 | #301 | Tragic 50.2% |
| Immigrants from South America | 0.0 /100 | #302 | Tragic 50.2% |
| Tohono O'odham | 0.0 /100 | #303 | Tragic 50.0% |
| Immigrants from Belize | 0.0 /100 | #304 | Tragic 49.9% |
| Immigrants from Western Africa | 0.0 /100 | #305 | Tragic 49.4% |
| Immigrants from Israel | 0.0 /100 | #306 | Tragic 49.2% |
| Hopi | 0.0 /100 | #307 | Tragic 49.0% |
| Albanians | 0.0 /100 | #308 | Tragic 49.0% |
Immigrants from Greece 2 or more Vehicles in Household Correlation Summary
| Measurement | Immigrants from Greece Data | 2 or more Vehicles in Household Data |
| Minimum | 0.018% | 8.9% |
| Maximum | 17.9% | 100.0% |
| Range | 17.9% | 91.1% |
| Mean | 2.1% | 56.4% |
| Median | 1.5% | 56.7% |
| Interquartile 25% (IQ1) | 0.72% | 49.3% |
| Interquartile 75% (IQ3) | 2.7% | 64.5% |
| Interquartile Range (IQR) | 2.0% | 15.2% |
| Standard Deviation (Sample) | 2.5% | 15.5% |
| Standard Deviation (Population) | 2.5% | 15.4% |
Correlation Details
| Immigrants from Greece Percentile | Sample Size | 2 or more Vehicles in Household |
[ 0.0% - 0.5% ] 0.018% | 81,497,248 | 56.3% |
[ 0.0% - 0.5% ] 0.048% | 52,838,212 | 53.6% |
[ 0.0% - 0.5% ] 0.085% | 25,609,833 | 51.5% |
[ 0.0% - 0.5% ] 0.12% | 12,030,420 | 55.7% |
[ 0.0% - 0.5% ] 0.15% | 7,934,699 | 53.3% |
[ 0.0% - 0.5% ] 0.19% | 6,189,024 | 55.9% |
[ 0.0% - 0.5% ] 0.22% | 12,543,961 | 26.7% |
[ 0.0% - 0.5% ] 0.25% | 3,495,627 | 54.7% |
[ 0.0% - 0.5% ] 0.29% | 2,771,453 | 59.1% |
[ 0.0% - 0.5% ] 0.33% | 1,510,684 | 56.5% |
[ 0.0% - 0.5% ] 0.36% | 1,273,191 | 59.0% |
[ 0.0% - 0.5% ] 0.39% | 1,500,038 | 51.0% |
[ 0.0% - 0.5% ] 0.43% | 858,533 | 55.6% |
[ 0.0% - 0.5% ] 0.46% | 769,793 | 56.8% |
[ 0.0% - 0.5% ] 0.50% | 495,756 | 55.2% |
[ 0.5% - 1.0% ] 0.53% | 593,213 | 55.9% |
[ 0.5% - 1.0% ] 0.56% | 580,890 | 59.1% |
[ 0.5% - 1.0% ] 0.59% | 396,111 | 60.3% |
[ 0.5% - 1.0% ] 0.63% | 263,130 | 45.6% |
[ 0.5% - 1.0% ] 0.66% | 326,223 | 66.2% |
[ 0.5% - 1.0% ] 0.70% | 416,246 | 52.2% |
[ 0.5% - 1.0% ] 0.74% | 436,879 | 43.8% |
[ 0.5% - 1.0% ] 0.77% | 271,969 | 59.9% |
[ 0.5% - 1.0% ] 0.80% | 189,510 | 54.8% |
[ 0.5% - 1.0% ] 0.84% | 99,919 | 46.7% |
[ 0.5% - 1.0% ] 0.88% | 103,539 | 63.5% |
[ 0.5% - 1.0% ] 0.91% | 338,740 | 42.9% |
[ 0.5% - 1.0% ] 0.94% | 132,714 | 49.5% |
[ 0.5% - 1.0% ] 0.96% | 82,146 | 57.4% |
[ 1.0% - 1.5% ] 1.00% | 81,424 | 55.9% |
[ 1.0% - 1.5% ] 1.05% | 44,604 | 58.0% |
[ 1.0% - 1.5% ] 1.07% | 190,184 | 60.2% |
[ 1.0% - 1.5% ] 1.11% | 73,561 | 49.1% |
[ 1.0% - 1.5% ] 1.14% | 55,003 | 68.7% |
[ 1.0% - 1.5% ] 1.18% | 36,579 | 41.9% |
[ 1.0% - 1.5% ] 1.22% | 15,324 | 49.9% |
[ 1.0% - 1.5% ] 1.25% | 147,609 | 55.8% |
[ 1.0% - 1.5% ] 1.26% | 19,934 | 65.6% |
[ 1.0% - 1.5% ] 1.31% | 23,333 | 61.9% |
[ 1.0% - 1.5% ] 1.35% | 29,920 | 57.9% |
[ 1.0% - 1.5% ] 1.36% | 5,131 | 54.7% |
[ 1.0% - 1.5% ] 1.41% | 62,329 | 38.6% |
[ 1.0% - 1.5% ] 1.45% | 12,672 | 59.2% |
[ 1.0% - 1.5% ] 1.49% | 43,768 | 8.9% |
[ 1.5% - 2.0% ] 1.53% | 36,350 | 70.0% |
[ 1.5% - 2.0% ] 1.55% | 32,400 | 67.5% |
[ 1.5% - 2.0% ] 1.61% | 1,057 | 87.8% |
[ 1.5% - 2.0% ] 1.65% | 4,801 | 73.3% |
[ 1.5% - 2.0% ] 1.69% | 8,620 | 44.8% |
[ 1.5% - 2.0% ] 1.72% | 57,708 | 29.1% |
[ 1.5% - 2.0% ] 1.77% | 5,939 | 85.8% |
[ 1.5% - 2.0% ] 1.78% | 5,100 | 66.0% |
[ 1.5% - 2.0% ] 1.83% | 3,277 | 56.7% |
[ 1.5% - 2.0% ] 1.86% | 10,439 | 60.4% |
[ 1.5% - 2.0% ] 1.89% | 317 | 68.0% |
[ 1.5% - 2.0% ] 1.93% | 2,483 | 62.1% |
[ 1.5% - 2.0% ] 1.99% | 302 | 67.9% |
[ 2.0% - 2.5% ] 2.13% | 2,440 | 64.4% |
[ 2.0% - 2.5% ] 2.15% | 45,387 | 46.7% |
[ 2.0% - 2.5% ] 2.34% | 37,647 | 34.3% |
[ 2.0% - 2.5% ] 2.36% | 27,076 | 48.6% |
[ 2.0% - 2.5% ] 2.41% | 27,959 | 45.9% |
[ 2.5% - 3.0% ] 2.57% | 272 | 64.5% |
[ 2.5% - 3.0% ] 2.66% | 19,719 | 38.0% |
[ 2.5% - 3.0% ] 2.72% | 588 | 48.3% |
[ 2.5% - 3.0% ] 2.76% | 8,565 | 74.4% |
[ 2.5% - 3.0% ] 2.80% | 1,642 | 56.7% |
[ 2.5% - 3.0% ] 2.84% | 1,515 | 56.9% |
[ 2.5% - 3.0% ] 2.95% | 2,914 | 36.6% |
[ 2.5% - 3.0% ] 2.98% | 1,880 | 82.3% |
[ 3.0% - 3.5% ] 3.14% | 7,365 | 41.3% |
[ 3.0% - 3.5% ] 3.31% | 28,882 | 10.1% |
[ 3.0% - 3.5% ] 3.39% | 3,631 | 68.8% |
[ 3.5% - 4.0% ] 3.60% | 694 | 61.8% |
[ 3.5% - 4.0% ] 3.67% | 245 | 87.5% |
[ 4.0% - 4.5% ] 4.26% | 938 | 75.4% |
[ 4.0% - 4.5% ] 4.45% | 38,756 | 11.6% |
[ 5.0% - 5.5% ] 5.08% | 354 | 55.4% |
[ 5.5% - 6.0% ] 5.50% | 327 | 62.0% |
[ 5.5% - 6.0% ] 5.60% | 125 | 63.8% |
[ 6.0% - 6.5% ] 6.06% | 132 | 58.4% |
[ 6.5% - 7.0% ] 6.64% | 286 | 72.9% |
[ 6.5% - 7.0% ] 6.82% | 88 | 100.0% |
[ 9.5% - 10.0% ] 9.86% | 436 | 66.1% |
[ 17.5% - 18.0% ] 17.95% | 234 | 79.7% |