Immigrants from Cameroon vs Immigrants from Scotland Married-Couple Family Poverty
COMPARE
Immigrants from Cameroon
Immigrants from Scotland
Married-Couple Family Poverty
Married-Couple Family Poverty Comparison
Immigrants from Cameroon
Immigrants from Scotland
5.0%
MARRIED-COUPLE FAMILY POVERTY
77.3/ 100
METRIC RATING
151st/ 347
METRIC RANK
4.2%
MARRIED-COUPLE FAMILY POVERTY
99.9/ 100
METRIC RATING
29th/ 347
METRIC RANK
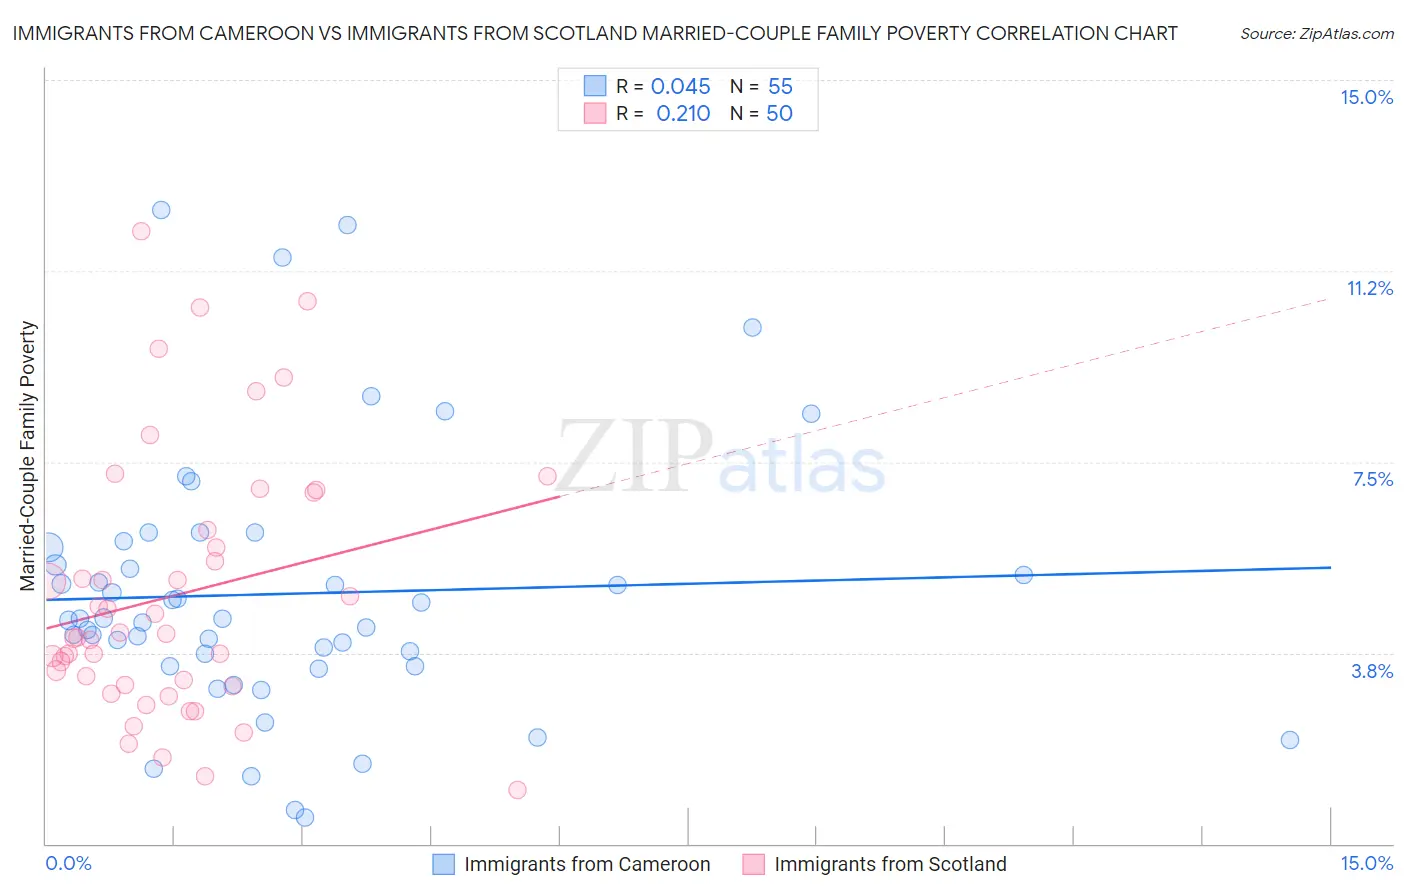
Immigrants from Cameroon vs Immigrants from Scotland Married-Couple Family Poverty Correlation Chart
The statistical analysis conducted on geographies consisting of 130,410,989 people shows no correlation between the proportion of Immigrants from Cameroon and poverty level among married-couple families in the United States with a correlation coefficient (R) of 0.045 and weighted average of 5.0%. Similarly, the statistical analysis conducted on geographies consisting of 195,462,038 people shows a weak positive correlation between the proportion of Immigrants from Scotland and poverty level among married-couple families in the United States with a correlation coefficient (R) of 0.210 and weighted average of 4.2%, a difference of 21.3%.
Married-Couple Family Poverty Correlation Summary
| Measurement | Immigrants from Cameroon | Immigrants from Scotland |
| Minimum | 0.51% | 1.1% |
| Maximum | 12.4% | 12.0% |
| Range | 11.9% | 11.0% |
| Mean | 4.9% | 4.9% |
| Median | 4.4% | 4.1% |
| Interquartile 25% (IQ1) | 3.5% | 3.1% |
| Interquartile 75% (IQ3) | 5.8% | 6.2% |
| Interquartile Range (IQR) | 2.3% | 3.1% |
| Standard Deviation (Sample) | 2.6% | 2.6% |
| Standard Deviation (Population) | 2.6% | 2.5% |
Similar Demographics by Married-Couple Family Poverty
Demographics Similar to Immigrants from Cameroon by Married-Couple Family Poverty
In terms of married-couple family poverty, the demographic groups most similar to Immigrants from Cameroon are Albanian (5.0%, a difference of 0.010%), Immigrants from Kuwait (5.0%, a difference of 0.16%), Brazilian (5.0%, a difference of 0.17%), Immigrants from Oceania (5.0%, a difference of 0.23%), and Syrian (5.0%, a difference of 0.25%).
| Demographics | Rating | Rank | Married-Couple Family Poverty |
| Hmong | 83.2 /100 | #144 | Excellent 5.0% |
| Immigrants | Spain | 79.9 /100 | #145 | Good 5.0% |
| Mongolians | 79.8 /100 | #146 | Good 5.0% |
| Syrians | 78.7 /100 | #147 | Good 5.0% |
| Immigrants | Russia | 78.7 /100 | #148 | Good 5.0% |
| Immigrants | Oceania | 78.6 /100 | #149 | Good 5.0% |
| Brazilians | 78.3 /100 | #150 | Good 5.0% |
| Immigrants | Cameroon | 77.3 /100 | #151 | Good 5.0% |
| Albanians | 77.2 /100 | #152 | Good 5.0% |
| Immigrants | Kuwait | 76.3 /100 | #153 | Good 5.0% |
| Delaware | 73.7 /100 | #154 | Good 5.1% |
| Immigrants | Ethiopia | 72.4 /100 | #155 | Good 5.1% |
| Sri Lankans | 72.2 /100 | #156 | Good 5.1% |
| Argentineans | 70.7 /100 | #157 | Good 5.1% |
| Immigrants | South Eastern Asia | 70.4 /100 | #158 | Good 5.1% |
Demographics Similar to Immigrants from Scotland by Married-Couple Family Poverty
In terms of married-couple family poverty, the demographic groups most similar to Immigrants from Scotland are Scandinavian (4.1%, a difference of 0.040%), Danish (4.1%, a difference of 0.15%), Finnish (4.2%, a difference of 0.24%), Cypriot (4.1%, a difference of 0.26%), and Estonian (4.2%, a difference of 0.32%).
| Demographics | Rating | Rank | Married-Couple Family Poverty |
| Immigrants | Singapore | 99.9 /100 | #22 | Exceptional 4.1% |
| Bhutanese | 99.9 /100 | #23 | Exceptional 4.1% |
| Eastern Europeans | 99.9 /100 | #24 | Exceptional 4.1% |
| Immigrants | Taiwan | 99.9 /100 | #25 | Exceptional 4.1% |
| Cypriots | 99.9 /100 | #26 | Exceptional 4.1% |
| Danes | 99.9 /100 | #27 | Exceptional 4.1% |
| Scandinavians | 99.9 /100 | #28 | Exceptional 4.1% |
| Immigrants | Scotland | 99.9 /100 | #29 | Exceptional 4.2% |
| Finns | 99.9 /100 | #30 | Exceptional 4.2% |
| Estonians | 99.9 /100 | #31 | Exceptional 4.2% |
| Greeks | 99.9 /100 | #32 | Exceptional 4.2% |
| Irish | 99.9 /100 | #33 | Exceptional 4.2% |
| Dutch | 99.9 /100 | #34 | Exceptional 4.2% |
| Europeans | 99.9 /100 | #35 | Exceptional 4.2% |
| English | 99.9 /100 | #36 | Exceptional 4.2% |