Immigrants from Cameroon Self-Care Disability
COMPARE
Immigrants from Cameroon
Select to Compare
Self-Care Disability
Immigrants from Cameroon Self-Care Disability
2.3%
SELF-CARE DISABILITY
99.6/ 100
METRIC RATING
58th/ 347
METRIC RANK
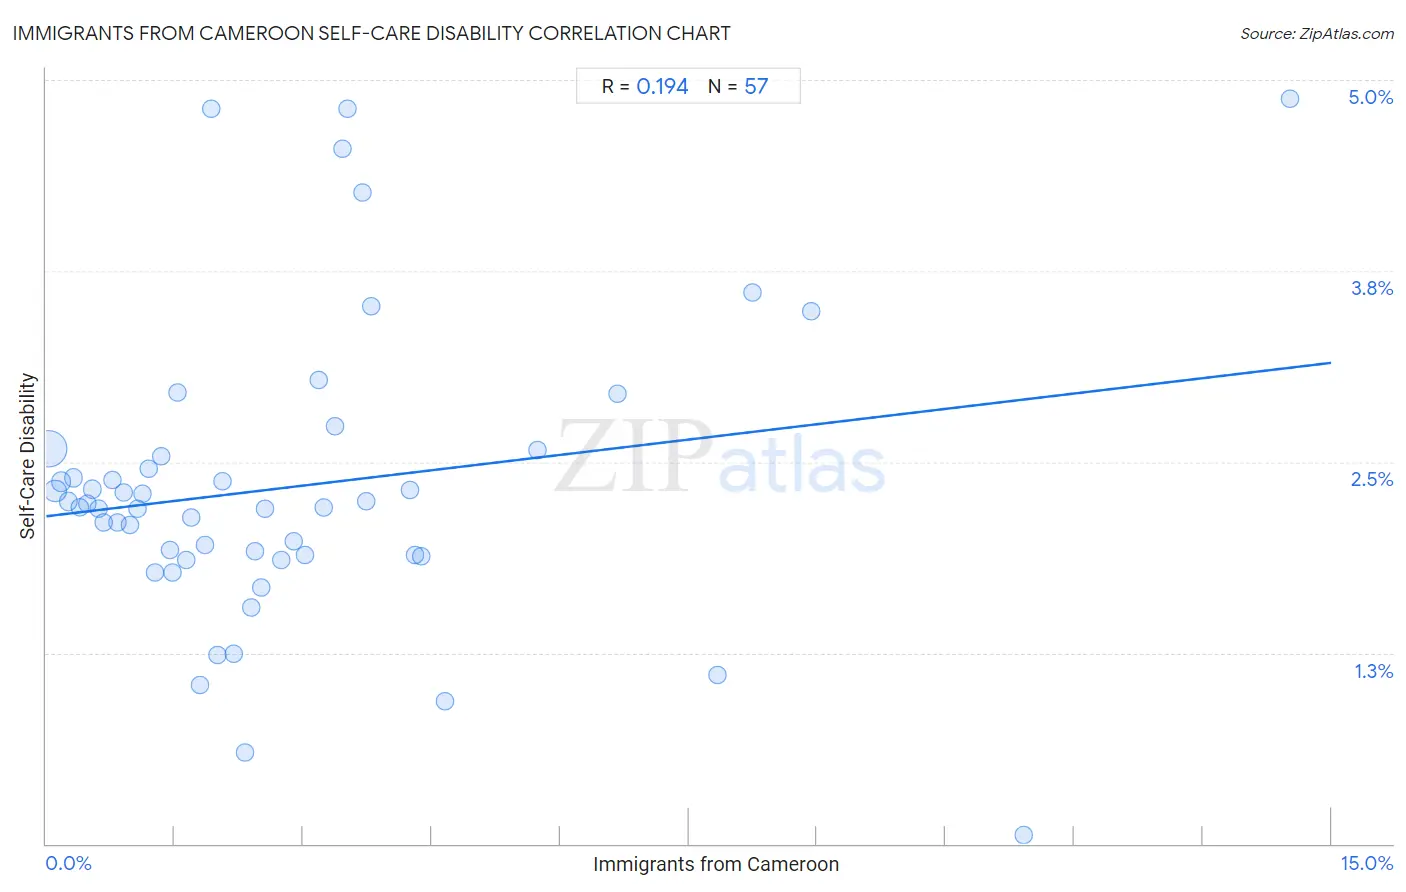
Immigrants from Cameroon Self-Care Disability Correlation Chart
The statistical analysis conducted on geographies consisting of 130,698,319 people shows a poor positive correlation between the proportion of Immigrants from Cameroon and percentage of population with self-care disability in the United States with a correlation coefficient (R) of 0.194 and weighted average of 2.3%. On average, for every 1% (one percent) increase in Immigrants from Cameroon within a typical geography, there is an increase of 0.067% in percentage of population with self-care disability.
It is essential to understand that the correlation between the percentage of Immigrants from Cameroon and percentage of population with self-care disability does not imply a direct cause-and-effect relationship. It remains uncertain whether the presence of Immigrants from Cameroon influences an upward or downward trend in the level of percentage of population with self-care disability within an area, or if Immigrants from Cameroon simply ended up residing in those areas with higher or lower levels of percentage of population with self-care disability due to other factors.
Demographics Similar to Immigrants from Cameroon by Self-Care Disability
In terms of self-care disability, the demographic groups most similar to Immigrants from Cameroon are Immigrants from Belgium (2.3%, a difference of 0.070%), Immigrants from Eastern Asia (2.3%, a difference of 0.080%), New Zealander (2.3%, a difference of 0.11%), Immigrants from France (2.3%, a difference of 0.12%), and Argentinean (2.3%, a difference of 0.18%).
| Demographics | Rating | Rank | Self-Care Disability |
| Kenyans | 99.7 /100 | #51 | Exceptional 2.3% |
| Immigrants from Serbia | 99.6 /100 | #52 | Exceptional 2.3% |
| Australians | 99.6 /100 | #53 | Exceptional 2.3% |
| Argentineans | 99.6 /100 | #54 | Exceptional 2.3% |
| Immigrants from France | 99.6 /100 | #55 | Exceptional 2.3% |
| Immigrants from Eastern Asia | 99.6 /100 | #56 | Exceptional 2.3% |
| Immigrants from Belgium | 99.6 /100 | #57 | Exceptional 2.3% |
| Immigrants from Cameroon | 99.6 /100 | #58 | Exceptional 2.3% |
| New Zealanders | 99.5 /100 | #59 | Exceptional 2.3% |
| Immigrants from Japan | 99.5 /100 | #60 | Exceptional 2.3% |
| Palestinians | 99.4 /100 | #61 | Exceptional 2.3% |
| Egyptians | 99.4 /100 | #62 | Exceptional 2.3% |
| Mongolians | 99.3 /100 | #63 | Exceptional 2.3% |
| Swedes | 99.3 /100 | #64 | Exceptional 2.3% |
| Brazilians | 99.3 /100 | #65 | Exceptional 2.3% |
Immigrants from Cameroon Self-Care Disability Correlation Summary
| Measurement | Immigrants from Cameroon Data | Self-Care Disability Data |
| Minimum | 0.024% | 0.061% |
| Maximum | 14.5% | 4.9% |
| Range | 14.5% | 4.8% |
| Mean | 2.8% | 2.3% |
| Median | 2.1% | 2.2% |
| Interquartile 25% (IQ1) | 1.0% | 1.9% |
| Interquartile 75% (IQ3) | 3.6% | 2.6% |
| Interquartile Range (IQR) | 2.6% | 0.67% |
| Standard Deviation (Sample) | 2.8% | 0.97% |
| Standard Deviation (Population) | 2.8% | 0.96% |
Correlation Details
| Immigrants from Cameroon Percentile | Sample Size | Self-Care Disability |
[ 0.0% - 0.5% ] 0.024% | 87,891,309 | 2.6% |
[ 0.0% - 0.5% ] 0.11% | 20,469,922 | 2.3% |
[ 0.0% - 0.5% ] 0.18% | 7,219,428 | 2.4% |
[ 0.0% - 0.5% ] 0.26% | 4,072,350 | 2.2% |
[ 0.0% - 0.5% ] 0.32% | 2,543,477 | 2.4% |
[ 0.0% - 0.5% ] 0.39% | 1,399,286 | 2.2% |
[ 0.0% - 0.5% ] 0.48% | 1,121,500 | 2.2% |
[ 0.5% - 1.0% ] 0.54% | 1,373,969 | 2.3% |
[ 0.5% - 1.0% ] 0.61% | 891,618 | 2.2% |
[ 0.5% - 1.0% ] 0.67% | 468,871 | 2.1% |
[ 0.5% - 1.0% ] 0.77% | 331,550 | 2.4% |
[ 0.5% - 1.0% ] 0.83% | 382,001 | 2.1% |
[ 0.5% - 1.0% ] 0.90% | 395,342 | 2.3% |
[ 0.5% - 1.0% ] 0.97% | 245,386 | 2.1% |
[ 1.0% - 1.5% ] 1.06% | 194,246 | 2.2% |
[ 1.0% - 1.5% ] 1.12% | 112,397 | 2.3% |
[ 1.0% - 1.5% ] 1.19% | 233,873 | 2.5% |
[ 1.0% - 1.5% ] 1.27% | 55,528 | 1.8% |
[ 1.0% - 1.5% ] 1.34% | 132,721 | 2.5% |
[ 1.0% - 1.5% ] 1.44% | 73,432 | 1.9% |
[ 1.0% - 1.5% ] 1.47% | 26,453 | 1.8% |
[ 1.5% - 2.0% ] 1.54% | 17,313 | 3.0% |
[ 1.5% - 2.0% ] 1.63% | 134,094 | 1.9% |
[ 1.5% - 2.0% ] 1.69% | 58,835 | 2.1% |
[ 1.5% - 2.0% ] 1.79% | 33,476 | 1.0% |
[ 1.5% - 2.0% ] 1.85% | 156,126 | 2.0% |
[ 1.5% - 2.0% ] 1.93% | 2,281 | 4.8% |
[ 1.5% - 2.0% ] 2.00% | 59,379 | 1.2% |
[ 2.0% - 2.5% ] 2.05% | 40,607 | 2.4% |
[ 2.0% - 2.5% ] 2.19% | 6,341 | 1.2% |
[ 2.0% - 2.5% ] 2.31% | 2,376 | 0.59% |
[ 2.0% - 2.5% ] 2.39% | 33,420 | 1.5% |
[ 2.0% - 2.5% ] 2.44% | 49,658 | 1.9% |
[ 2.5% - 3.0% ] 2.51% | 2,034 | 1.7% |
[ 2.5% - 3.0% ] 2.55% | 20,833 | 2.2% |
[ 2.5% - 3.0% ] 2.75% | 3,896 | 1.9% |
[ 2.5% - 3.0% ] 2.89% | 38,782 | 2.0% |
[ 3.0% - 3.5% ] 3.02% | 12,103 | 1.9% |
[ 3.0% - 3.5% ] 3.18% | 75,901 | 3.0% |
[ 3.0% - 3.5% ] 3.23% | 58,093 | 2.2% |
[ 3.0% - 3.5% ] 3.37% | 6,638 | 2.7% |
[ 3.0% - 3.5% ] 3.46% | 11,662 | 4.5% |
[ 3.5% - 4.0% ] 3.52% | 8,290 | 4.8% |
[ 3.5% - 4.0% ] 3.69% | 2,330 | 4.3% |
[ 3.5% - 4.0% ] 3.73% | 24,646 | 2.2% |
[ 3.5% - 4.0% ] 3.79% | 12,128 | 3.5% |
[ 4.0% - 4.5% ] 4.24% | 75,988 | 2.3% |
[ 4.0% - 4.5% ] 4.30% | 28,427 | 1.9% |
[ 4.0% - 4.5% ] 4.38% | 27,909 | 1.9% |
[ 4.5% - 5.0% ] 4.65% | 16,944 | 0.93% |
[ 5.5% - 6.0% ] 5.73% | 5,041 | 2.6% |
[ 6.5% - 7.0% ] 6.67% | 2,699 | 2.9% |
[ 7.5% - 8.0% ] 7.84% | 13,580 | 1.1% |
[ 8.0% - 8.5% ] 8.24% | 15,489 | 3.6% |
[ 8.5% - 9.0% ] 8.92% | 3,104 | 3.5% |
[ 11.0% - 11.5% ] 11.42% | 1,997 | 0.061% |
[ 14.5% - 15.0% ] 14.52% | 1,240 | 4.9% |