Immigrants from Cambodia 1 or more Vehicles in Household
COMPARE
Immigrants from Cambodia
Select to Compare
1 or more Vehicles in Household
Immigrants from Cambodia 1 or more Vehicles in Household
89.8%
1+ VEHICLES AVAILABLE
60.1/ 100
METRIC RATING
168th/ 347
METRIC RANK
Immigrants from Cambodia 1 or more Vehicles in Household Correlation Chart
The statistical analysis conducted on geographies consisting of 205,137,699 people shows a mild positive correlation between the proportion of Immigrants from Cambodia and percentage of households with 1 or more vehicles available in the United States with a correlation coefficient (R) of 0.340 and weighted average of 89.8%. On average, for every 1% (one percent) increase in Immigrants from Cambodia within a typical geography, there is an increase of 0.32% in percentage of households with 1 or more vehicles available.
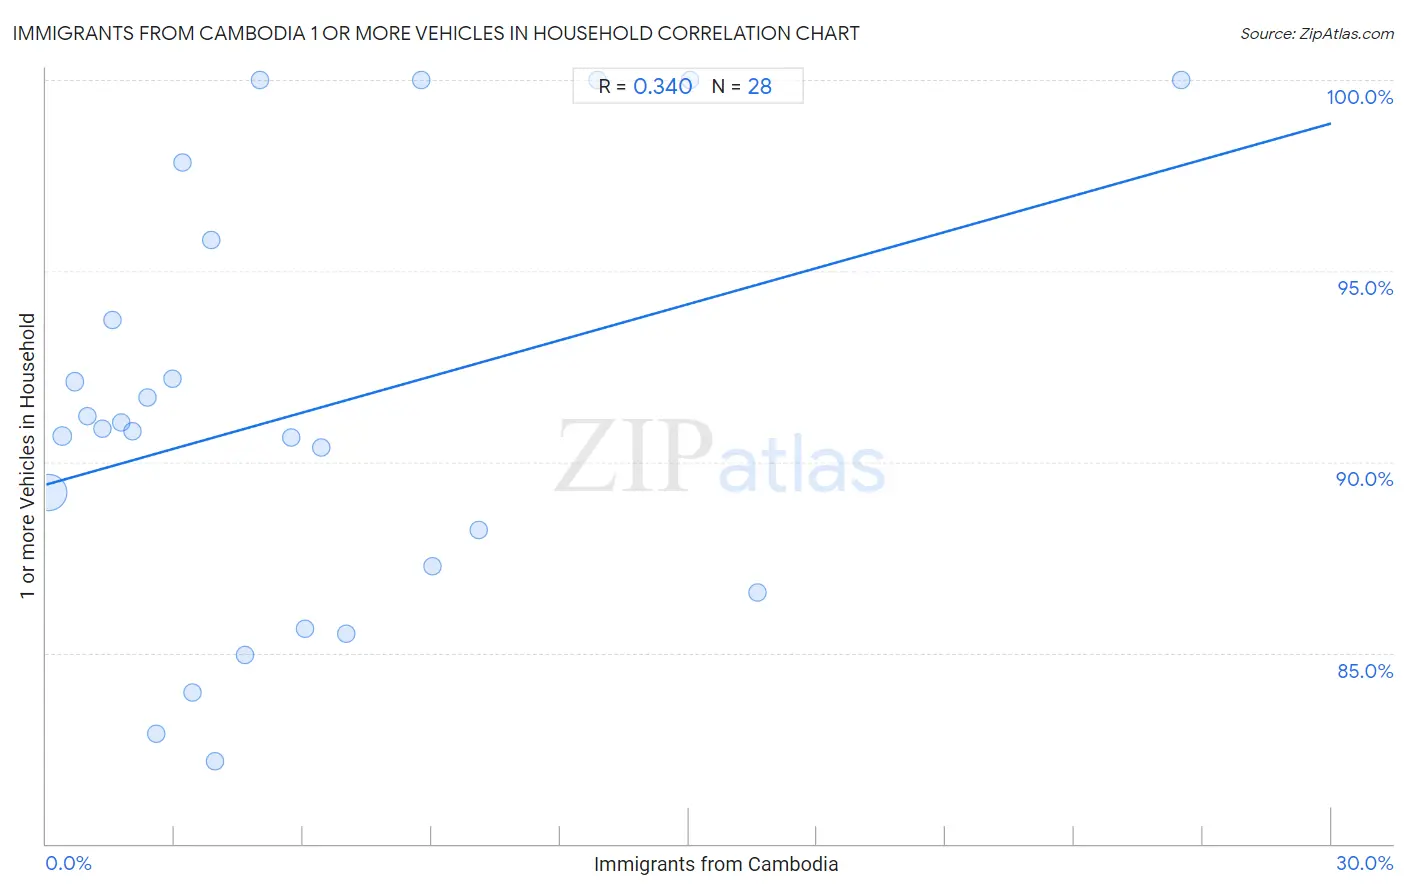
It is essential to understand that the correlation between the percentage of Immigrants from Cambodia and percentage of households with 1 or more vehicles available does not imply a direct cause-and-effect relationship. It remains uncertain whether the presence of Immigrants from Cambodia influences an upward or downward trend in the level of percentage of households with 1 or more vehicles available within an area, or if Immigrants from Cambodia simply ended up residing in those areas with higher or lower levels of percentage of households with 1 or more vehicles available due to other factors.
Demographics Similar to Immigrants from Cambodia by 1 or more Vehicles in Household
In terms of 1 or more vehicles in household, the demographic groups most similar to Immigrants from Cambodia are Immigrants from Latin America (89.8%, a difference of 0.0%), Native/Alaskan (89.8%, a difference of 0.010%), Immigrants from Saudi Arabia (89.9%, a difference of 0.040%), Immigrants from Middle Africa (89.9%, a difference of 0.040%), and Immigrants from Costa Rica (89.8%, a difference of 0.040%).
| Demographics | Rating | Rank | 1 or more Vehicles in Household |
| Salvadorans | 68.7 /100 | #161 | Good 90.0% |
| Spanish American Indians | 67.0 /100 | #162 | Good 89.9% |
| Immigrants from Austria | 65.5 /100 | #163 | Good 89.9% |
| Comanche | 63.4 /100 | #164 | Good 89.9% |
| Immigrants from Saudi Arabia | 62.6 /100 | #165 | Good 89.9% |
| Immigrants from Middle Africa | 62.2 /100 | #166 | Good 89.9% |
| Immigrants from Latin America | 60.3 /100 | #167 | Good 89.8% |
| Immigrants from Cambodia | 60.1 /100 | #168 | Good 89.8% |
| Natives/Alaskans | 59.5 /100 | #169 | Average 89.8% |
| Immigrants from Costa Rica | 57.6 /100 | #170 | Average 89.8% |
| French American Indians | 54.4 /100 | #171 | Average 89.8% |
| Indonesians | 53.0 /100 | #172 | Average 89.7% |
| Lumbee | 52.8 /100 | #173 | Average 89.7% |
| Filipinos | 50.0 /100 | #174 | Average 89.7% |
| Immigrants from Burma/Myanmar | 47.6 /100 | #175 | Average 89.7% |
Immigrants from Cambodia 1 or more Vehicles in Household Correlation Summary
| Measurement | Immigrants from Cambodia Data | 1 or more Vehicles in Household Data |
| Minimum | 0.067% | 82.2% |
| Maximum | 26.5% | 100.0% |
| Range | 26.4% | 17.8% |
| Mean | 5.9% | 91.3% |
| Median | 3.9% | 90.8% |
| Interquartile 25% (IQ1) | 1.9% | 86.9% |
| Interquartile 75% (IQ3) | 7.9% | 94.8% |
| Interquartile Range (IQR) | 6.0% | 7.8% |
| Standard Deviation (Sample) | 5.9% | 5.5% |
| Standard Deviation (Population) | 5.8% | 5.4% |
Correlation Details
| Immigrants from Cambodia Percentile | Sample Size | 1 or more Vehicles in Household |
[ 0.0% - 0.5% ] 0.067% | 180,839,235 | 89.2% |
[ 0.0% - 0.5% ] 0.38% | 16,210,725 | 90.7% |
[ 0.5% - 1.0% ] 0.67% | 3,948,976 | 92.1% |
[ 0.5% - 1.0% ] 0.96% | 1,720,385 | 91.2% |
[ 1.0% - 1.5% ] 1.30% | 767,563 | 90.9% |
[ 1.5% - 2.0% ] 1.53% | 227,403 | 93.7% |
[ 1.5% - 2.0% ] 1.76% | 540,844 | 91.0% |
[ 2.0% - 2.5% ] 2.02% | 176,237 | 90.8% |
[ 2.0% - 2.5% ] 2.36% | 93,738 | 91.7% |
[ 2.5% - 3.0% ] 2.56% | 178,957 | 82.9% |
[ 2.5% - 3.0% ] 2.95% | 113,217 | 92.2% |
[ 3.0% - 3.5% ] 3.19% | 3,171 | 97.8% |
[ 3.0% - 3.5% ] 3.43% | 69,995 | 84.0% |
[ 3.5% - 4.0% ] 3.85% | 28,199 | 95.8% |
[ 3.5% - 4.0% ] 3.95% | 58,494 | 82.2% |
[ 4.5% - 5.0% ] 4.63% | 2,138 | 85.0% |
[ 4.5% - 5.0% ] 4.99% | 1,063 | 100.0% |
[ 5.5% - 6.0% ] 5.71% | 3,575 | 90.6% |
[ 6.0% - 6.5% ] 6.03% | 365 | 85.6% |
[ 6.0% - 6.5% ] 6.41% | 2,215 | 90.4% |
[ 7.0% - 7.5% ] 7.00% | 115,148 | 85.5% |
[ 8.5% - 9.0% ] 8.75% | 560 | 100.0% |
[ 9.0% - 9.5% ] 9.02% | 1,575 | 87.3% |
[ 10.0% - 10.5% ] 10.10% | 921 | 88.2% |
[ 12.5% - 13.0% ] 12.88% | 132 | 100.0% |
[ 15.0% - 15.5% ] 15.03% | 326 | 100.0% |
[ 16.5% - 17.0% ] 16.60% | 32,323 | 86.6% |
[ 26.0% - 26.5% ] 26.48% | 219 | 100.0% |