Immigrants from Cambodia Disability Age 5 to 17
COMPARE
Immigrants from Cambodia
Select to Compare
Disability Age 5 to 17
Immigrants from Cambodia Disability Age 5 to 17
5.9%
DISABILITY | AGE 5 TO 17
1.5/ 100
METRIC RATING
251st/ 347
METRIC RANK
Immigrants from Cambodia Disability Age 5 to 17 Correlation Chart
The statistical analysis conducted on geographies consisting of 204,706,701 people shows a mild positive correlation between the proportion of Immigrants from Cambodia and percentage of population with a disability between the ages 5 and 17 in the United States with a correlation coefficient (R) of 0.340 and weighted average of 5.9%. On average, for every 1% (one percent) increase in Immigrants from Cambodia within a typical geography, there is an increase of 0.37% in percentage of population with a disability between the ages 5 and 17.
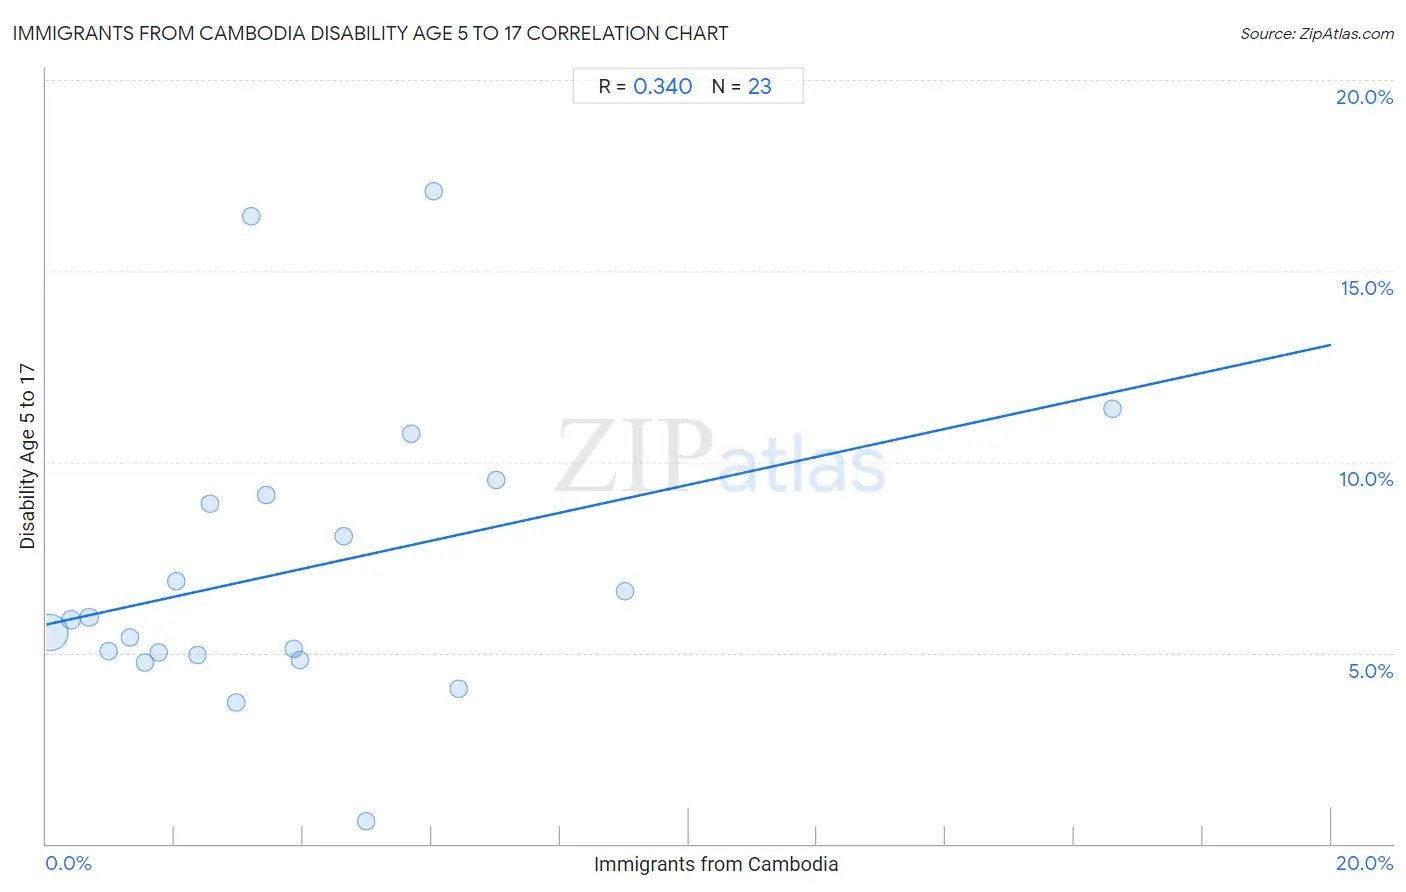
It is essential to understand that the correlation between the percentage of Immigrants from Cambodia and percentage of population with a disability between the ages 5 and 17 does not imply a direct cause-and-effect relationship. It remains uncertain whether the presence of Immigrants from Cambodia influences an upward or downward trend in the level of percentage of population with a disability between the ages 5 and 17 within an area, or if Immigrants from Cambodia simply ended up residing in those areas with higher or lower levels of percentage of population with a disability between the ages 5 and 17 due to other factors.
Demographics Similar to Immigrants from Cambodia by Disability Age 5 to 17
In terms of disability age 5 to 17, the demographic groups most similar to Immigrants from Cambodia are Polish (5.9%, a difference of 0.020%), Honduran (5.9%, a difference of 0.020%), Scandinavian (5.9%, a difference of 0.090%), Immigrants from Ghana (5.9%, a difference of 0.14%), and British (5.9%, a difference of 0.16%).
| Demographics | Rating | Rank | Disability Age 5 to 17 |
| Immigrants from Germany | 1.9 /100 | #244 | Tragic 5.9% |
| Immigrants from Micronesia | 1.9 /100 | #245 | Tragic 5.9% |
| Tlingit-Haida | 1.9 /100 | #246 | Tragic 5.9% |
| Immigrants from Honduras | 1.8 /100 | #247 | Tragic 5.9% |
| British | 1.7 /100 | #248 | Tragic 5.9% |
| Immigrants from Ghana | 1.7 /100 | #249 | Tragic 5.9% |
| Poles | 1.5 /100 | #250 | Tragic 5.9% |
| Immigrants from Cambodia | 1.5 /100 | #251 | Tragic 5.9% |
| Hondurans | 1.5 /100 | #252 | Tragic 5.9% |
| Scandinavians | 1.4 /100 | #253 | Tragic 5.9% |
| Barbadians | 1.3 /100 | #254 | Tragic 5.9% |
| Italians | 1.2 /100 | #255 | Tragic 5.9% |
| Hopi | 1.0 /100 | #256 | Tragic 5.9% |
| Hispanics or Latinos | 1.0 /100 | #257 | Tragic 5.9% |
| Brazilians | 0.9 /100 | #258 | Tragic 5.9% |
Immigrants from Cambodia Disability Age 5 to 17 Correlation Summary
| Measurement | Immigrants from Cambodia Data | Disability Age 5 to 17 Data |
| Minimum | 0.067% | 0.58% |
| Maximum | 16.6% | 17.1% |
| Range | 16.5% | 16.5% |
| Mean | 4.0% | 7.2% |
| Median | 3.2% | 5.9% |
| Interquartile 25% (IQ1) | 1.5% | 4.9% |
| Interquartile 75% (IQ3) | 5.7% | 9.1% |
| Interquartile Range (IQR) | 4.1% | 4.2% |
| Standard Deviation (Sample) | 3.6% | 3.9% |
| Standard Deviation (Population) | 3.5% | 3.8% |
Correlation Details
| Immigrants from Cambodia Percentile | Sample Size | Disability Age 5 to 17 |
[ 0.0% - 0.5% ] 0.067% | 180,564,882 | 5.5% |
[ 0.0% - 0.5% ] 0.38% | 16,165,089 | 5.9% |
[ 0.5% - 1.0% ] 0.67% | 3,900,884 | 5.9% |
[ 0.5% - 1.0% ] 0.96% | 1,695,849 | 5.0% |
[ 1.0% - 1.5% ] 1.30% | 762,842 | 5.4% |
[ 1.5% - 2.0% ] 1.54% | 214,216 | 4.8% |
[ 1.5% - 2.0% ] 1.76% | 536,528 | 5.0% |
[ 2.0% - 2.5% ] 2.02% | 176,142 | 6.9% |
[ 2.0% - 2.5% ] 2.36% | 93,738 | 4.9% |
[ 2.5% - 3.0% ] 2.56% | 171,029 | 8.9% |
[ 2.5% - 3.0% ] 2.96% | 109,649 | 3.7% |
[ 3.0% - 3.5% ] 3.19% | 2,794 | 16.4% |
[ 3.0% - 3.5% ] 3.43% | 69,995 | 9.1% |
[ 3.5% - 4.0% ] 3.85% | 27,243 | 5.1% |
[ 3.5% - 4.0% ] 3.95% | 58,494 | 4.8% |
[ 4.5% - 5.0% ] 4.63% | 2,050 | 8.1% |
[ 4.5% - 5.0% ] 4.99% | 1,063 | 0.58% |
[ 5.5% - 6.0% ] 5.68% | 2,588 | 10.7% |
[ 6.0% - 6.5% ] 6.03% | 365 | 17.1% |
[ 6.0% - 6.5% ] 6.41% | 2,215 | 4.1% |
[ 7.0% - 7.5% ] 7.00% | 115,148 | 9.5% |
[ 9.0% - 9.5% ] 9.02% | 1,575 | 6.6% |
[ 16.5% - 17.0% ] 16.60% | 32,323 | 11.4% |