Immigrants from Belgium vs Central American Indian Married-Couple Family Poverty
COMPARE
Immigrants from Belgium
Central American Indian
Married-Couple Family Poverty
Married-Couple Family Poverty Comparison
Immigrants from Belgium
Central American Indians
4.6%
MARRIED-COUPLE FAMILY POVERTY
98.2/ 100
METRIC RATING
97th/ 347
METRIC RANK
8.3%
MARRIED-COUPLE FAMILY POVERTY
0.0/ 100
METRIC RATING
331st/ 347
METRIC RANK
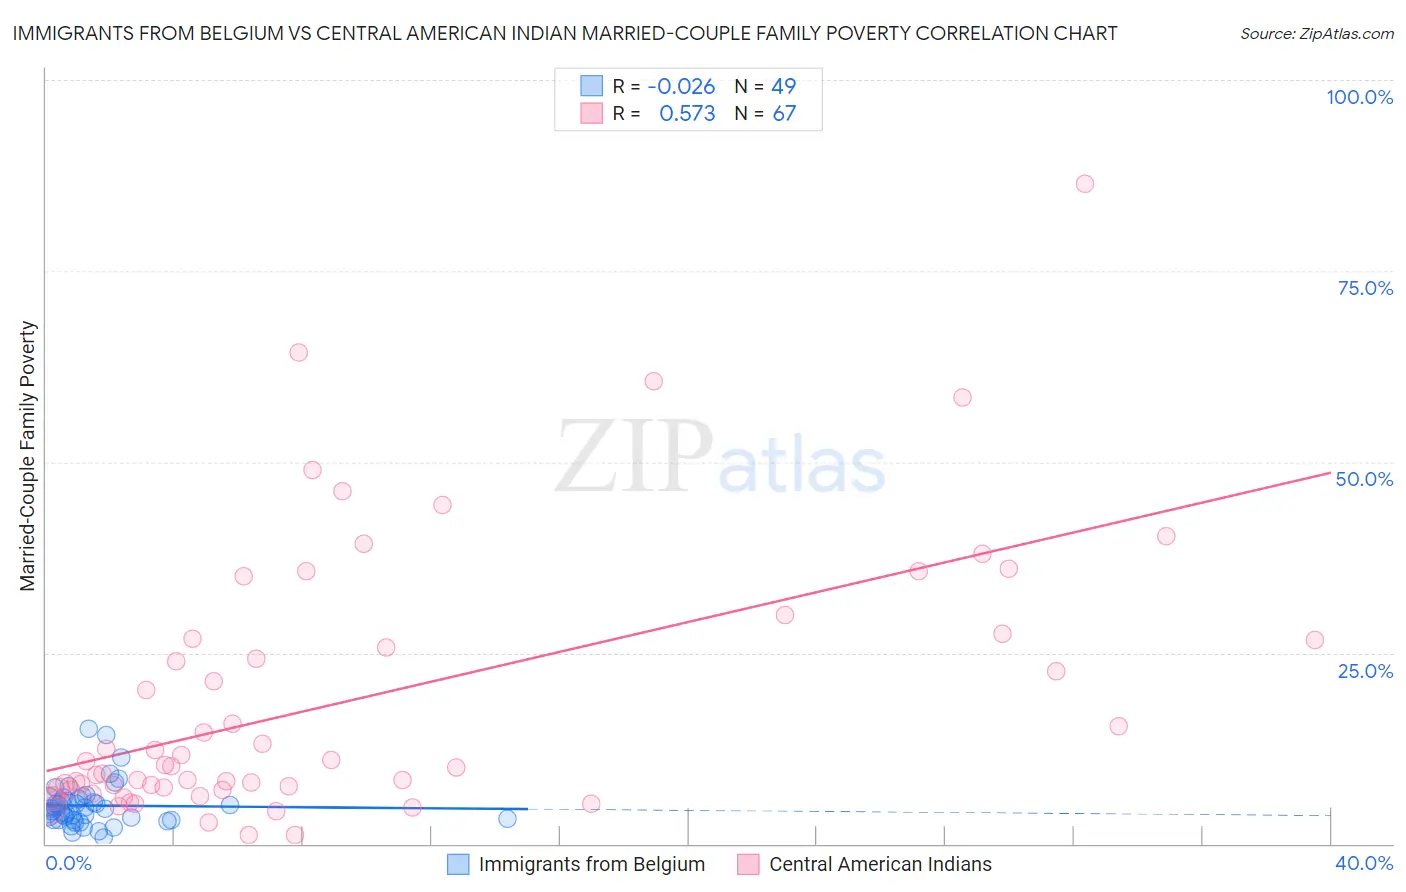
Immigrants from Belgium vs Central American Indian Married-Couple Family Poverty Correlation Chart
The statistical analysis conducted on geographies consisting of 146,091,061 people shows no correlation between the proportion of Immigrants from Belgium and poverty level among married-couple families in the United States with a correlation coefficient (R) of -0.026 and weighted average of 4.6%. Similarly, the statistical analysis conducted on geographies consisting of 324,694,241 people shows a substantial positive correlation between the proportion of Central American Indians and poverty level among married-couple families in the United States with a correlation coefficient (R) of 0.573 and weighted average of 8.3%, a difference of 80.0%.
Married-Couple Family Poverty Correlation Summary
| Measurement | Immigrants from Belgium | Central American Indian |
| Minimum | 0.74% | 1.2% |
| Maximum | 15.0% | 86.5% |
| Range | 14.3% | 85.3% |
| Mean | 5.0% | 18.9% |
| Median | 4.6% | 10.3% |
| Interquartile 25% (IQ1) | 3.1% | 7.2% |
| Interquartile 75% (IQ3) | 5.7% | 26.8% |
| Interquartile Range (IQR) | 2.6% | 19.6% |
| Standard Deviation (Sample) | 2.9% | 17.6% |
| Standard Deviation (Population) | 2.8% | 17.5% |
Similar Demographics by Married-Couple Family Poverty
Demographics Similar to Immigrants from Belgium by Married-Couple Family Poverty
In terms of married-couple family poverty, the demographic groups most similar to Immigrants from Belgium are Immigrants from Poland (4.6%, a difference of 0.050%), Portuguese (4.6%, a difference of 0.13%), Immigrants from Italy (4.6%, a difference of 0.17%), Korean (4.6%, a difference of 0.22%), and Immigrants from Norway (4.6%, a difference of 0.40%).
| Demographics | Rating | Rank | Married-Couple Family Poverty |
| Immigrants | Switzerland | 98.5 /100 | #90 | Exceptional 4.6% |
| Basques | 98.5 /100 | #91 | Exceptional 4.6% |
| Immigrants | Norway | 98.4 /100 | #92 | Exceptional 4.6% |
| Koreans | 98.3 /100 | #93 | Exceptional 4.6% |
| Immigrants | Italy | 98.3 /100 | #94 | Exceptional 4.6% |
| Portuguese | 98.3 /100 | #95 | Exceptional 4.6% |
| Immigrants | Poland | 98.3 /100 | #96 | Exceptional 4.6% |
| Immigrants | Belgium | 98.2 /100 | #97 | Exceptional 4.6% |
| Native Hawaiians | 98.0 /100 | #98 | Exceptional 4.6% |
| Immigrants | Europe | 97.9 /100 | #99 | Exceptional 4.6% |
| Immigrants | Western Europe | 97.9 /100 | #100 | Exceptional 4.6% |
| Yugoslavians | 97.8 /100 | #101 | Exceptional 4.6% |
| Asians | 97.6 /100 | #102 | Exceptional 4.7% |
| Immigrants | Romania | 97.3 /100 | #103 | Exceptional 4.7% |
| Immigrants | Moldova | 97.1 /100 | #104 | Exceptional 4.7% |
Demographics Similar to Central American Indians by Married-Couple Family Poverty
In terms of married-couple family poverty, the demographic groups most similar to Central American Indians are Paiute (8.3%, a difference of 0.060%), Dominican (8.3%, a difference of 0.060%), Lumbee (8.3%, a difference of 0.53%), Immigrants from Dominican Republic (8.4%, a difference of 1.2%), and Native/Alaskan (8.2%, a difference of 1.3%).
| Demographics | Rating | Rank | Married-Couple Family Poverty |
| Immigrants | Central America | 0.0 /100 | #324 | Tragic 7.4% |
| Immigrants | Cuba | 0.0 /100 | #325 | Tragic 7.5% |
| Immigrants | Bangladesh | 0.0 /100 | #326 | Tragic 7.5% |
| Hispanics or Latinos | 0.0 /100 | #327 | Tragic 7.5% |
| Immigrants | Mexico | 0.0 /100 | #328 | Tragic 7.6% |
| Natives/Alaskans | 0.0 /100 | #329 | Tragic 8.2% |
| Paiute | 0.0 /100 | #330 | Tragic 8.3% |
| Central American Indians | 0.0 /100 | #331 | Tragic 8.3% |
| Dominicans | 0.0 /100 | #332 | Tragic 8.3% |
| Lumbee | 0.0 /100 | #333 | Tragic 8.3% |
| Immigrants | Dominican Republic | 0.0 /100 | #334 | Tragic 8.4% |
| Sioux | 0.0 /100 | #335 | Tragic 8.7% |
| Apache | 0.0 /100 | #336 | Tragic 9.0% |
| Yakama | 0.0 /100 | #337 | Tragic 9.0% |
| Cheyenne | 0.0 /100 | #338 | Tragic 9.4% |