Immigrants from Belgium vs Immigrants from Thailand Married-Couple Family Poverty
COMPARE
Immigrants from Belgium
Immigrants from Thailand
Married-Couple Family Poverty
Married-Couple Family Poverty Comparison
Immigrants from Belgium
Immigrants from Thailand
4.6%
MARRIED-COUPLE FAMILY POVERTY
98.2/ 100
METRIC RATING
97th/ 347
METRIC RANK
5.5%
MARRIED-COUPLE FAMILY POVERTY
14.0/ 100
METRIC RATING
212th/ 347
METRIC RANK
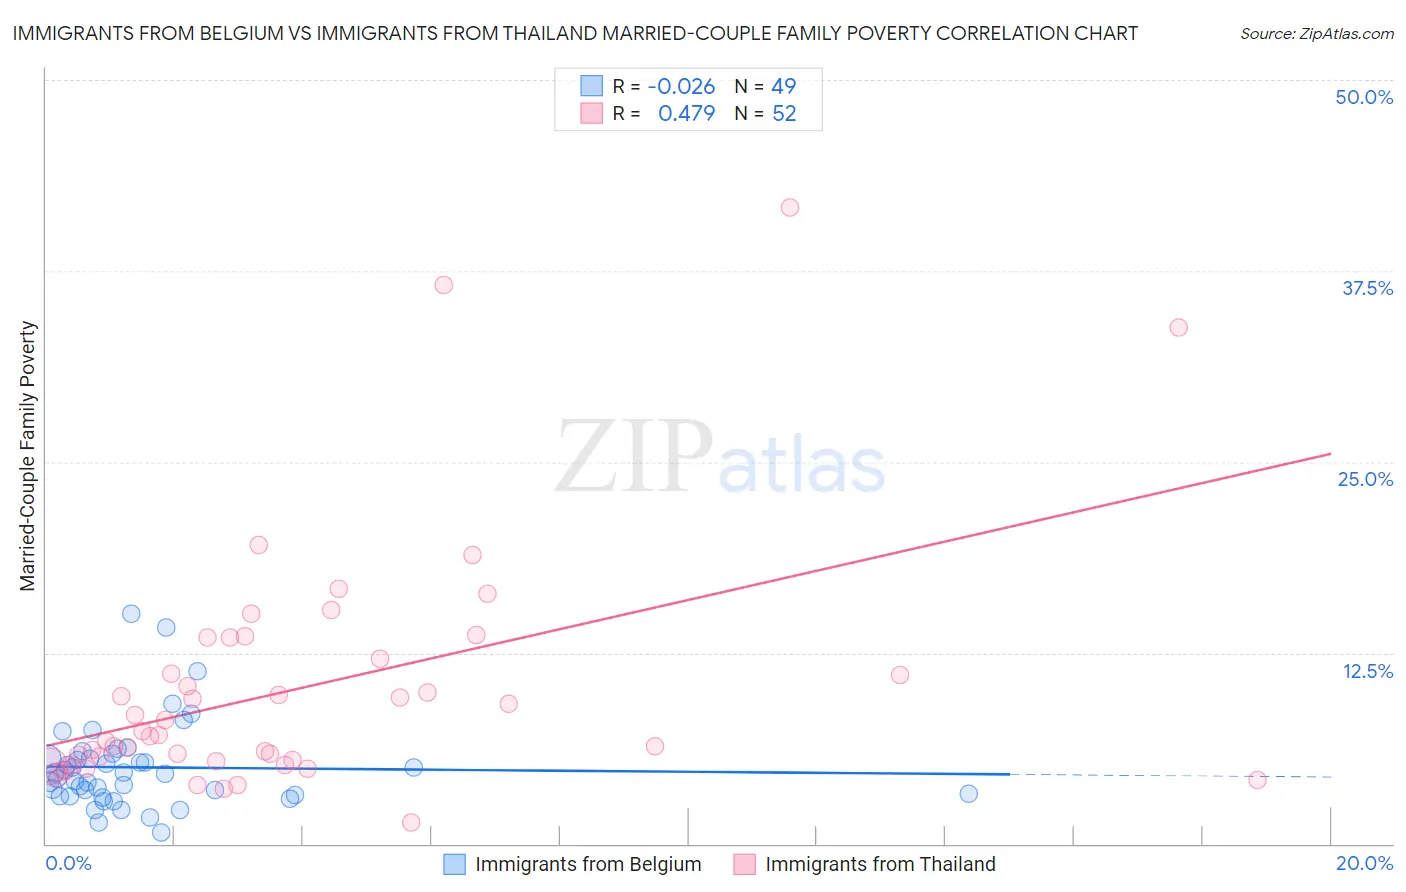
Immigrants from Belgium vs Immigrants from Thailand Married-Couple Family Poverty Correlation Chart
The statistical analysis conducted on geographies consisting of 146,091,061 people shows no correlation between the proportion of Immigrants from Belgium and poverty level among married-couple families in the United States with a correlation coefficient (R) of -0.026 and weighted average of 4.6%. Similarly, the statistical analysis conducted on geographies consisting of 315,183,540 people shows a moderate positive correlation between the proportion of Immigrants from Thailand and poverty level among married-couple families in the United States with a correlation coefficient (R) of 0.479 and weighted average of 5.5%, a difference of 19.2%.
Married-Couple Family Poverty Correlation Summary
| Measurement | Immigrants from Belgium | Immigrants from Thailand |
| Minimum | 0.74% | 1.4% |
| Maximum | 15.0% | 41.7% |
| Range | 14.3% | 40.3% |
| Mean | 5.0% | 10.2% |
| Median | 4.6% | 7.2% |
| Interquartile 25% (IQ1) | 3.1% | 5.5% |
| Interquartile 75% (IQ3) | 5.7% | 12.8% |
| Interquartile Range (IQR) | 2.6% | 7.3% |
| Standard Deviation (Sample) | 2.9% | 8.0% |
| Standard Deviation (Population) | 2.8% | 7.9% |
Similar Demographics by Married-Couple Family Poverty
Demographics Similar to Immigrants from Belgium by Married-Couple Family Poverty
In terms of married-couple family poverty, the demographic groups most similar to Immigrants from Belgium are Immigrants from Poland (4.6%, a difference of 0.050%), Portuguese (4.6%, a difference of 0.13%), Immigrants from Italy (4.6%, a difference of 0.17%), Korean (4.6%, a difference of 0.22%), and Immigrants from Norway (4.6%, a difference of 0.40%).
| Demographics | Rating | Rank | Married-Couple Family Poverty |
| Immigrants | Switzerland | 98.5 /100 | #90 | Exceptional 4.6% |
| Basques | 98.5 /100 | #91 | Exceptional 4.6% |
| Immigrants | Norway | 98.4 /100 | #92 | Exceptional 4.6% |
| Koreans | 98.3 /100 | #93 | Exceptional 4.6% |
| Immigrants | Italy | 98.3 /100 | #94 | Exceptional 4.6% |
| Portuguese | 98.3 /100 | #95 | Exceptional 4.6% |
| Immigrants | Poland | 98.3 /100 | #96 | Exceptional 4.6% |
| Immigrants | Belgium | 98.2 /100 | #97 | Exceptional 4.6% |
| Native Hawaiians | 98.0 /100 | #98 | Exceptional 4.6% |
| Immigrants | Europe | 97.9 /100 | #99 | Exceptional 4.6% |
| Immigrants | Western Europe | 97.9 /100 | #100 | Exceptional 4.6% |
| Yugoslavians | 97.8 /100 | #101 | Exceptional 4.6% |
| Asians | 97.6 /100 | #102 | Exceptional 4.7% |
| Immigrants | Romania | 97.3 /100 | #103 | Exceptional 4.7% |
| Immigrants | Moldova | 97.1 /100 | #104 | Exceptional 4.7% |
Demographics Similar to Immigrants from Thailand by Married-Couple Family Poverty
In terms of married-couple family poverty, the demographic groups most similar to Immigrants from Thailand are Nigerian (5.5%, a difference of 0.070%), Immigrants from Micronesia (5.5%, a difference of 0.090%), Immigrants from Liberia (5.5%, a difference of 0.18%), Iroquois (5.5%, a difference of 0.22%), and Armenian (5.5%, a difference of 0.29%).
| Demographics | Rating | Rank | Married-Couple Family Poverty |
| Chippewa | 18.9 /100 | #205 | Poor 5.4% |
| Osage | 18.4 /100 | #206 | Poor 5.4% |
| Immigrants | Africa | 17.6 /100 | #207 | Poor 5.5% |
| French American Indians | 16.1 /100 | #208 | Poor 5.5% |
| Immigrants | Syria | 15.4 /100 | #209 | Poor 5.5% |
| Immigrants | Micronesia | 14.4 /100 | #210 | Poor 5.5% |
| Nigerians | 14.3 /100 | #211 | Poor 5.5% |
| Immigrants | Thailand | 14.0 /100 | #212 | Poor 5.5% |
| Immigrants | Liberia | 13.3 /100 | #213 | Poor 5.5% |
| Iroquois | 13.1 /100 | #214 | Poor 5.5% |
| Armenians | 12.8 /100 | #215 | Poor 5.5% |
| Potawatomi | 12.4 /100 | #216 | Poor 5.5% |
| Immigrants | Nigeria | 11.3 /100 | #217 | Poor 5.5% |
| Afghans | 11.2 /100 | #218 | Poor 5.5% |
| Japanese | 9.8 /100 | #219 | Tragic 5.6% |