Immigrants from Asia Married-couple Households
COMPARE
Immigrants from Asia
Select to Compare
Married-couple Households
Immigrants from Asia Married-couple Households
49.1%
MARRIED-COUPLE HOUSEHOLDS
99.7/ 100
METRIC RATING
33rd/ 347
METRIC RANK
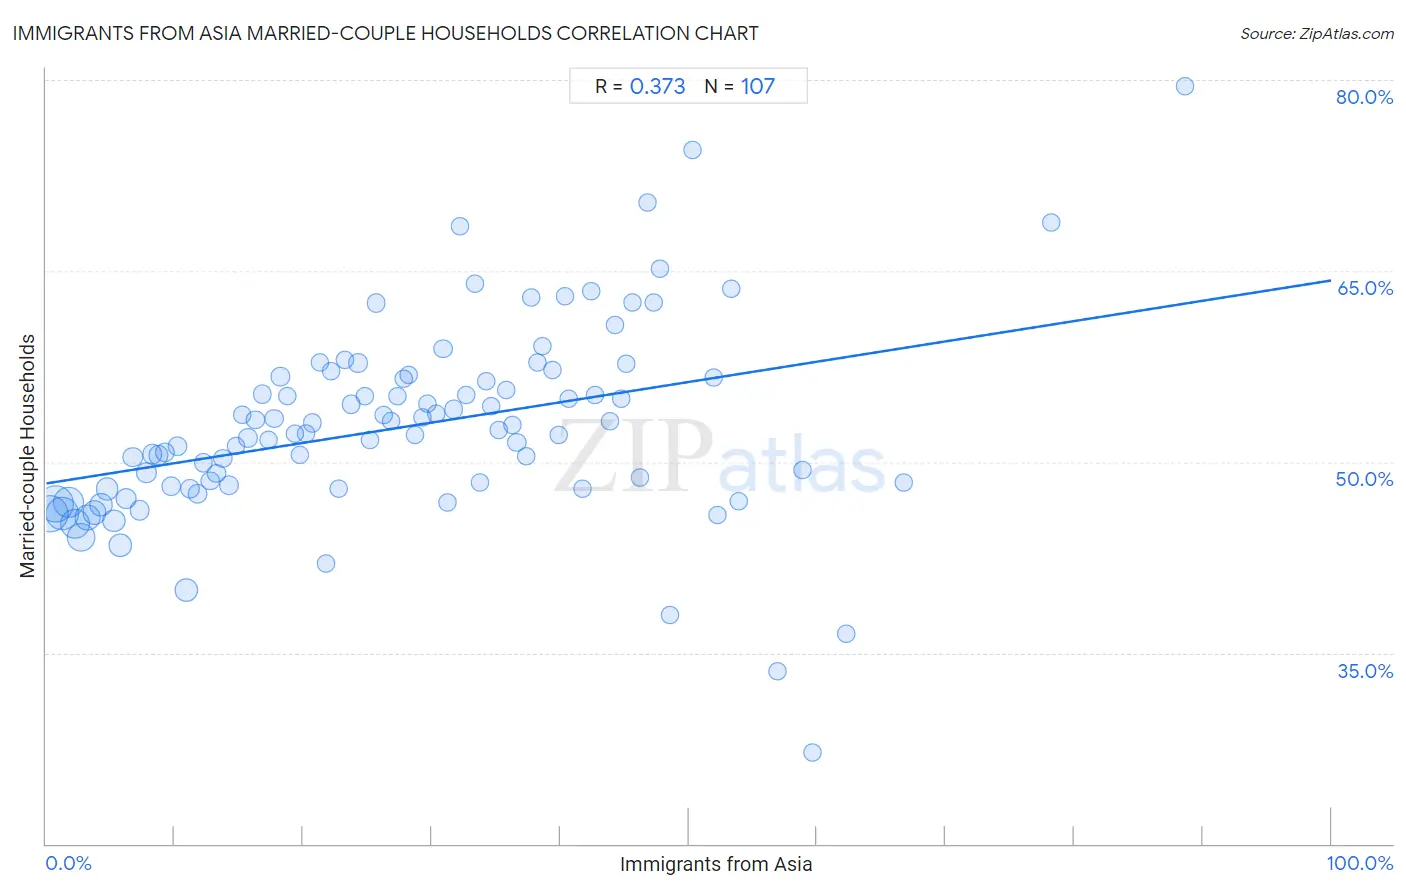
Immigrants from Asia Married-couple Households Correlation Chart
The statistical analysis conducted on geographies consisting of 548,508,948 people shows a mild positive correlation between the proportion of Immigrants from Asia and percentage of married-couple family households in the United States with a correlation coefficient (R) of 0.373 and weighted average of 49.1%. On average, for every 1% (one percent) increase in Immigrants from Asia within a typical geography, there is an increase of 0.16% in percentage of married-couple family households.
It is essential to understand that the correlation between the percentage of Immigrants from Asia and percentage of married-couple family households does not imply a direct cause-and-effect relationship. It remains uncertain whether the presence of Immigrants from Asia influences an upward or downward trend in the level of percentage of married-couple family households within an area, or if Immigrants from Asia simply ended up residing in those areas with higher or lower levels of percentage of married-couple family households due to other factors.
Demographics Similar to Immigrants from Asia by Married-couple Households
In terms of married-couple households, the demographic groups most similar to Immigrants from Asia are Hungarian (49.1%, a difference of 0.030%), Italian (49.0%, a difference of 0.080%), Native Hawaiian (49.1%, a difference of 0.090%), Scottish (49.0%, a difference of 0.10%), and Iranian (49.0%, a difference of 0.19%).
| Demographics | Rating | Rank | Married-couple Households |
| Immigrants from Scotland | 99.8 /100 | #26 | Exceptional 49.3% |
| Bhutanese | 99.8 /100 | #27 | Exceptional 49.3% |
| Germans | 99.8 /100 | #28 | Exceptional 49.2% |
| Maltese | 99.8 /100 | #29 | Exceptional 49.2% |
| Bolivians | 99.8 /100 | #30 | Exceptional 49.2% |
| Native Hawaiians | 99.8 /100 | #31 | Exceptional 49.1% |
| Hungarians | 99.8 /100 | #32 | Exceptional 49.1% |
| Immigrants from Asia | 99.7 /100 | #33 | Exceptional 49.1% |
| Italians | 99.7 /100 | #34 | Exceptional 49.0% |
| Scottish | 99.7 /100 | #35 | Exceptional 49.0% |
| Iranians | 99.7 /100 | #36 | Exceptional 49.0% |
| Sri Lankans | 99.7 /100 | #37 | Exceptional 49.0% |
| Greeks | 99.7 /100 | #38 | Exceptional 48.9% |
| Lithuanians | 99.6 /100 | #39 | Exceptional 48.9% |
| Immigrants from Bolivia | 99.6 /100 | #40 | Exceptional 48.9% |
Immigrants from Asia Married-couple Households Correlation Summary
| Measurement | Immigrants from Asia Data | Married-couple Households Data |
| Minimum | 0.26% | 27.1% |
| Maximum | 88.7% | 79.5% |
| Range | 88.4% | 52.3% |
| Mean | 28.0% | 52.8% |
| Median | 26.8% | 52.2% |
| Interquartile 25% (IQ1) | 13.2% | 47.9% |
| Interquartile 75% (IQ3) | 40.4% | 56.6% |
| Interquartile Range (IQR) | 27.1% | 8.7% |
| Standard Deviation (Sample) | 18.1% | 7.7% |
| Standard Deviation (Population) | 18.0% | 7.7% |
Correlation Details
| Immigrants from Asia Percentile | Sample Size | Married-couple Households |
[ 0.0% - 0.5% ] 0.26% | 65,576,838 | 46.0% |
[ 0.5% - 1.0% ] 0.74% | 64,680,860 | 46.7% |
[ 1.0% - 1.5% ] 1.24% | 54,126,288 | 45.9% |
[ 1.5% - 2.0% ] 1.74% | 45,001,031 | 46.8% |
[ 2.0% - 2.5% ] 2.24% | 38,801,490 | 45.1% |
[ 2.5% - 3.0% ] 2.73% | 36,032,785 | 44.1% |
[ 3.0% - 3.5% ] 3.23% | 26,101,619 | 45.7% |
[ 3.5% - 4.0% ] 3.75% | 21,245,616 | 46.0% |
[ 4.0% - 4.5% ] 4.25% | 19,100,640 | 46.7% |
[ 4.5% - 5.0% ] 4.75% | 15,677,664 | 47.8% |
[ 5.0% - 5.5% ] 5.24% | 16,285,462 | 45.4% |
[ 5.5% - 6.0% ] 5.74% | 15,563,185 | 43.5% |
[ 6.0% - 6.5% ] 6.25% | 9,513,898 | 47.1% |
[ 6.5% - 7.0% ] 6.75% | 6,869,016 | 50.4% |
[ 7.0% - 7.5% ] 7.29% | 6,934,748 | 46.2% |
[ 7.5% - 8.0% ] 7.77% | 7,408,270 | 49.1% |
[ 8.0% - 8.5% ] 8.27% | 5,875,850 | 50.6% |
[ 8.5% - 9.0% ] 8.73% | 6,590,805 | 50.5% |
[ 9.0% - 9.5% ] 9.22% | 4,804,032 | 50.7% |
[ 9.5% - 10.0% ] 9.74% | 4,419,502 | 48.1% |
[ 10.0% - 10.5% ] 10.23% | 4,473,674 | 51.2% |
[ 10.5% - 11.0% ] 10.88% | 16,903,329 | 39.9% |
[ 11.0% - 11.5% ] 11.23% | 4,178,374 | 47.9% |
[ 11.5% - 12.0% ] 11.76% | 4,084,684 | 47.4% |
[ 12.0% - 12.5% ] 12.22% | 2,409,886 | 49.9% |
[ 12.5% - 13.0% ] 12.78% | 2,628,848 | 48.5% |
[ 13.0% - 13.5% ] 13.24% | 2,262,134 | 49.1% |
[ 13.5% - 14.0% ] 13.73% | 2,008,014 | 50.3% |
[ 14.0% - 14.5% ] 14.24% | 2,626,723 | 48.2% |
[ 14.5% - 15.0% ] 14.76% | 1,838,493 | 51.3% |
[ 15.0% - 15.5% ] 15.26% | 1,761,595 | 53.7% |
[ 15.5% - 16.0% ] 15.71% | 1,140,203 | 51.9% |
[ 16.0% - 16.5% ] 16.29% | 1,303,656 | 53.3% |
[ 16.5% - 17.0% ] 16.81% | 1,426,057 | 55.3% |
[ 17.0% - 17.5% ] 17.27% | 1,335,979 | 51.7% |
[ 17.5% - 18.0% ] 17.74% | 1,570,617 | 53.4% |
[ 18.0% - 18.5% ] 18.24% | 1,628,861 | 56.7% |
[ 18.5% - 19.0% ] 18.74% | 1,374,619 | 55.2% |
[ 19.0% - 19.5% ] 19.34% | 939,134 | 52.2% |
[ 19.5% - 20.0% ] 19.73% | 864,060 | 50.5% |
[ 20.0% - 20.5% ] 20.19% | 1,266,061 | 52.2% |
[ 20.5% - 21.0% ] 20.71% | 1,289,829 | 53.1% |
[ 21.0% - 21.5% ] 21.27% | 603,153 | 57.8% |
[ 21.5% - 22.0% ] 21.80% | 1,625,576 | 42.0% |
[ 22.0% - 22.5% ] 22.21% | 599,892 | 57.1% |
[ 22.5% - 23.0% ] 22.75% | 740,470 | 47.9% |
[ 23.0% - 23.5% ] 23.23% | 653,987 | 58.1% |
[ 23.5% - 24.0% ] 23.75% | 695,257 | 54.5% |
[ 24.0% - 24.5% ] 24.26% | 718,884 | 57.8% |
[ 24.5% - 25.0% ] 24.79% | 920,797 | 55.2% |
[ 25.0% - 25.5% ] 25.17% | 151,639 | 51.8% |
[ 25.5% - 26.0% ] 25.71% | 687,253 | 62.5% |
[ 26.0% - 26.5% ] 26.26% | 453,893 | 53.7% |
[ 26.5% - 27.0% ] 26.83% | 1,266,078 | 53.2% |
[ 27.0% - 27.5% ] 27.30% | 477,891 | 55.1% |
[ 27.5% - 28.0% ] 27.83% | 87,044 | 56.6% |
[ 28.0% - 28.5% ] 28.22% | 540,342 | 56.8% |
[ 28.5% - 29.0% ] 28.72% | 261,052 | 52.1% |
[ 29.0% - 29.5% ] 29.28% | 368,296 | 53.5% |
[ 29.5% - 30.0% ] 29.68% | 710,826 | 54.6% |
[ 30.0% - 30.5% ] 30.34% | 318,528 | 53.8% |
[ 30.5% - 31.0% ] 30.88% | 309,738 | 58.9% |
[ 31.0% - 31.5% ] 31.22% | 171,675 | 46.8% |
[ 31.5% - 32.0% ] 31.71% | 488,550 | 54.1% |
[ 32.0% - 32.5% ] 32.24% | 125,880 | 68.6% |
[ 32.5% - 33.0% ] 32.72% | 251,495 | 55.2% |
[ 33.0% - 33.5% ] 33.34% | 227,159 | 64.0% |
[ 33.5% - 34.0% ] 33.72% | 149,933 | 48.4% |
[ 34.0% - 34.5% ] 34.20% | 171,820 | 56.3% |
[ 34.5% - 35.0% ] 34.66% | 356,115 | 54.4% |
[ 35.0% - 35.5% ] 35.17% | 171,322 | 52.5% |
[ 35.5% - 36.0% ] 35.77% | 191,381 | 55.7% |
[ 36.0% - 36.5% ] 36.31% | 306,683 | 52.9% |
[ 36.5% - 37.0% ] 36.62% | 231,114 | 51.5% |
[ 37.0% - 37.5% ] 37.34% | 70,767 | 50.5% |
[ 37.5% - 38.0% ] 37.78% | 99,712 | 62.9% |
[ 38.0% - 38.5% ] 38.20% | 328,554 | 57.8% |
[ 38.5% - 39.0% ] 38.64% | 505,027 | 59.1% |
[ 39.0% - 39.5% ] 39.36% | 226,050 | 57.2% |
[ 39.5% - 40.0% ] 39.87% | 276,472 | 52.1% |
[ 40.0% - 40.5% ] 40.35% | 67,577 | 63.0% |
[ 40.5% - 41.0% ] 40.69% | 109,364 | 55.0% |
[ 41.5% - 42.0% ] 41.74% | 63,360 | 47.9% |
[ 42.0% - 42.5% ] 42.38% | 342,913 | 63.4% |
[ 42.5% - 43.0% ] 42.74% | 173,120 | 55.2% |
[ 43.5% - 44.0% ] 43.89% | 139,016 | 53.2% |
[ 44.0% - 44.5% ] 44.23% | 140,768 | 60.8% |
[ 44.5% - 45.0% ] 44.79% | 127,809 | 54.9% |
[ 45.0% - 45.5% ] 45.11% | 21,250 | 57.7% |
[ 45.5% - 46.0% ] 45.62% | 66,590 | 62.6% |
[ 46.0% - 46.5% ] 46.17% | 40,462 | 48.7% |
[ 46.5% - 47.0% ] 46.76% | 53,256 | 70.4% |
[ 47.0% - 47.5% ] 47.26% | 109,289 | 62.5% |
[ 47.5% - 48.0% ] 47.75% | 321,759 | 65.1% |
[ 48.5% - 49.0% ] 48.54% | 14,371 | 38.0% |
[ 50.0% - 50.5% ] 50.31% | 57,649 | 74.5% |
[ 51.5% - 52.0% ] 51.97% | 26,418 | 56.6% |
[ 52.0% - 52.5% ] 52.22% | 30,916 | 45.8% |
[ 53.0% - 53.5% ] 53.35% | 954 | 63.6% |
[ 53.5% - 54.0% ] 53.91% | 53,371 | 46.9% |
[ 56.5% - 57.0% ] 56.92% | 766 | 33.6% |
[ 58.5% - 59.0% ] 58.82% | 79,495 | 49.4% |
[ 59.5% - 60.0% ] 59.64% | 223 | 27.1% |
[ 62.0% - 62.5% ] 62.26% | 106 | 36.5% |
[ 66.5% - 67.0% ] 66.69% | 2,996 | 48.3% |
[ 78.0% - 78.5% ] 78.18% | 275 | 68.8% |
[ 88.5% - 89.0% ] 88.65% | 141 | 79.5% |