Immigrants from Asia Disability
COMPARE
Immigrants from Asia
Select to Compare
Disability
Immigrants from Asia Disability
10.5%
DISABILITY
100.0/ 100
METRIC RATING
23rd/ 347
METRIC RANK
Immigrants from Asia Disability Correlation Chart
The statistical analysis conducted on geographies consisting of 549,063,947 people shows a poor positive correlation between the proportion of Immigrants from Asia and percentage of population with a disability in the United States with a correlation coefficient (R) of 0.164 and weighted average of 10.5%. On average, for every 1% (one percent) increase in Immigrants from Asia within a typical geography, there is an increase of 0.041% in percentage of population with a disability.
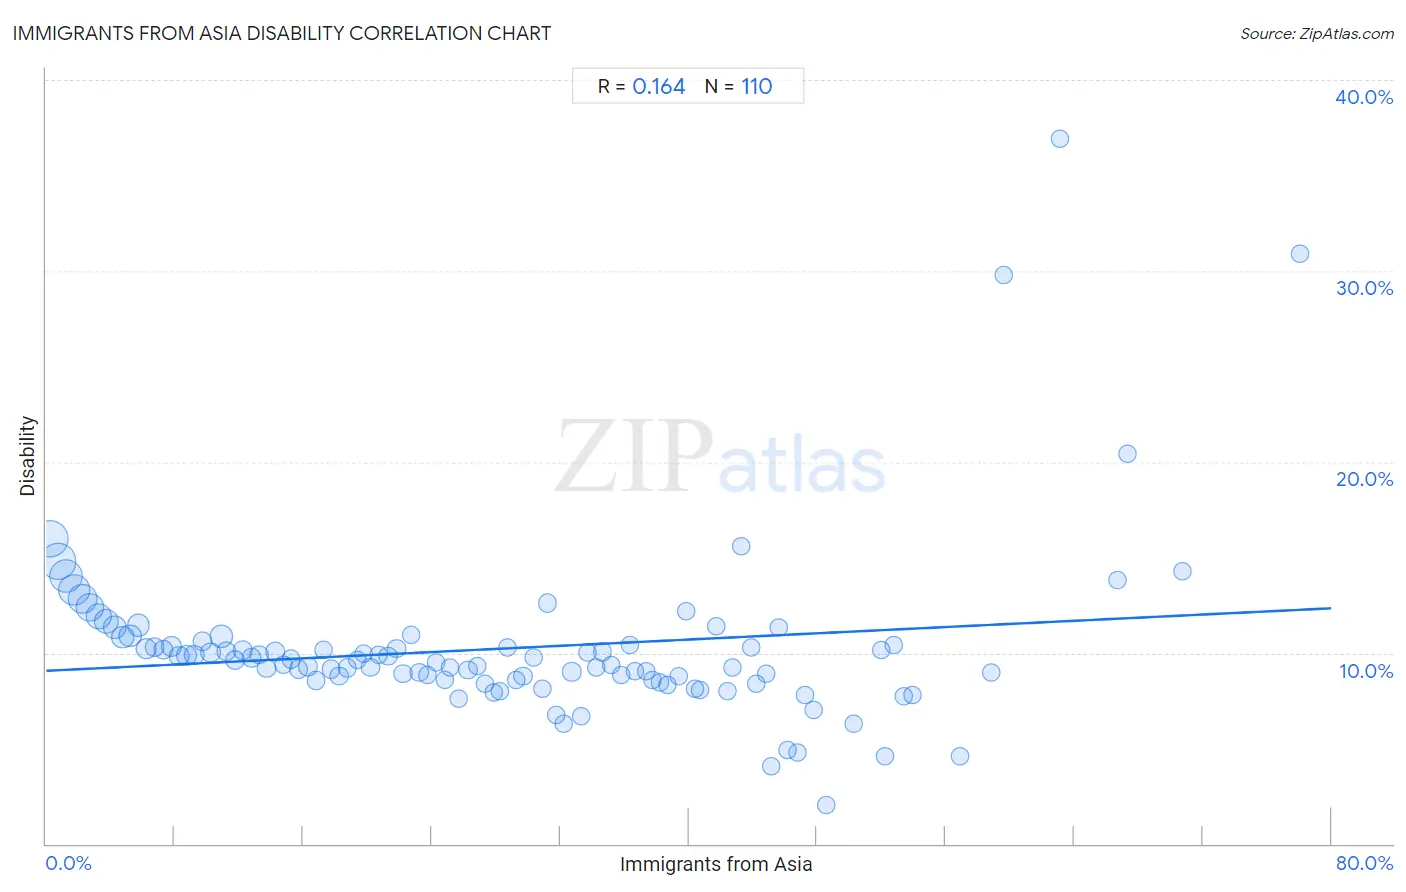
It is essential to understand that the correlation between the percentage of Immigrants from Asia and percentage of population with a disability does not imply a direct cause-and-effect relationship. It remains uncertain whether the presence of Immigrants from Asia influences an upward or downward trend in the level of percentage of population with a disability within an area, or if Immigrants from Asia simply ended up residing in those areas with higher or lower levels of percentage of population with a disability due to other factors.
Demographics Similar to Immigrants from Asia by Disability
In terms of disability, the demographic groups most similar to Immigrants from Asia are Venezuelan (10.5%, a difference of 0.14%), Immigrants from Malaysia (10.6%, a difference of 0.52%), Argentinean (10.6%, a difference of 0.57%), Cypriot (10.6%, a difference of 0.58%), and Immigrants from Sri Lanka (10.5%, a difference of 0.69%).
| Demographics | Rating | Rank | Disability |
| Indians (Asian) | 100.0 /100 | #16 | Exceptional 10.3% |
| Immigrants from Iran | 100.0 /100 | #17 | Exceptional 10.3% |
| Burmese | 100.0 /100 | #18 | Exceptional 10.4% |
| Immigrants from Pakistan | 100.0 /100 | #19 | Exceptional 10.4% |
| Immigrants from Venezuela | 100.0 /100 | #20 | Exceptional 10.4% |
| Asians | 100.0 /100 | #21 | Exceptional 10.4% |
| Immigrants from Sri Lanka | 100.0 /100 | #22 | Exceptional 10.5% |
| Immigrants from Asia | 100.0 /100 | #23 | Exceptional 10.5% |
| Venezuelans | 100.0 /100 | #24 | Exceptional 10.5% |
| Immigrants from Malaysia | 100.0 /100 | #25 | Exceptional 10.6% |
| Argentineans | 100.0 /100 | #26 | Exceptional 10.6% |
| Cypriots | 100.0 /100 | #27 | Exceptional 10.6% |
| Egyptians | 100.0 /100 | #28 | Exceptional 10.6% |
| Immigrants from Argentina | 100.0 /100 | #29 | Exceptional 10.6% |
| Immigrants from Turkey | 100.0 /100 | #30 | Exceptional 10.6% |
Immigrants from Asia Disability Correlation Summary
| Measurement | Immigrants from Asia Data | Disability Data |
| Minimum | 0.26% | 2.0% |
| Maximum | 78.1% | 36.9% |
| Range | 77.8% | 34.9% |
| Mean | 28.6% | 10.2% |
| Median | 27.6% | 9.6% |
| Interquartile 25% (IQ1) | 13.7% | 8.6% |
| Interquartile 75% (IQ3) | 41.7% | 10.4% |
| Interquartile Range (IQR) | 28.0% | 1.8% |
| Standard Deviation (Sample) | 18.0% | 4.5% |
| Standard Deviation (Population) | 17.9% | 4.5% |
Correlation Details
| Immigrants from Asia Percentile | Sample Size | Disability |
[ 0.0% - 0.5% ] 0.26% | 65,617,029 | 16.0% |
[ 0.5% - 1.0% ] 0.74% | 64,727,095 | 14.8% |
[ 1.0% - 1.5% ] 1.24% | 54,185,976 | 14.0% |
[ 1.5% - 2.0% ] 1.74% | 45,043,080 | 13.3% |
[ 2.0% - 2.5% ] 2.24% | 38,821,779 | 12.8% |
[ 2.5% - 3.0% ] 2.73% | 36,076,012 | 12.4% |
[ 3.0% - 3.5% ] 3.23% | 26,168,879 | 11.9% |
[ 3.5% - 4.0% ] 3.75% | 21,278,412 | 11.6% |
[ 4.0% - 4.5% ] 4.25% | 19,128,548 | 11.4% |
[ 4.5% - 5.0% ] 4.75% | 15,689,991 | 10.8% |
[ 5.0% - 5.5% ] 5.24% | 16,295,028 | 10.9% |
[ 5.5% - 6.0% ] 5.74% | 15,574,112 | 11.5% |
[ 6.0% - 6.5% ] 6.25% | 9,527,603 | 10.2% |
[ 6.5% - 7.0% ] 6.75% | 6,898,997 | 10.3% |
[ 7.0% - 7.5% ] 7.29% | 6,945,161 | 10.2% |
[ 7.5% - 8.0% ] 7.77% | 7,416,678 | 10.3% |
[ 8.0% - 8.5% ] 8.27% | 5,889,136 | 9.8% |
[ 8.5% - 9.0% ] 8.73% | 6,600,461 | 9.9% |
[ 9.0% - 9.5% ] 9.22% | 4,814,311 | 9.9% |
[ 9.5% - 10.0% ] 9.74% | 4,433,820 | 10.6% |
[ 10.0% - 10.5% ] 10.23% | 4,478,265 | 10.0% |
[ 10.5% - 11.0% ] 10.88% | 16,904,624 | 10.9% |
[ 11.0% - 11.5% ] 11.23% | 4,178,303 | 10.1% |
[ 11.5% - 12.0% ] 11.76% | 4,084,807 | 9.6% |
[ 12.0% - 12.5% ] 12.22% | 2,416,148 | 10.1% |
[ 12.5% - 13.0% ] 12.78% | 2,629,159 | 9.8% |
[ 13.0% - 13.5% ] 13.24% | 2,265,026 | 9.9% |
[ 13.5% - 14.0% ] 13.73% | 2,010,216 | 9.2% |
[ 14.0% - 14.5% ] 14.24% | 2,626,723 | 10.1% |
[ 14.5% - 15.0% ] 14.76% | 1,838,493 | 9.4% |
[ 15.0% - 15.5% ] 15.26% | 1,764,510 | 9.7% |
[ 15.5% - 16.0% ] 15.71% | 1,140,235 | 9.1% |
[ 16.0% - 16.5% ] 16.29% | 1,305,269 | 9.3% |
[ 16.5% - 17.0% ] 16.81% | 1,426,739 | 8.6% |
[ 17.0% - 17.5% ] 17.27% | 1,337,404 | 10.2% |
[ 17.5% - 18.0% ] 17.74% | 1,570,499 | 9.1% |
[ 18.0% - 18.5% ] 18.24% | 1,629,131 | 8.8% |
[ 18.5% - 19.0% ] 18.74% | 1,374,846 | 9.2% |
[ 19.0% - 19.5% ] 19.34% | 939,010 | 9.6% |
[ 19.5% - 20.0% ] 19.73% | 864,060 | 10.0% |
[ 20.0% - 20.5% ] 20.19% | 1,266,061 | 9.3% |
[ 20.5% - 21.0% ] 20.71% | 1,289,858 | 9.9% |
[ 21.0% - 21.5% ] 21.27% | 611,908 | 9.8% |
[ 21.5% - 22.0% ] 21.80% | 1,625,576 | 10.2% |
[ 22.0% - 22.5% ] 22.21% | 599,892 | 8.9% |
[ 22.5% - 23.0% ] 22.75% | 740,470 | 10.9% |
[ 23.0% - 23.5% ] 23.23% | 653,987 | 9.0% |
[ 23.5% - 24.0% ] 23.75% | 695,257 | 8.8% |
[ 24.0% - 24.5% ] 24.26% | 718,694 | 9.5% |
[ 24.5% - 25.0% ] 24.79% | 920,903 | 8.6% |
[ 25.0% - 25.5% ] 25.17% | 150,997 | 9.2% |
[ 25.5% - 26.0% ] 25.71% | 687,396 | 7.6% |
[ 26.0% - 26.5% ] 26.26% | 453,893 | 9.1% |
[ 26.5% - 27.0% ] 26.83% | 1,266,078 | 9.3% |
[ 27.0% - 27.5% ] 27.30% | 477,891 | 8.4% |
[ 27.5% - 28.0% ] 27.83% | 86,972 | 7.9% |
[ 28.0% - 28.5% ] 28.22% | 540,342 | 8.0% |
[ 28.5% - 29.0% ] 28.72% | 261,052 | 10.3% |
[ 29.0% - 29.5% ] 29.28% | 368,296 | 8.6% |
[ 29.5% - 30.0% ] 29.68% | 710,826 | 8.8% |
[ 30.0% - 30.5% ] 30.34% | 318,528 | 9.8% |
[ 30.5% - 31.0% ] 30.88% | 309,546 | 8.1% |
[ 31.0% - 31.5% ] 31.22% | 171,675 | 12.6% |
[ 31.5% - 32.0% ] 31.71% | 488,550 | 6.7% |
[ 32.0% - 32.5% ] 32.24% | 125,570 | 6.3% |
[ 32.5% - 33.0% ] 32.72% | 251,166 | 9.0% |
[ 33.0% - 33.5% ] 33.34% | 227,159 | 6.7% |
[ 33.5% - 34.0% ] 33.72% | 149,933 | 10.0% |
[ 34.0% - 34.5% ] 34.20% | 171,820 | 9.2% |
[ 34.5% - 35.0% ] 34.66% | 356,115 | 10.1% |
[ 35.0% - 35.5% ] 35.17% | 171,322 | 9.3% |
[ 35.5% - 36.0% ] 35.77% | 191,381 | 8.8% |
[ 36.0% - 36.5% ] 36.31% | 306,683 | 10.4% |
[ 36.5% - 37.0% ] 36.62% | 231,114 | 9.0% |
[ 37.0% - 37.5% ] 37.34% | 70,767 | 9.1% |
[ 37.5% - 38.0% ] 37.78% | 99,712 | 8.6% |
[ 38.0% - 38.5% ] 38.20% | 328,554 | 8.5% |
[ 38.5% - 39.0% ] 38.64% | 505,027 | 8.3% |
[ 39.0% - 39.5% ] 39.36% | 225,902 | 8.8% |
[ 39.5% - 40.0% ] 39.87% | 276,472 | 12.2% |
[ 40.0% - 40.5% ] 40.35% | 67,577 | 8.1% |
[ 40.5% - 41.0% ] 40.69% | 109,337 | 8.0% |
[ 41.5% - 42.0% ] 41.74% | 63,360 | 11.4% |
[ 42.0% - 42.5% ] 42.38% | 342,913 | 8.0% |
[ 42.5% - 43.0% ] 42.74% | 173,120 | 9.2% |
[ 43.0% - 43.5% ] 43.29% | 328 | 15.5% |
[ 43.5% - 44.0% ] 43.89% | 139,016 | 10.3% |
[ 44.0% - 44.5% ] 44.23% | 140,768 | 8.4% |
[ 44.5% - 45.0% ] 44.79% | 127,809 | 8.9% |
[ 45.0% - 45.5% ] 45.11% | 21,250 | 4.1% |
[ 45.5% - 46.0% ] 45.62% | 66,590 | 11.3% |
[ 46.0% - 46.5% ] 46.17% | 40,462 | 4.9% |
[ 46.5% - 47.0% ] 46.76% | 53,256 | 4.8% |
[ 47.0% - 47.5% ] 47.26% | 109,289 | 7.8% |
[ 47.5% - 48.0% ] 47.75% | 321,759 | 7.0% |
[ 48.5% - 49.0% ] 48.54% | 14,371 | 2.0% |
[ 50.0% - 50.5% ] 50.31% | 57,649 | 6.3% |
[ 51.5% - 52.0% ] 51.97% | 26,418 | 10.1% |
[ 52.0% - 52.5% ] 52.22% | 31,383 | 4.6% |
[ 52.5% - 53.0% ] 52.78% | 144 | 10.4% |
[ 53.0% - 53.5% ] 53.35% | 954 | 7.8% |
[ 53.5% - 54.0% ] 53.91% | 53,371 | 7.8% |
[ 56.5% - 57.0% ] 56.92% | 766 | 4.6% |
[ 58.5% - 59.0% ] 58.82% | 79,495 | 9.0% |
[ 59.5% - 60.0% ] 59.57% | 188 | 29.8% |
[ 63.0% - 63.5% ] 63.10% | 84 | 36.9% |
[ 66.5% - 67.0% ] 66.69% | 2,996 | 13.8% |
[ 67.0% - 67.5% ] 67.35% | 49 | 20.4% |
[ 70.5% - 71.0% ] 70.75% | 147 | 14.3% |
[ 78.0% - 78.5% ] 78.09% | 178 | 30.9% |