Dutch West Indian 3 or more Vehicles in Household

COMPARE

Dutch West Indian
Race
Ancestry
AfghanAfricanAlaska NativeAlaskan AthabascanAlbanianAleutAlsatianAmericanApacheArabArapahoArgentineanArmenianAssyrian/Chaldean/SyriacAustralianAustrianBahamianBangladeshiBarbadianBasqueBelgianBelizeanBermudanBhutaneseBlackfeetBolivianBrazilianBritishBritish West IndianBulgarianBurmeseCajunCambodianCanadianCape VerdeanCarpatho RusynCelticCentral AmericanCentral American IndianCherokeeCheyenneChickasawChileanChineseChippewaChoctawColombianColvilleComancheCosta RicanCreeCreekCroatianCrowCubanCypriotCzechCzechoslovakianDanishDelawareDominicanDutchDutch West IndianEastern EuropeanEcuadorianEgyptianEnglishEstonianEthiopianEuropeanFijianFilipinoFinnishFrenchFrench American IndianFrench CanadianGermanGerman RussianGhanaianGreekGuamanian/ChamorroGuatemalanGuyaneseHaitianHmongHonduranHopiHoumaHungarianIcelanderIndian (Asian)IndonesianInupiatIranianIraqiIrishIroquoisIsraeliItalianJamaicanJapaneseJordanianKenyanKiowaKoreanLaotianLatvianLebaneseLiberianLithuanianLumbeeLuxembourgerMacedonianMalaysianMalteseMarshalleseMenomineeMexicanMexican American IndianMongolianMoroccanNative HawaiianNavajoNepaleseNew ZealanderNicaraguanNigerianNorthern EuropeanNorwegianOkinawanOsageOttawaPaiutePakistaniPalestinianPanamanianParaguayanPennsylvania GermanPeruvianPimaPolishPortuguesePotawatomiPuebloPuerto RicanPuget Sound SalishRomanianRussianSalvadoranSamoanScandinavianScotch-IrishScottishSeminoleSenegaleseSerbianShoshoneSierra LeoneanSiouxSlavicSlovakSloveneSomaliSouth AfricanSouth AmericanSouth American IndianSoviet UnionSpaniardSpanishSpanish AmericanSpanish American IndianSri LankanSubsaharan AfricanSudaneseSwedishSwissSyrianTaiwaneseThaiTlingit-HaidaTohono O'OdhamTonganTrinidadian and TobagonianTsimshianTurkishU.S. Virgin IslanderUgandanUkrainianUruguayanUteVenezuelanVietnameseWelshWest IndianYakamaYaquiYugoslavianYumanYup'ikZimbabwean
Immigration
NonimmigrantsImmigrantsAfghanistanAfricaAlbaniaArgentinaArmeniaAsiaAustraliaAustriaBahamasBangladeshBarbadosBelarusBelgiumBelizeBoliviaBosnia and HerzegovinaBrazilBulgariaBurma/MyanmarCabo VerdeCambodiaCameroonCanadaCaribbeanCentral AmericaChileChinaColombiaCongoCosta RicaCroatiaCubaCzechoslovakiaDenmarkDominicaDominican RepublicEastern AfricaEastern AsiaEastern EuropeEcuadorEgyptEl SalvadorEnglandEritreaEthiopiaEuropeFijiFranceGermanyGhanaGreeceGrenadaGuatemalaGuyanaHaitiHondurasHong KongHungaryIndiaIndonesiaIranIraqIrelandIsraelItalyJamaicaJapanJordanKazakhstanKenyaKoreaKuwaitLaosLatin AmericaLatviaLebanonLiberiaLithuaniaMalaysiaMexicoMicronesiaMiddle AfricaMoldovaMoroccoNepalNetherlandsNicaraguaNigeriaNorth AmericaNorth MacedoniaNorthern AfricaNorthern EuropeNorwayOceaniaPakistanPanamaPeruPhilippinesPolandPortugalRomaniaRussiaSaudi ArabiaScotlandSenegalSerbiaSierra LeoneSingaporeSomaliaSouth AfricaSouth AmericaSouth Central AsiaSouth Eastern AsiaSouthern EuropeSpainSri LankaSt. Vincent and the GrenadinesSudanSwedenSwitzerlandSyriaTaiwanThailandTrinidad and TobagoTurkeyUgandaUkraineUruguayUzbekistanVenezuelaVietnamWest IndiesWestern AfricaWestern AsiaWestern EuropeYemenZaireZimbabweAzores
Select to Compare
Race
Ancestry
AfghanAfricanAlaska NativeAlaskan AthabascanAlbanianAleutAlsatianAmericanApacheArabArapahoArgentineanArmenianAssyrian/Chaldean/SyriacAustralianAustrianBahamianBangladeshiBarbadianBasqueBelgianBelizeanBermudanBhutaneseBlackfeetBolivianBrazilianBritishBritish West IndianBulgarianBurmeseCajunCambodianCanadianCape VerdeanCarpatho RusynCelticCentral AmericanCentral American IndianCherokeeCheyenneChickasawChileanChineseChippewaChoctawColombianColvilleComancheCosta RicanCreeCreekCroatianCrowCubanCypriotCzechCzechoslovakianDanishDelawareDominicanDutchEastern EuropeanEcuadorianEgyptianEnglishEstonianEthiopianEuropeanFijianFilipinoFinnishFrenchFrench American IndianFrench CanadianGermanGerman RussianGhanaianGreekGuamanian/ChamorroGuatemalanGuyaneseHaitianHmongHonduranHopiHoumaHungarianIcelanderIndian (Asian)IndonesianInupiatIranianIraqiIrishIroquoisIsraeliItalianJamaicanJapaneseJordanianKenyanKiowaKoreanLaotianLatvianLebaneseLiberianLithuanianLumbeeLuxembourgerMacedonianMalaysianMalteseMarshalleseMenomineeMexicanMexican American IndianMongolianMoroccanNative HawaiianNavajoNepaleseNew ZealanderNicaraguanNigerianNorthern EuropeanNorwegianOkinawanOsageOttawaPaiutePakistaniPalestinianPanamanianParaguayanPennsylvania GermanPeruvianPimaPolishPortuguesePotawatomiPuebloPuerto RicanPuget Sound SalishRomanianRussianSalvadoranSamoanScandinavianScotch-IrishScottishSeminoleSenegaleseSerbianShoshoneSierra LeoneanSiouxSlavicSlovakSloveneSomaliSouth AfricanSouth AmericanSouth American IndianSoviet UnionSpaniardSpanishSpanish AmericanSpanish American IndianSri LankanSubsaharan AfricanSudaneseSwedishSwissSyrianTaiwaneseThaiTlingit-HaidaTohono O'OdhamTonganTrinidadian and TobagonianTsimshianTurkishU.S. Virgin IslanderUgandanUkrainianUruguayanUteVenezuelanVietnameseWelshWest IndianYakamaYaquiYugoslavianYumanYup'ikZimbabwean
Immigration
NonimmigrantsImmigrantsAfghanistanAfricaAlbaniaArgentinaArmeniaAsiaAustraliaAustriaBahamasBangladeshBarbadosBelarusBelgiumBelizeBoliviaBosnia and HerzegovinaBrazilBulgariaBurma/MyanmarCabo VerdeCambodiaCameroonCanadaCaribbeanCentral AmericaChileChinaColombiaCongoCosta RicaCroatiaCubaCzechoslovakiaDenmarkDominicaDominican RepublicEastern AfricaEastern AsiaEastern EuropeEcuadorEgyptEl SalvadorEnglandEritreaEthiopiaEuropeFijiFranceGermanyGhanaGreeceGrenadaGuatemalaGuyanaHaitiHondurasHong KongHungaryIndiaIndonesiaIranIraqIrelandIsraelItalyJamaicaJapanJordanKazakhstanKenyaKoreaKuwaitLaosLatin AmericaLatviaLebanonLiberiaLithuaniaMalaysiaMexicoMicronesiaMiddle AfricaMoldovaMoroccoNepalNetherlandsNicaraguaNigeriaNorth AmericaNorth MacedoniaNorthern AfricaNorthern EuropeNorwayOceaniaPakistanPanamaPeruPhilippinesPolandPortugalRomaniaRussiaSaudi ArabiaScotlandSenegalSerbiaSierra LeoneSingaporeSomaliaSouth AfricaSouth AmericaSouth Central AsiaSouth Eastern AsiaSouthern EuropeSpainSri LankaSt. Vincent and the GrenadinesSudanSwedenSwitzerlandSyriaTaiwanThailandTrinidad and TobagoTurkeyUgandaUkraineUruguayUzbekistanVenezuelaVietnamWest IndiesWestern AfricaWestern AsiaWestern EuropeYemenZaireZimbabweAzores
3 or more Vehicles in Household
Income
Poverty
Unemployment
Labor Participation
Family Structure
Vehicle Availability
Education Level
Disability

Dutch West Indian 3 or more Vehicles in Household
Exceptional

20.9%
3+ VEHICLES AVAILABLE
97.8/ 100
METRIC RATING
103rd/ 347
METRIC RANK

Dutch West Indian 3 or more Vehicles in Household Correlation Chart

The statistical analysis conducted on geographies consisting of 85,766,140 people shows a very strong positive correlation between the proportion of Dutch West Indians and percentage of households with 3 or more vehicles available in the United States with a correlation coefficient (R) of 0.825 and weighted average of 20.9%. On average, for every 1% (one percent) increase in Dutch West Indians within a typical geography, there is an increase of 1.2% in percentage of households with 3 or more vehicles available.
Dutch West Indian 3 or more Vehicles in Household
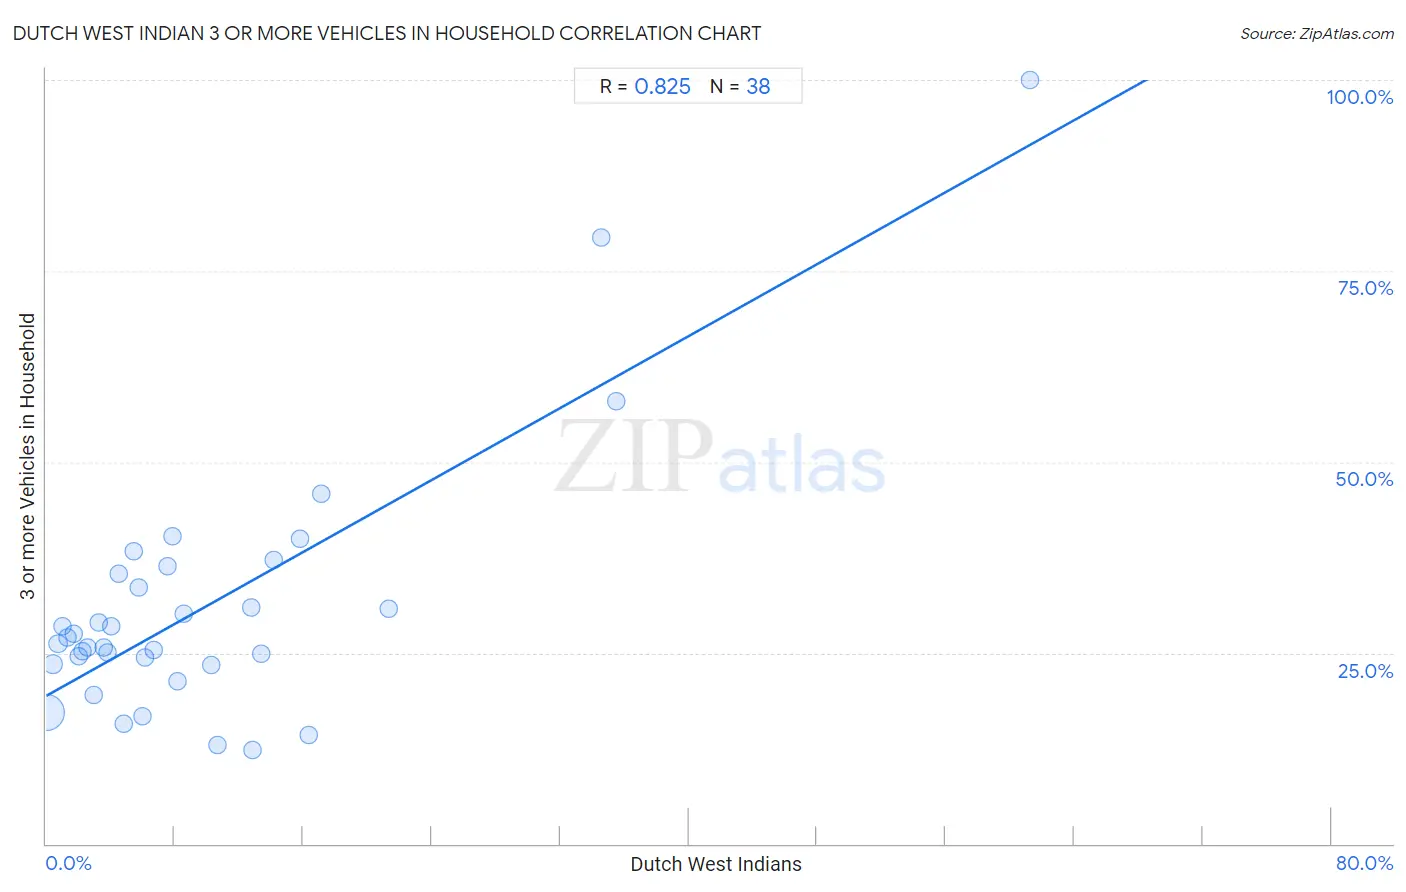
It is essential to understand that the correlation between the percentage of Dutch West Indians and percentage of households with 3 or more vehicles available does not imply a direct cause-and-effect relationship. It remains uncertain whether the presence of Dutch West Indians influences an upward or downward trend in the level of percentage of households with 3 or more vehicles available within an area, or if Dutch West Indians simply ended up residing in those areas with higher or lower levels of percentage of households with 3 or more vehicles available due to other factors.

Demographics Similar to Dutch West Indians by 3 or more Vehicles in Household

In terms of 3 or more vehicles in household, the demographic groups most similar to Dutch West Indians are Seminole (20.9%, a difference of 0.040%), Blackfeet (20.9%, a difference of 0.070%), Luxembourger (20.9%, a difference of 0.080%), Austrian (20.9%, a difference of 0.19%), and Bolivian (20.8%, a difference of 0.28%).
DemographicsRating | Rank3 or more Vehicles in Household
Cree
98.4
/100
|
#96
Exceptional
21.0%
Canadians
98.3
/100
|
#97
Exceptional
21.0%
Hmong
98.2
/100
|
#98
Exceptional
21.0%
Alaska Natives
98.2
/100
|
#99
Exceptional
21.0%
Comanche
98.2
/100
|
#100
Exceptional
21.0%
Blackfeet
97.9
/100
|
#101
Exceptional
20.9%
Seminole
97.8
/100
|
#102
Exceptional
20.9%
Dutch West Indians
97.8
/100
|
#103
Exceptional
20.9%
Luxembourgers
97.7
/100
|
#104
Exceptional
20.9%
Austrians
97.5
/100
|
#105
Exceptional
20.9%
Bolivians
97.4
/100
|
#106
Exceptional
20.8%
Immigrants from Germany
97.4
/100
|
#107
Exceptional
20.8%
Immigrants from Scotland
97.1
/100
|
#108
Exceptional
20.8%
Filipinos
97.0
/100
|
#109
Exceptional
20.8%
Asians
96.8
/100
|
#110
Exceptional
20.8%

Dutch West Indian 3 or more Vehicles in Household Correlation Summary

MeasurementDutch West Indian Data3 or more Vehicles in Household Data
Minimum0.033%12.2%
Maximum61.3%100.0%
Range61.2%87.8%
Mean9.9%31.1%
Median6.1%26.6%
Interquartile 25% (IQ1)3.0%23.5%
Interquartile 75% (IQ3)12.9%35.3%
Interquartile Range (IQR)9.9%11.8%
Standard Deviation (Sample)11.9%16.9%
Standard Deviation (Population)11.7%16.7%

Correlation Details

Dutch West Indian PercentileSample Size3 or more Vehicles in Household
[
0.0%
-
0.5%
]
0.033%
82,977,92517.2%
[
0.0%
-
0.5%
]
0.42%
1,810,29523.5%
[
0.5%
-
1.0%
]
0.74%
492,15026.2%
[
1.0%
-
1.5%
]
1.05%
186,06328.5%
[
1.0%
-
1.5%
]
1.35%
99,79327.0%
[
1.5%
-
2.0%
]
1.68%
61,31327.5%
[
2.0%
-
2.5%
]
2.00%
43,75324.6%
[
2.0%
-
2.5%
]
2.29%
14,30325.3%
[
2.5%
-
3.0%
]
2.60%
27,20625.8%
[
2.5%
-
3.0%
]
2.95%
12,59319.6%
[
3.0%
-
3.5%
]
3.24%
10,00928.9%
[
3.5%
-
4.0%
]
3.57%
6,28125.6%
[
3.5%
-
4.0%
]
3.80%
3,15925.0%
[
4.0%
-
4.5%
]
4.07%
6,71428.4%
[
4.5%
-
5.0%
]
4.53%
1,03735.3%
[
4.5%
-
5.0%
]
4.84%
2,95315.7%
[
5.0%
-
5.5%
]
5.44%
1,14038.3%
[
5.5%
-
6.0%
]
5.75%
1,46233.6%
[
5.5%
-
6.0%
]
5.98%
51816.7%
[
6.0%
-
6.5%
]
6.18%
72824.4%
[
6.5%
-
7.0%
]
6.67%
40525.4%
[
7.5%
-
8.0%
]
7.58%
1,06936.4%
[
7.5%
-
8.0%
]
7.89%
1,42040.3%
[
8.0%
-
8.5%
]
8.17%
20821.3%
[
8.5%
-
9.0%
]
8.55%
1,21630.2%
[
10.0%
-
10.5%
]
10.27%
29223.5%
[
10.5%
-
11.0%
]
10.64%
4712.9%
[
12.5%
-
13.0%
]
12.76%
43931.0%
[
12.5%
-
13.0%
]
12.88%
13212.2%
[
13.0%
-
13.5%
]
13.42%
31324.8%
[
14.0%
-
14.5%
]
14.20%
31737.2%
[
15.5%
-
16.0%
]
15.79%
1940.0%
[
16.0%
-
16.5%
]
16.36%
5514.3%
[
17.0%
-
17.5%
]
17.14%
38545.8%
[
21.0%
-
21.5%
]
21.35%
8930.8%
[
34.5%
-
35.0%
]
34.52%
19779.4%
[
35.0%
-
35.5%
]
35.48%
3157.9%
[
61.0%
-
61.5%
]
61.26%
111100.0%