Creek vs German Russian Married-Couple Family Poverty
COMPARE
Creek
German Russian
Married-Couple Family Poverty
Married-Couple Family Poverty Comparison
Creek
German Russians
6.2%
MARRIED-COUPLE FAMILY POVERTY
0.2/ 100
METRIC RATING
266th/ 347
METRIC RANK
5.0%
MARRIED-COUPLE FAMILY POVERTY
85.1/ 100
METRIC RATING
139th/ 347
METRIC RANK
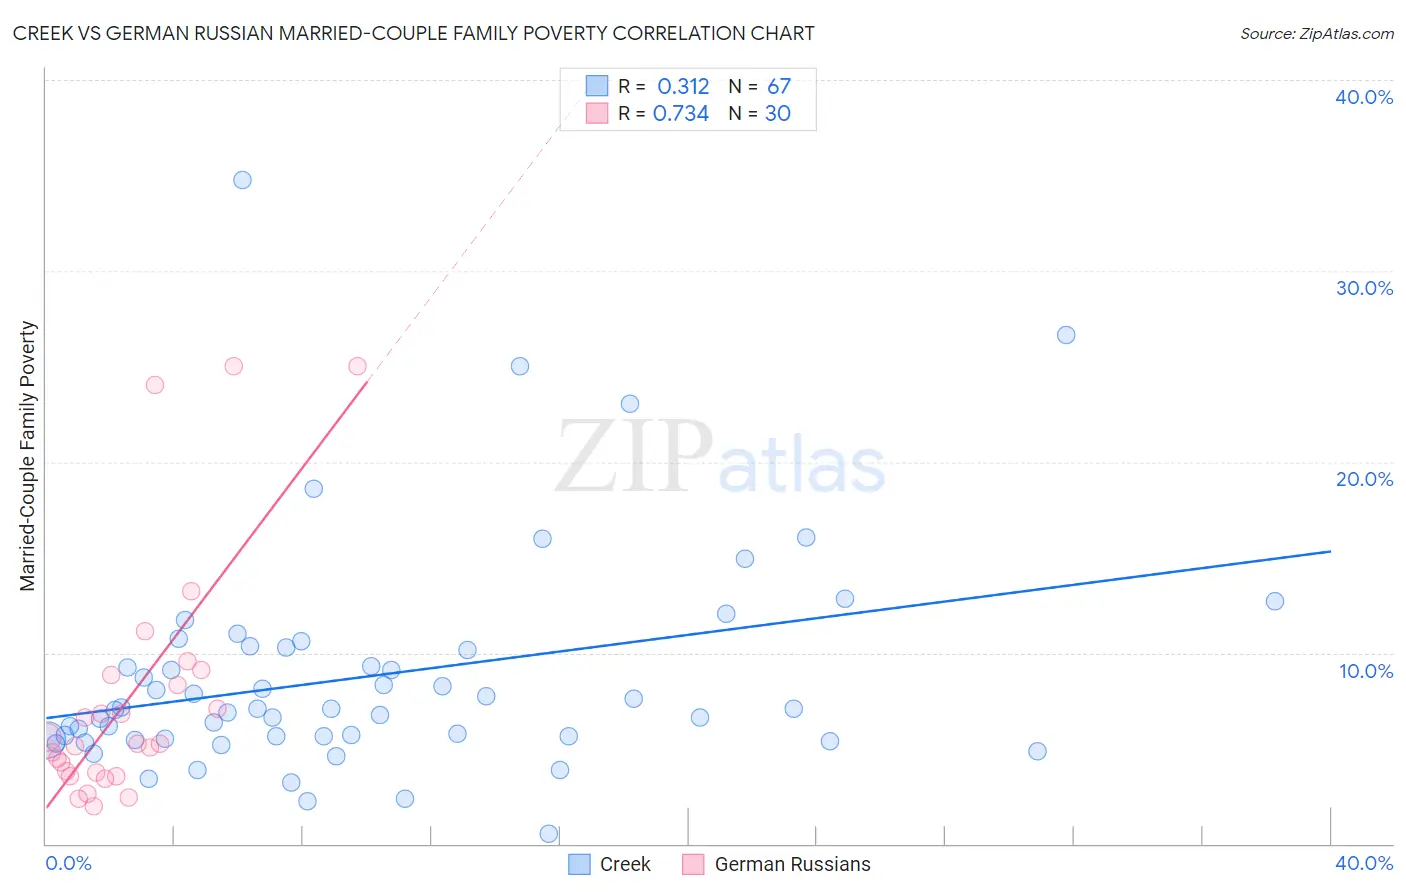
Creek vs German Russian Married-Couple Family Poverty Correlation Chart
The statistical analysis conducted on geographies consisting of 177,846,952 people shows a mild positive correlation between the proportion of Creek and poverty level among married-couple families in the United States with a correlation coefficient (R) of 0.312 and weighted average of 6.2%. Similarly, the statistical analysis conducted on geographies consisting of 96,237,761 people shows a strong positive correlation between the proportion of German Russians and poverty level among married-couple families in the United States with a correlation coefficient (R) of 0.734 and weighted average of 5.0%, a difference of 24.5%.
Married-Couple Family Poverty Correlation Summary
| Measurement | Creek | German Russian |
| Minimum | 0.52% | 2.0% |
| Maximum | 34.7% | 25.0% |
| Range | 34.2% | 23.0% |
| Mean | 8.8% | 7.6% |
| Median | 7.1% | 5.3% |
| Interquartile 25% (IQ1) | 5.5% | 3.7% |
| Interquartile 75% (IQ3) | 10.3% | 8.9% |
| Interquartile Range (IQR) | 4.8% | 5.1% |
| Standard Deviation (Sample) | 5.9% | 6.4% |
| Standard Deviation (Population) | 5.8% | 6.3% |
Similar Demographics by Married-Couple Family Poverty
Demographics Similar to Creek by Married-Couple Family Poverty
In terms of married-couple family poverty, the demographic groups most similar to Creek are Spanish American (6.2%, a difference of 0.050%), Blackfeet (6.2%, a difference of 0.080%), Immigrants from Congo (6.1%, a difference of 0.51%), Alaska Native (6.2%, a difference of 0.53%), and Immigrants from West Indies (6.2%, a difference of 0.70%).
| Demographics | Rating | Rank | Married-Couple Family Poverty |
| Alaskan Athabascans | 0.4 /100 | #259 | Tragic 6.1% |
| Jamaicans | 0.3 /100 | #260 | Tragic 6.1% |
| Senegalese | 0.3 /100 | #261 | Tragic 6.1% |
| Shoshone | 0.3 /100 | #262 | Tragic 6.1% |
| Immigrants | Senegal | 0.3 /100 | #263 | Tragic 6.1% |
| Immigrants | Congo | 0.2 /100 | #264 | Tragic 6.1% |
| Blackfeet | 0.2 /100 | #265 | Tragic 6.2% |
| Creek | 0.2 /100 | #266 | Tragic 6.2% |
| Spanish Americans | 0.2 /100 | #267 | Tragic 6.2% |
| Alaska Natives | 0.2 /100 | #268 | Tragic 6.2% |
| Immigrants | West Indies | 0.1 /100 | #269 | Tragic 6.2% |
| Immigrants | Jamaica | 0.1 /100 | #270 | Tragic 6.2% |
| Immigrants | Bahamas | 0.1 /100 | #271 | Tragic 6.2% |
| Trinidadians and Tobagonians | 0.1 /100 | #272 | Tragic 6.2% |
| Colville | 0.1 /100 | #273 | Tragic 6.3% |
Demographics Similar to German Russians by Married-Couple Family Poverty
In terms of married-couple family poverty, the demographic groups most similar to German Russians are Immigrants from Portugal (5.0%, a difference of 0.060%), Immigrants from Brazil (5.0%, a difference of 0.11%), Immigrants from China (5.0%, a difference of 0.11%), Chilean (4.9%, a difference of 0.23%), and Guamanian/Chamorro (4.9%, a difference of 0.36%).
| Demographics | Rating | Rank | Married-Couple Family Poverty |
| Puget Sound Salish | 90.4 /100 | #132 | Exceptional 4.9% |
| Immigrants | Kenya | 90.2 /100 | #133 | Exceptional 4.9% |
| Samoans | 90.2 /100 | #134 | Exceptional 4.9% |
| Assyrians/Chaldeans/Syriacs | 89.4 /100 | #135 | Excellent 4.9% |
| Immigrants | Hungary | 88.7 /100 | #136 | Excellent 4.9% |
| Guamanians/Chamorros | 86.5 /100 | #137 | Excellent 4.9% |
| Chileans | 86.0 /100 | #138 | Excellent 4.9% |
| German Russians | 85.1 /100 | #139 | Excellent 5.0% |
| Immigrants | Portugal | 84.8 /100 | #140 | Excellent 5.0% |
| Immigrants | Brazil | 84.6 /100 | #141 | Excellent 5.0% |
| Immigrants | China | 84.6 /100 | #142 | Excellent 5.0% |
| Immigrants | Egypt | 83.4 /100 | #143 | Excellent 5.0% |
| Hmong | 83.2 /100 | #144 | Excellent 5.0% |
| Immigrants | Spain | 79.9 /100 | #145 | Good 5.0% |
| Mongolians | 79.8 /100 | #146 | Good 5.0% |