Creek vs Immigrants from St. Vincent and the Grenadines Married-Couple Family Poverty
COMPARE
Creek
Immigrants from St. Vincent and the Grenadines
Married-Couple Family Poverty
Married-Couple Family Poverty Comparison
Creek
Immigrants from St. Vincent and the Grenadines
6.2%
MARRIED-COUPLE FAMILY POVERTY
0.2/ 100
METRIC RATING
266th/ 347
METRIC RANK
7.1%
MARRIED-COUPLE FAMILY POVERTY
0.0/ 100
METRIC RATING
313th/ 347
METRIC RANK
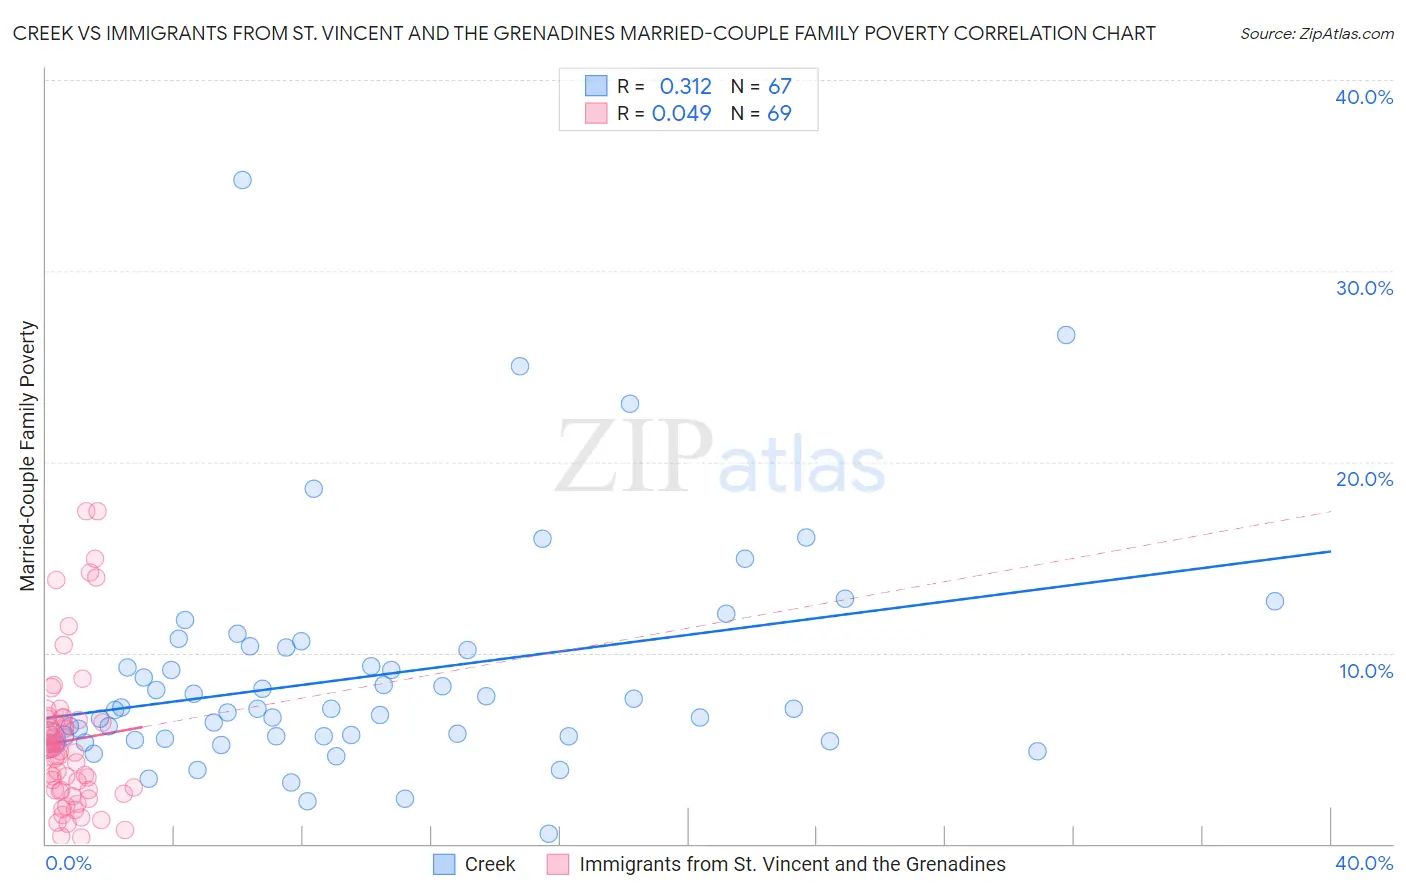
Creek vs Immigrants from St. Vincent and the Grenadines Married-Couple Family Poverty Correlation Chart
The statistical analysis conducted on geographies consisting of 177,846,952 people shows a mild positive correlation between the proportion of Creek and poverty level among married-couple families in the United States with a correlation coefficient (R) of 0.312 and weighted average of 6.2%. Similarly, the statistical analysis conducted on geographies consisting of 56,063,959 people shows no correlation between the proportion of Immigrants from St. Vincent and the Grenadines and poverty level among married-couple families in the United States with a correlation coefficient (R) of 0.049 and weighted average of 7.1%, a difference of 15.1%.
Married-Couple Family Poverty Correlation Summary
| Measurement | Creek | Immigrants from St. Vincent and the Grenadines |
| Minimum | 0.52% | 0.34% |
| Maximum | 34.7% | 17.4% |
| Range | 34.2% | 17.1% |
| Mean | 8.8% | 5.4% |
| Median | 7.1% | 4.9% |
| Interquartile 25% (IQ1) | 5.5% | 2.8% |
| Interquartile 75% (IQ3) | 10.3% | 6.5% |
| Interquartile Range (IQR) | 4.8% | 3.7% |
| Standard Deviation (Sample) | 5.9% | 3.8% |
| Standard Deviation (Population) | 5.8% | 3.8% |
Similar Demographics by Married-Couple Family Poverty
Demographics Similar to Creek by Married-Couple Family Poverty
In terms of married-couple family poverty, the demographic groups most similar to Creek are Spanish American (6.2%, a difference of 0.050%), Blackfeet (6.2%, a difference of 0.080%), Immigrants from Congo (6.1%, a difference of 0.51%), Alaska Native (6.2%, a difference of 0.53%), and Immigrants from West Indies (6.2%, a difference of 0.70%).
| Demographics | Rating | Rank | Married-Couple Family Poverty |
| Alaskan Athabascans | 0.4 /100 | #259 | Tragic 6.1% |
| Jamaicans | 0.3 /100 | #260 | Tragic 6.1% |
| Senegalese | 0.3 /100 | #261 | Tragic 6.1% |
| Shoshone | 0.3 /100 | #262 | Tragic 6.1% |
| Immigrants | Senegal | 0.3 /100 | #263 | Tragic 6.1% |
| Immigrants | Congo | 0.2 /100 | #264 | Tragic 6.1% |
| Blackfeet | 0.2 /100 | #265 | Tragic 6.2% |
| Creek | 0.2 /100 | #266 | Tragic 6.2% |
| Spanish Americans | 0.2 /100 | #267 | Tragic 6.2% |
| Alaska Natives | 0.2 /100 | #268 | Tragic 6.2% |
| Immigrants | West Indies | 0.1 /100 | #269 | Tragic 6.2% |
| Immigrants | Jamaica | 0.1 /100 | #270 | Tragic 6.2% |
| Immigrants | Bahamas | 0.1 /100 | #271 | Tragic 6.2% |
| Trinidadians and Tobagonians | 0.1 /100 | #272 | Tragic 6.2% |
| Colville | 0.1 /100 | #273 | Tragic 6.3% |
Demographics Similar to Immigrants from St. Vincent and the Grenadines by Married-Couple Family Poverty
In terms of married-couple family poverty, the demographic groups most similar to Immigrants from St. Vincent and the Grenadines are Immigrants from Dominica (7.1%, a difference of 0.11%), Immigrants from Armenia (7.1%, a difference of 0.11%), Immigrants from Nicaragua (7.1%, a difference of 0.17%), Hopi (7.1%, a difference of 0.19%), and British West Indian (7.1%, a difference of 0.30%).
| Demographics | Rating | Rank | Married-Couple Family Poverty |
| Immigrants | Haiti | 0.0 /100 | #306 | Tragic 7.0% |
| Guatemalans | 0.0 /100 | #307 | Tragic 7.0% |
| Spanish American Indians | 0.0 /100 | #308 | Tragic 7.1% |
| Hopi | 0.0 /100 | #309 | Tragic 7.1% |
| Immigrants | Nicaragua | 0.0 /100 | #310 | Tragic 7.1% |
| Immigrants | Dominica | 0.0 /100 | #311 | Tragic 7.1% |
| Immigrants | Armenia | 0.0 /100 | #312 | Tragic 7.1% |
| Immigrants | St. Vincent and the Grenadines | 0.0 /100 | #313 | Tragic 7.1% |
| British West Indians | 0.0 /100 | #314 | Tragic 7.1% |
| Inupiat | 0.0 /100 | #315 | Tragic 7.1% |
| Hondurans | 0.0 /100 | #316 | Tragic 7.2% |
| Mexicans | 0.0 /100 | #317 | Tragic 7.2% |
| Immigrants | Guatemala | 0.0 /100 | #318 | Tragic 7.2% |
| Immigrants | Latin America | 0.0 /100 | #319 | Tragic 7.2% |
| Immigrants | Grenada | 0.0 /100 | #320 | Tragic 7.3% |