Australian Male Disability
COMPARE
Australian
Select to Compare
Male Disability
Australian Male Disability
11.3%
DISABILITY | MALES
42.2/ 100
METRIC RATING
178th/ 347
METRIC RANK
Australian Male Disability Correlation Chart
The statistical analysis conducted on geographies consisting of 224,140,588 people shows a moderate positive correlation between the proportion of Australians and percentage of males with a disability in the United States with a correlation coefficient (R) of 0.407 and weighted average of 11.3%. On average, for every 1% (one percent) increase in Australians within a typical geography, there is an increase of 1.2% in percentage of males with a disability.
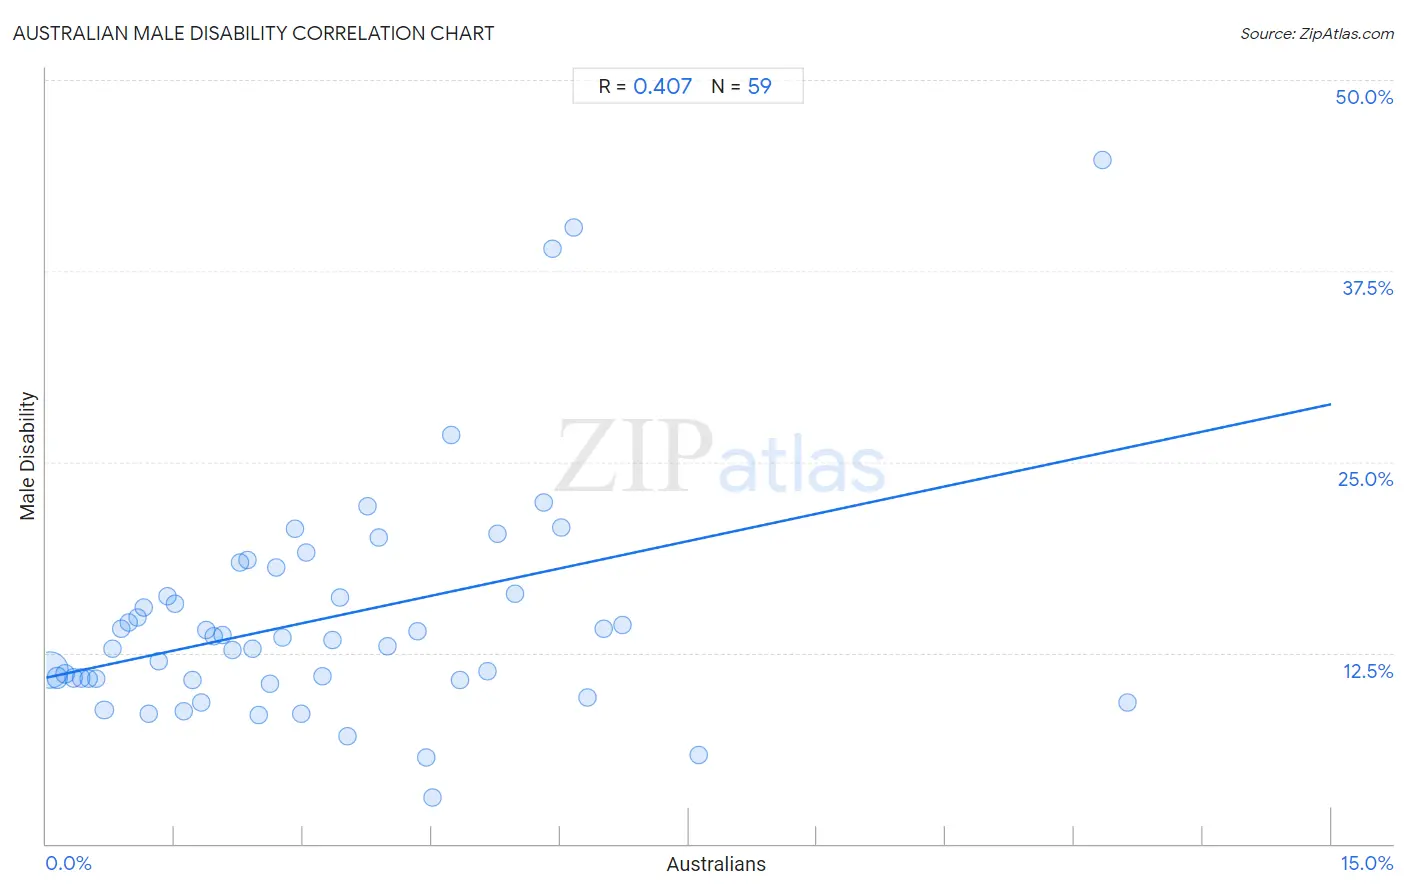
It is essential to understand that the correlation between the percentage of Australians and percentage of males with a disability does not imply a direct cause-and-effect relationship. It remains uncertain whether the presence of Australians influences an upward or downward trend in the level of percentage of males with a disability within an area, or if Australians simply ended up residing in those areas with higher or lower levels of percentage of males with a disability due to other factors.
Demographics Similar to Australians by Male Disability
In terms of male disability, the demographic groups most similar to Australians are Immigrants from Caribbean (11.3%, a difference of 0.040%), Honduran (11.3%, a difference of 0.060%), Immigrants from Norway (11.3%, a difference of 0.11%), Syrian (11.2%, a difference of 0.24%), and Immigrants from Honduras (11.2%, a difference of 0.36%).
| Demographics | Rating | Rank | Male Disability |
| Haitians | 52.5 /100 | #171 | Average 11.2% |
| Romanians | 50.7 /100 | #172 | Average 11.2% |
| Immigrants from Burma/Myanmar | 50.4 /100 | #173 | Average 11.2% |
| Maltese | 50.0 /100 | #174 | Average 11.2% |
| Immigrants from Honduras | 48.7 /100 | #175 | Average 11.2% |
| Syrians | 46.6 /100 | #176 | Average 11.2% |
| Immigrants from Norway | 44.2 /100 | #177 | Average 11.3% |
| Australians | 42.2 /100 | #178 | Average 11.3% |
| Immigrants from Caribbean | 41.4 /100 | #179 | Average 11.3% |
| Hondurans | 41.1 /100 | #180 | Average 11.3% |
| Immigrants from Senegal | 34.4 /100 | #181 | Fair 11.3% |
| Immigrants from Belize | 33.7 /100 | #182 | Fair 11.3% |
| Immigrants from Central America | 32.9 /100 | #183 | Fair 11.3% |
| Iraqis | 30.5 /100 | #184 | Fair 11.3% |
| Pakistanis | 30.3 /100 | #185 | Fair 11.3% |
Australian Male Disability Correlation Summary
| Measurement | Australian Data | Male Disability Data |
| Minimum | 0.037% | 3.0% |
| Maximum | 12.6% | 44.7% |
| Range | 12.6% | 41.7% |
| Mean | 3.3% | 14.8% |
| Median | 2.7% | 13.3% |
| Interquartile 25% (IQ1) | 1.3% | 10.8% |
| Interquartile 75% (IQ3) | 4.7% | 16.4% |
| Interquartile Range (IQR) | 3.4% | 5.6% |
| Standard Deviation (Sample) | 2.6% | 7.7% |
| Standard Deviation (Population) | 2.6% | 7.6% |
Correlation Details
| Australian Percentile | Sample Size | Male Disability |
[ 0.0% - 0.5% ] 0.037% | 176,706,562 | 11.4% |
[ 0.0% - 0.5% ] 0.13% | 27,515,505 | 10.9% |
[ 0.0% - 0.5% ] 0.22% | 9,452,265 | 11.1% |
[ 0.0% - 0.5% ] 0.32% | 4,039,207 | 10.9% |
[ 0.0% - 0.5% ] 0.40% | 2,257,517 | 10.9% |
[ 0.5% - 1.0% ] 0.50% | 1,307,430 | 10.8% |
[ 0.5% - 1.0% ] 0.58% | 845,137 | 10.8% |
[ 0.5% - 1.0% ] 0.68% | 593,622 | 8.8% |
[ 0.5% - 1.0% ] 0.77% | 431,088 | 12.8% |
[ 0.5% - 1.0% ] 0.87% | 290,639 | 14.1% |
[ 0.5% - 1.0% ] 0.96% | 128,669 | 14.5% |
[ 1.0% - 1.5% ] 1.06% | 38,776 | 14.8% |
[ 1.0% - 1.5% ] 1.14% | 51,611 | 15.5% |
[ 1.0% - 1.5% ] 1.20% | 40,719 | 8.5% |
[ 1.0% - 1.5% ] 1.32% | 82,601 | 12.0% |
[ 1.0% - 1.5% ] 1.42% | 28,898 | 16.2% |
[ 1.5% - 2.0% ] 1.51% | 36,859 | 15.7% |
[ 1.5% - 2.0% ] 1.61% | 62,598 | 8.6% |
[ 1.5% - 2.0% ] 1.70% | 25,339 | 10.7% |
[ 1.5% - 2.0% ] 1.80% | 41,528 | 9.2% |
[ 1.5% - 2.0% ] 1.86% | 21,163 | 14.0% |
[ 1.5% - 2.0% ] 1.95% | 40,272 | 13.6% |
[ 2.0% - 2.5% ] 2.06% | 7,725 | 13.7% |
[ 2.0% - 2.5% ] 2.17% | 3,458 | 12.7% |
[ 2.0% - 2.5% ] 2.26% | 5,181 | 18.4% |
[ 2.0% - 2.5% ] 2.35% | 15,729 | 18.6% |
[ 2.0% - 2.5% ] 2.40% | 2,288 | 12.8% |
[ 2.0% - 2.5% ] 2.49% | 10,814 | 8.4% |
[ 2.5% - 3.0% ] 2.61% | 5,297 | 10.4% |
[ 2.5% - 3.0% ] 2.69% | 2,566 | 18.1% |
[ 2.5% - 3.0% ] 2.76% | 1,812 | 13.5% |
[ 2.5% - 3.0% ] 2.91% | 378 | 20.7% |
[ 2.5% - 3.0% ] 2.98% | 2,850 | 8.5% |
[ 3.0% - 3.5% ] 3.04% | 2,827 | 19.1% |
[ 3.0% - 3.5% ] 3.22% | 4,442 | 11.0% |
[ 3.0% - 3.5% ] 3.34% | 10,228 | 13.3% |
[ 3.0% - 3.5% ] 3.42% | 10,047 | 16.1% |
[ 3.5% - 4.0% ] 3.51% | 313 | 7.1% |
[ 3.5% - 4.0% ] 3.75% | 774 | 22.1% |
[ 3.5% - 4.0% ] 3.88% | 438 | 20.0% |
[ 3.5% - 4.0% ] 3.98% | 352 | 12.9% |
[ 4.0% - 4.5% ] 4.34% | 991 | 13.9% |
[ 4.0% - 4.5% ] 4.43% | 158 | 5.6% |
[ 4.5% - 5.0% ] 4.50% | 1,066 | 3.0% |
[ 4.5% - 5.0% ] 4.73% | 825 | 26.8% |
[ 4.5% - 5.0% ] 4.83% | 3,190 | 10.8% |
[ 5.0% - 5.5% ] 5.15% | 1,708 | 11.3% |
[ 5.0% - 5.5% ] 5.27% | 664 | 20.3% |
[ 5.0% - 5.5% ] 5.48% | 420 | 16.4% |
[ 5.5% - 6.0% ] 5.81% | 155 | 22.4% |
[ 5.5% - 6.0% ] 5.92% | 710 | 39.0% |
[ 6.0% - 6.5% ] 6.02% | 1,396 | 20.7% |
[ 6.0% - 6.5% ] 6.15% | 130 | 40.4% |
[ 6.0% - 6.5% ] 6.31% | 301 | 9.6% |
[ 6.5% - 7.0% ] 6.51% | 829 | 14.1% |
[ 6.5% - 7.0% ] 6.73% | 1,307 | 14.3% |
[ 7.5% - 8.0% ] 7.62% | 840 | 5.8% |
[ 12.0% - 12.5% ] 12.33% | 73 | 44.7% |
[ 12.5% - 13.0% ] 12.62% | 301 | 9.3% |