IXL, OK Map & Demographics
IXL Map
IXL Overview
$18,330
PER CAPITA INCOME
$83,500
AVG FAMILY INCOME
0.39
INEQUALITY / GINI INDEX
30
TOTAL POPULATION
16
MALE POPULATION
14
FEMALE POPULATION
114.29
MALES / 100 FEMALES
87.50
FEMALES / 100 MALES
48.2
MEDIAN AGE
3.2
AVG FAMILY SIZE
2.5
AVG HOUSEHOLD SIZE
13
LABOR FORCE [ PEOPLE ]
56.5%
PERCENT IN LABOR FORCE
Income in IXL
Income Overview in IXL
| Characteristic | Number | Measure |
| Per Capita Income | 30 | $18,330 |
| Median Family Income | 8 | $83,500 |
| Mean Family Income | 8 | $72,100 |
| Median Household Income | 12 | $0 |
| Mean Household Income | 12 | $51,158 |
| Income Deficit | 8 | $0 |
| Wage / Income Gap (%) | 30 | 0.00% |
| Wage / Income Gap ($) | 30 | 100.00¢ per $1 |
| Gini / Inequality Index | 30 | 0.39 |
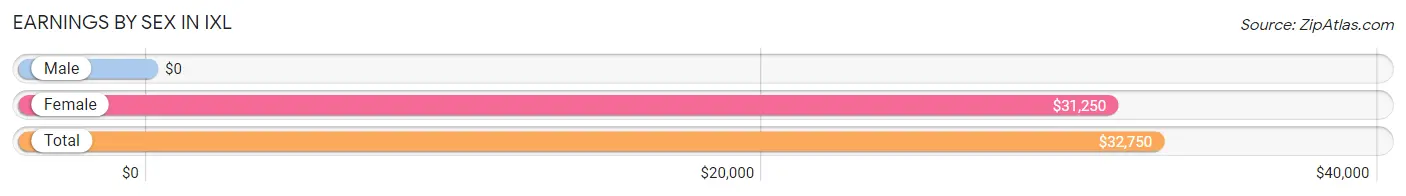
Earnings by Sex in IXL
| Sex | Number | Average Earnings |
| Male | 1 (7.7%) | $0 |
| Female | 12 (92.3%) | $31,250 |
| Total | 13 (100.0%) | $32,750 |
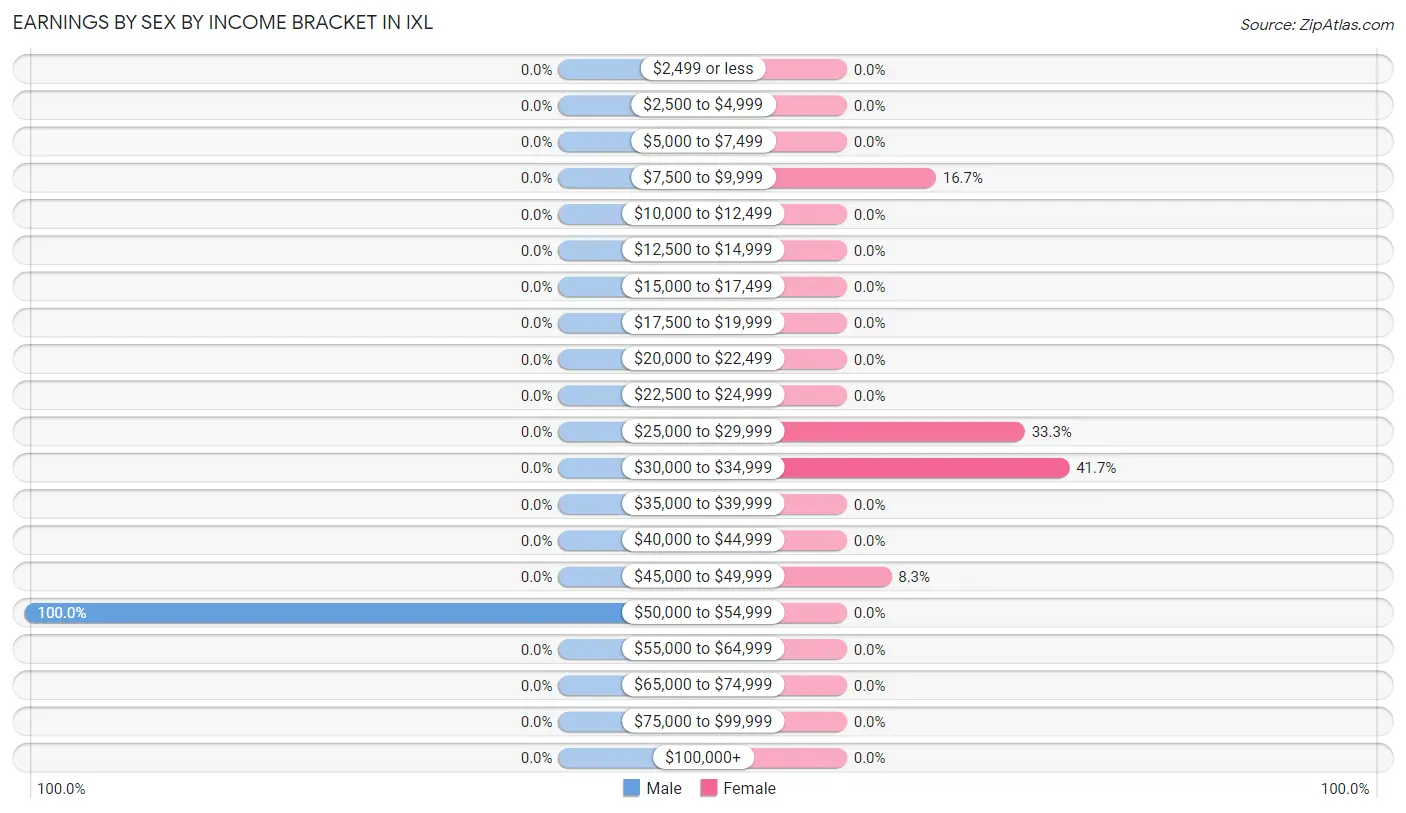
Earnings by Sex by Income Bracket in IXL
The most common earnings brackets in IXL are $50,000 to $54,999 for men (1 | 100.0%) and $30,000 to $34,999 for women (5 | 41.7%).
| Income | Male | Female |
| $2,499 or less | 0 (0.0%) | 0 (0.0%) |
| $2,500 to $4,999 | 0 (0.0%) | 0 (0.0%) |
| $5,000 to $7,499 | 0 (0.0%) | 0 (0.0%) |
| $7,500 to $9,999 | 0 (0.0%) | 2 (16.7%) |
| $10,000 to $12,499 | 0 (0.0%) | 0 (0.0%) |
| $12,500 to $14,999 | 0 (0.0%) | 0 (0.0%) |
| $15,000 to $17,499 | 0 (0.0%) | 0 (0.0%) |
| $17,500 to $19,999 | 0 (0.0%) | 0 (0.0%) |
| $20,000 to $22,499 | 0 (0.0%) | 0 (0.0%) |
| $22,500 to $24,999 | 0 (0.0%) | 0 (0.0%) |
| $25,000 to $29,999 | 0 (0.0%) | 4 (33.3%) |
| $30,000 to $34,999 | 0 (0.0%) | 5 (41.7%) |
| $35,000 to $39,999 | 0 (0.0%) | 0 (0.0%) |
| $40,000 to $44,999 | 0 (0.0%) | 0 (0.0%) |
| $45,000 to $49,999 | 0 (0.0%) | 1 (8.3%) |
| $50,000 to $54,999 | 1 (100.0%) | 0 (0.0%) |
| $55,000 to $64,999 | 0 (0.0%) | 0 (0.0%) |
| $65,000 to $74,999 | 0 (0.0%) | 0 (0.0%) |
| $75,000 to $99,999 | 0 (0.0%) | 0 (0.0%) |
| $100,000+ | 0 (0.0%) | 0 (0.0%) |
| Total | 1 (100.0%) | 12 (100.0%) |
Earnings by Sex by Educational Attainment in IXL
| Educational Attainment | Male Income | Female Income |
| Less than High School | - | - |
| High School Diploma | - | - |
| College or Associate's Degree | - | - |
| Bachelor's Degree | - | - |
| Graduate Degree | - | - |
| Total | - | - |
Family Income in IXL
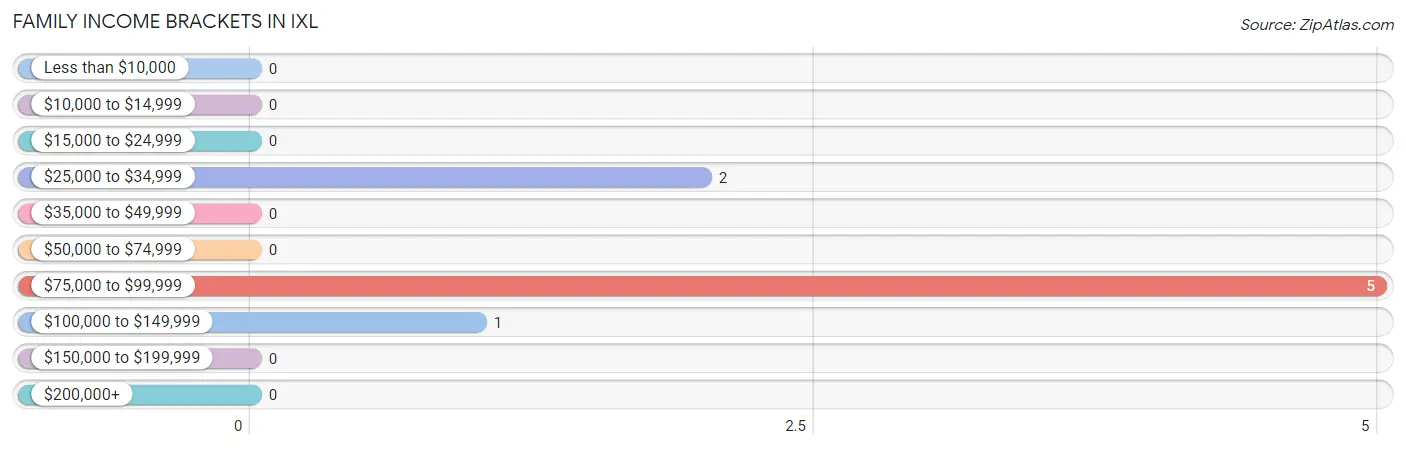
Family Income Brackets in IXL
According to the IXL family income data, there are 5 families falling into the $75,000 to $99,999 income range, which is the most common income bracket and makes up 62.5% of all families.
| Income Bracket | # Families | % Families |
| Less than $10,000 | 0 | 0.0% |
| $10,000 to $14,999 | 0 | 0.0% |
| $15,000 to $24,999 | 0 | 0.0% |
| $25,000 to $34,999 | 2 | 25.0% |
| $35,000 to $49,999 | 0 | 0.0% |
| $50,000 to $74,999 | 0 | 0.0% |
| $75,000 to $99,999 | 5 | 62.5% |
| $100,000 to $149,999 | 1 | 12.5% |
| $150,000 to $199,999 | 0 | 0.0% |
| $200,000+ | 0 | 0.0% |
Family Income by Famaliy Size in IXL
| Income Bracket | # Families | Median Income |
| 2-Person Families | 2 (25.0%) | $0 |
| 3-Person Families | 0 (0.0%) | $0 |
| 4-Person Families | 6 (75.0%) | $0 |
| 5-Person Families | 0 (0.0%) | $0 |
| 6-Person Families | 0 (0.0%) | $0 |
| 7+ Person Families | 0 (0.0%) | $0 |
| Total | 8 (100.0%) | $83,500 |
Family Income by Number of Earners in IXL
| Number of Earners | # Families | Median Income |
| No Earners | 2 (25.0%) | $0 |
| 1 Earner | 0 (0.0%) | $0 |
| 2 Earners | 5 (62.5%) | $0 |
| 3+ Earners | 1 (12.5%) | $0 |
| Total | 8 (100.0%) | $83,500 |
Household Income in IXL
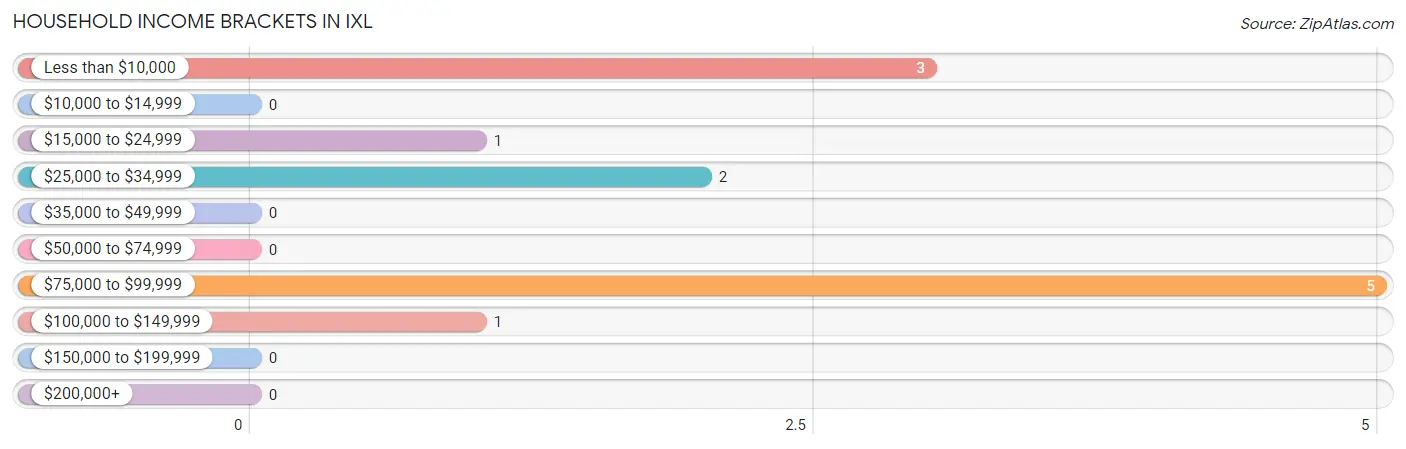
Household Income Brackets in IXL
With 5 households falling in the category, the $75,000 to $99,999 income range is the most frequent in IXL, accounting for 41.7% of all households.
| Income Bracket | # Households | % Households |
| Less than $10,000 | 3 | 25.0% |
| $10,000 to $14,999 | 0 | 0.0% |
| $15,000 to $24,999 | 1 | 8.3% |
| $25,000 to $34,999 | 2 | 16.7% |
| $35,000 to $49,999 | 0 | 0.0% |
| $50,000 to $74,999 | 0 | 0.0% |
| $75,000 to $99,999 | 5 | 41.7% |
| $100,000 to $149,999 | 1 | 8.3% |
| $150,000 to $199,999 | 0 | 0.0% |
| $200,000+ | 0 | 0.0% |
Household Income by Householder Age in IXL
The median household income in IXL is $0, with the highest median household income of $83,250 found in the 45 to 64 years age bracket for the primary householder. A total of 9 households (75.0%) fall into this category.
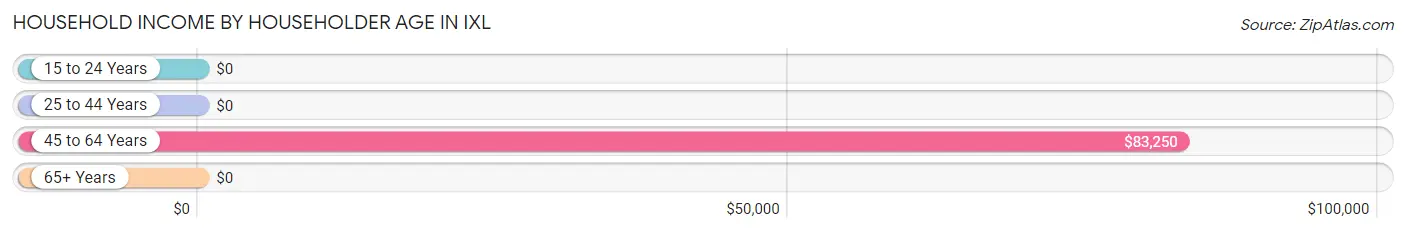
| Income Bracket | # Households | Median Income |
| 15 to 24 Years | 0 (0.0%) | $0 |
| 25 to 44 Years | 0 (0.0%) | $0 |
| 45 to 64 Years | 9 (75.0%) | $83,250 |
| 65+ Years | 3 (25.0%) | $0 |
| Total | 12 (100.0%) | $0 |
Poverty in IXL
Income Below Poverty by Sex and Age in IXL
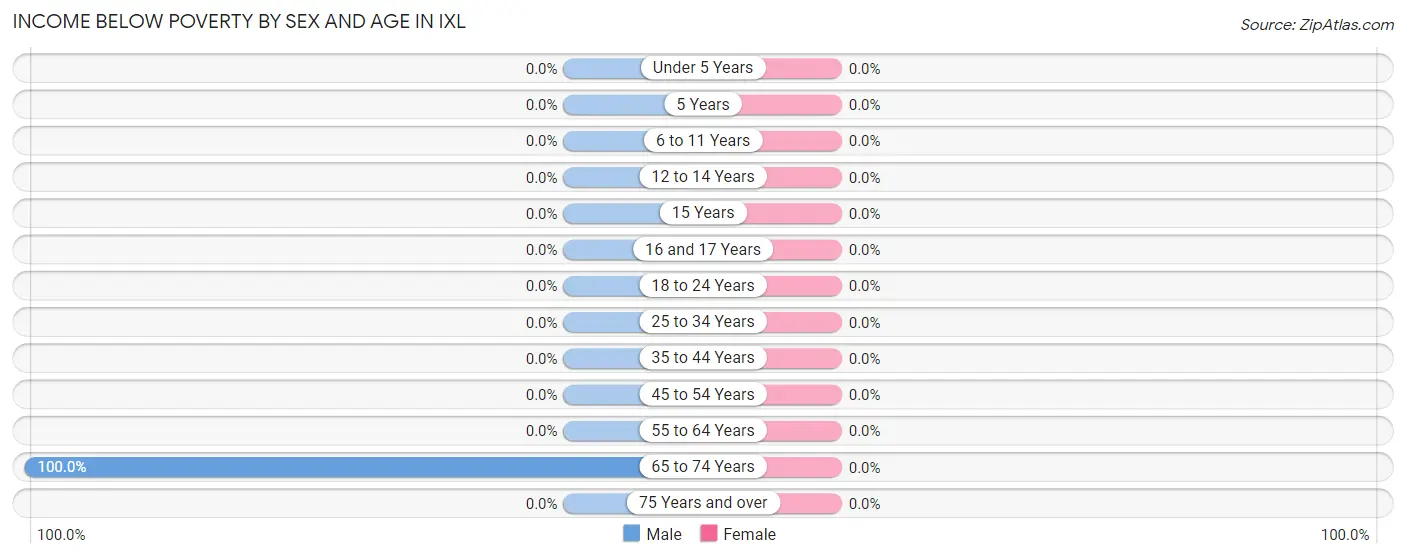
| Age Bracket | Male | Female |
| Under 5 Years | 0 (0.0%) | 0 (0.0%) |
| 5 Years | 0 (0.0%) | 0 (0.0%) |
| 6 to 11 Years | 0 (0.0%) | 0 (0.0%) |
| 12 to 14 Years | 0 (0.0%) | 0 (0.0%) |
| 15 Years | 0 (0.0%) | 0 (0.0%) |
| 16 and 17 Years | 0 (0.0%) | 0 (0.0%) |
| 18 to 24 Years | 0 (0.0%) | 0 (0.0%) |
| 25 to 34 Years | 0 (0.0%) | 0 (0.0%) |
| 35 to 44 Years | 0 (0.0%) | 0 (0.0%) |
| 45 to 54 Years | 0 (0.0%) | 0 (0.0%) |
| 55 to 64 Years | 0 (0.0%) | 0 (0.0%) |
| 65 to 74 Years | 3 (100.0%) | 0 (0.0%) |
| 75 Years and over | 0 (0.0%) | 0 (0.0%) |
| Total | 3 (18.8%) | 0 (0.0%) |
Income Above Poverty by Sex and Age in IXL
According to the poverty statistics in IXL, males aged under 5 years and females aged 18 to 24 years are the age groups that are most secure financially, with 100.0% of males and 100.0% of females in these age groups living above the poverty line.
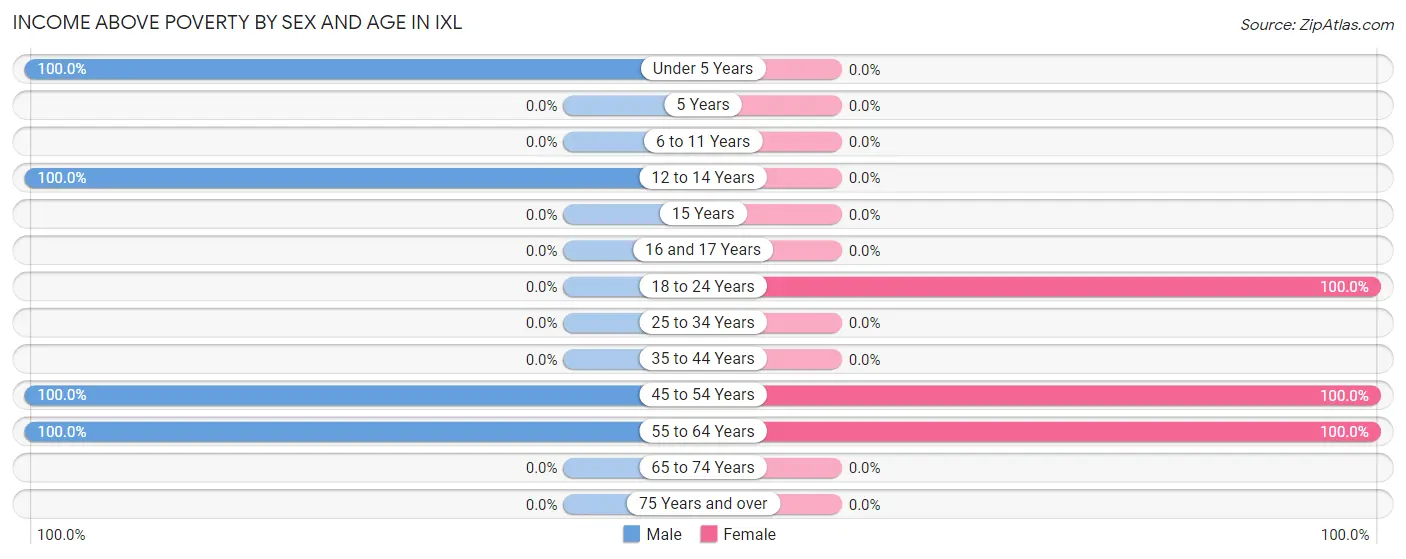
| Age Bracket | Male | Female |
| Under 5 Years | 5 (100.0%) | 0 (0.0%) |
| 5 Years | 0 (0.0%) | 0 (0.0%) |
| 6 to 11 Years | 0 (0.0%) | 0 (0.0%) |
| 12 to 14 Years | 2 (100.0%) | 0 (0.0%) |
| 15 Years | 0 (0.0%) | 0 (0.0%) |
| 16 and 17 Years | 0 (0.0%) | 0 (0.0%) |
| 18 to 24 Years | 0 (0.0%) | 6 (100.0%) |
| 25 to 34 Years | 0 (0.0%) | 0 (0.0%) |
| 35 to 44 Years | 0 (0.0%) | 0 (0.0%) |
| 45 to 54 Years | 1 (100.0%) | 6 (100.0%) |
| 55 to 64 Years | 5 (100.0%) | 2 (100.0%) |
| 65 to 74 Years | 0 (0.0%) | 0 (0.0%) |
| 75 Years and over | 0 (0.0%) | 0 (0.0%) |
| Total | 13 (81.2%) | 14 (100.0%) |
Income Below Poverty Among Married-Couple Families in IXL
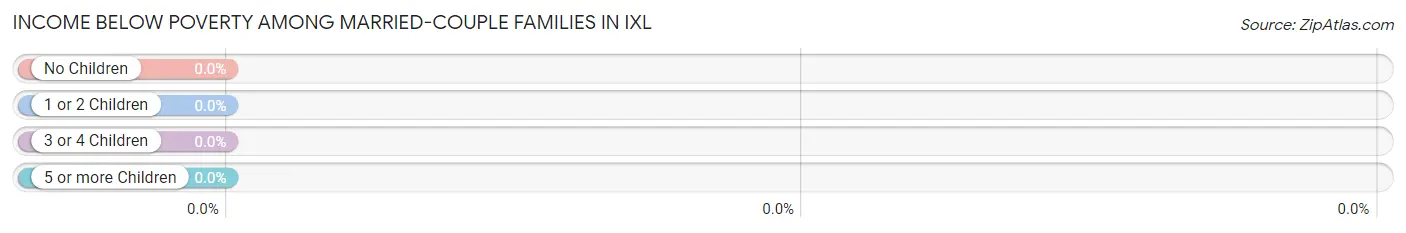
| Children | Above Poverty | Below Poverty |
| No Children | 2 (100.0%) | 0 (0.0%) |
| 1 or 2 Children | 6 (100.0%) | 0 (0.0%) |
| 3 or 4 Children | 0 (0.0%) | 0 (0.0%) |
| 5 or more Children | 0 (0.0%) | 0 (0.0%) |
| Total | 8 (100.0%) | 0 (0.0%) |
Income Below Poverty Among Single-Parent Households in IXL
| Children | Single Father | Single Mother |
| No Children | 0 (0.0%) | 0 (0.0%) |
| 1 or 2 Children | 0 (0.0%) | 0 (0.0%) |
| 3 or 4 Children | 0 (0.0%) | 0 (0.0%) |
| 5 or more Children | 0 (0.0%) | 0 (0.0%) |
| Total | 0 (0.0%) | 0 (0.0%) |
Income Below Poverty Among Married-Couple vs Single-Parent Households in IXL
| Children | Married-Couple Families | Single-Parent Households |
| No Children | 0 (0.0%) | 0 (0.0%) |
| 1 or 2 Children | 0 (0.0%) | 0 (0.0%) |
| 3 or 4 Children | 0 (0.0%) | 0 (0.0%) |
| 5 or more Children | 0 (0.0%) | 0 (0.0%) |
| Total | 0 (0.0%) | 0 (0.0%) |
Race in IXL
The most populous races in IXL are Black / African American (17 | 56.7%), Two or more Races (6 | 20.0%), and Native / Alaskan (5 | 16.7%).
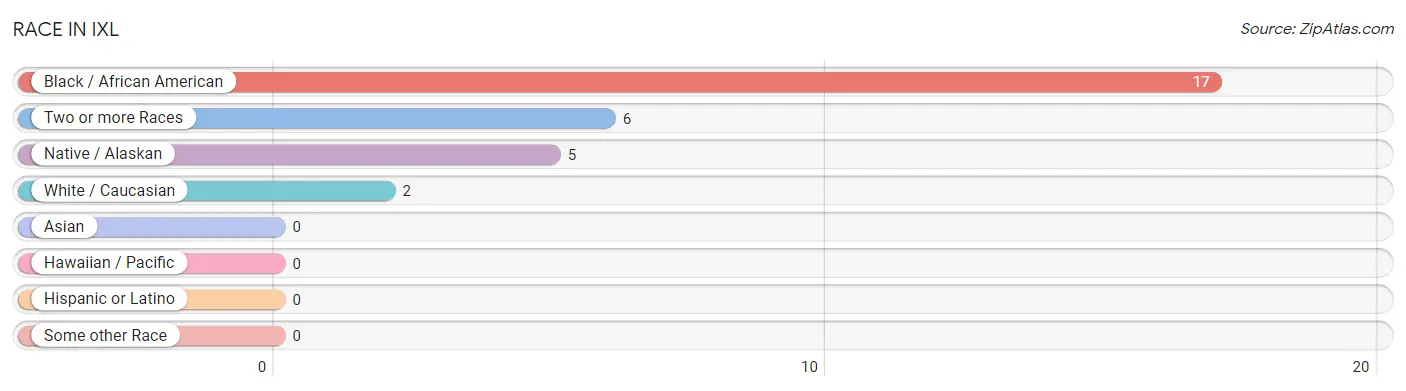
| Race | # Population | % Population |
| Asian | 0 | 0.0% |
| Black / African American | 17 | 56.7% |
| Hawaiian / Pacific | 0 | 0.0% |
| Hispanic or Latino | 0 | 0.0% |
| Native / Alaskan | 5 | 16.7% |
| White / Caucasian | 2 | 6.7% |
| Two or more Races | 6 | 20.0% |
| Some other Race | 0 | 0.0% |
| Total | 30 | 100.0% |
Ancestry in IXL
The most populous ancestries reported in IXL are Cherokee (5 | 16.7%), Creek (1 | 3.3%), and Scottish (1 | 3.3%), together accounting for 23.3% of all IXL residents.
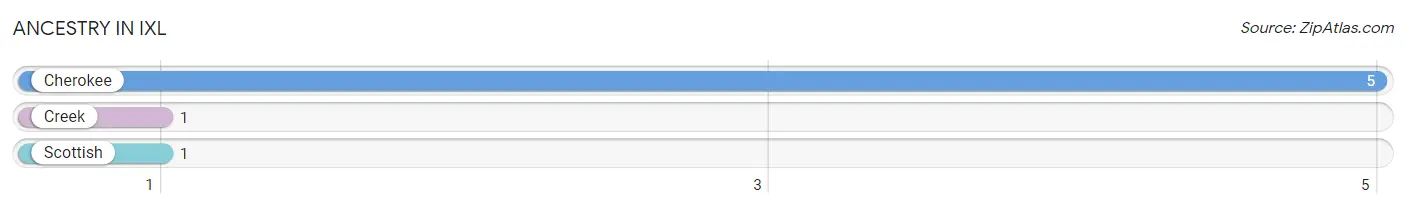
| Ancestry | # Population | % Population |
| Cherokee | 5 | 16.7% |
| Creek | 1 | 3.3% |
| Scottish | 1 | 3.3% | View All 3 Rows |
Immigrants in IXL

| Immigration Origin | # Population | % Population | View All 0 Rows |
Sex and Age in IXL
Sex and Age in IXL
The most populous age groups in IXL are Under 5 Years (5 | 31.2%) for men and 45 to 49 Years (6 | 42.9%) for women.
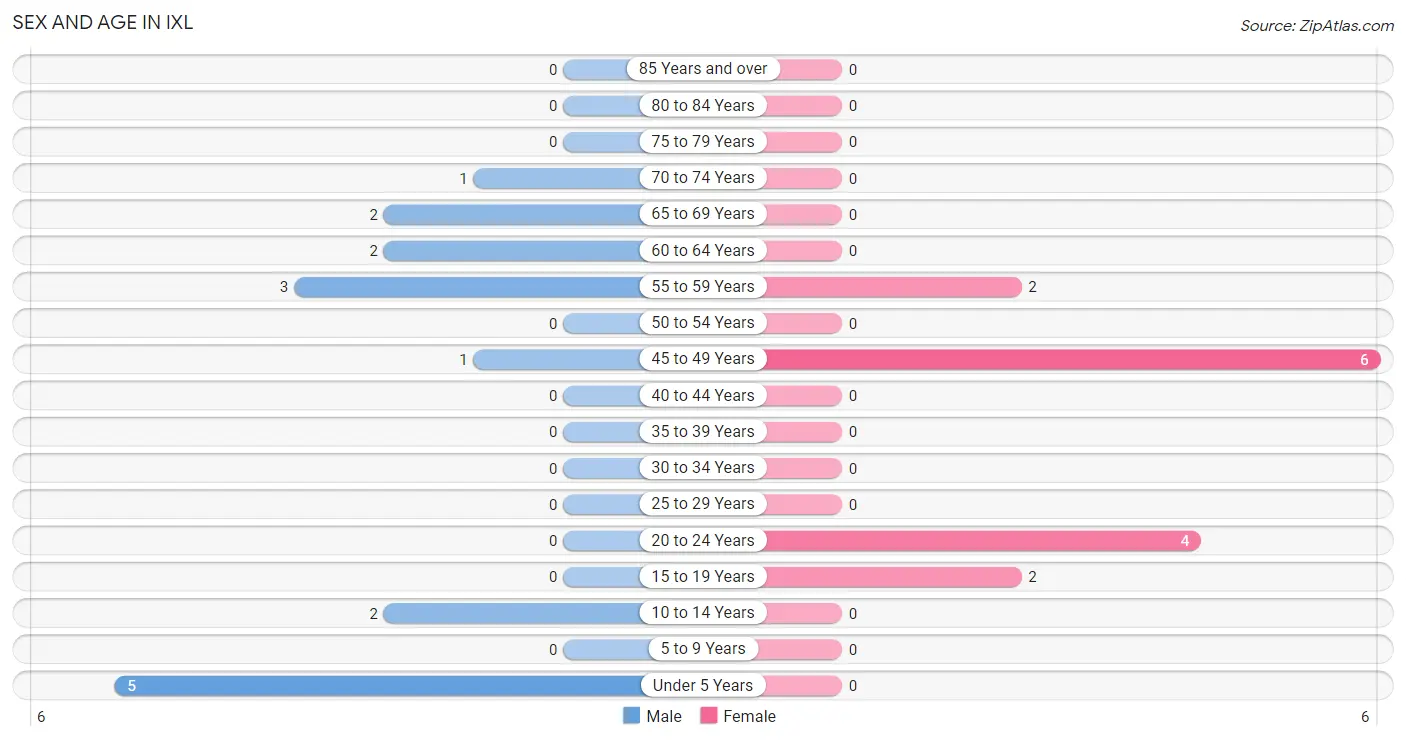
| Age Bracket | Male | Female |
| Under 5 Years | 5 (31.2%) | 0 (0.0%) |
| 5 to 9 Years | 0 (0.0%) | 0 (0.0%) |
| 10 to 14 Years | 2 (12.5%) | 0 (0.0%) |
| 15 to 19 Years | 0 (0.0%) | 2 (14.3%) |
| 20 to 24 Years | 0 (0.0%) | 4 (28.6%) |
| 25 to 29 Years | 0 (0.0%) | 0 (0.0%) |
| 30 to 34 Years | 0 (0.0%) | 0 (0.0%) |
| 35 to 39 Years | 0 (0.0%) | 0 (0.0%) |
| 40 to 44 Years | 0 (0.0%) | 0 (0.0%) |
| 45 to 49 Years | 1 (6.2%) | 6 (42.9%) |
| 50 to 54 Years | 0 (0.0%) | 0 (0.0%) |
| 55 to 59 Years | 3 (18.8%) | 2 (14.3%) |
| 60 to 64 Years | 2 (12.5%) | 0 (0.0%) |
| 65 to 69 Years | 2 (12.5%) | 0 (0.0%) |
| 70 to 74 Years | 1 (6.2%) | 0 (0.0%) |
| 75 to 79 Years | 0 (0.0%) | 0 (0.0%) |
| 80 to 84 Years | 0 (0.0%) | 0 (0.0%) |
| 85 Years and over | 0 (0.0%) | 0 (0.0%) |
| Total | 16 (100.0%) | 14 (100.0%) |
Families and Households in IXL
Median Family Size in IXL
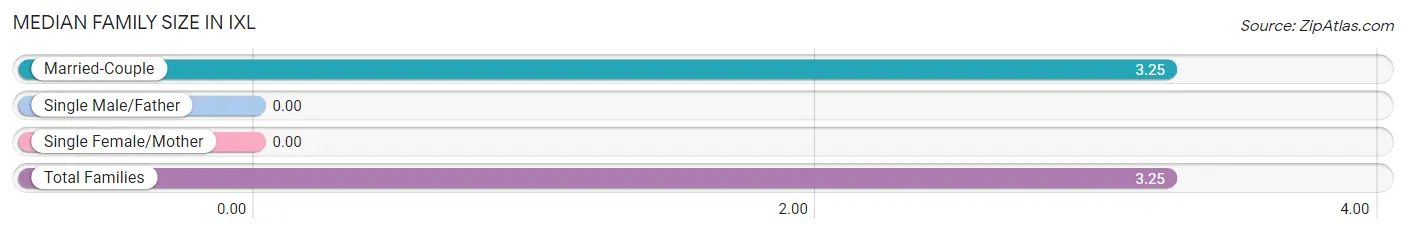
| Family Type | # Families | Family Size |
| Married-Couple | 8 (100.0%) | 3.25 |
| Single Male/Father | 0 (0.0%) | - |
| Single Female/Mother | 0 (0.0%) | - |
| Total Families | 8 (100.0%) | 3.25 |
Median Household Size in IXL
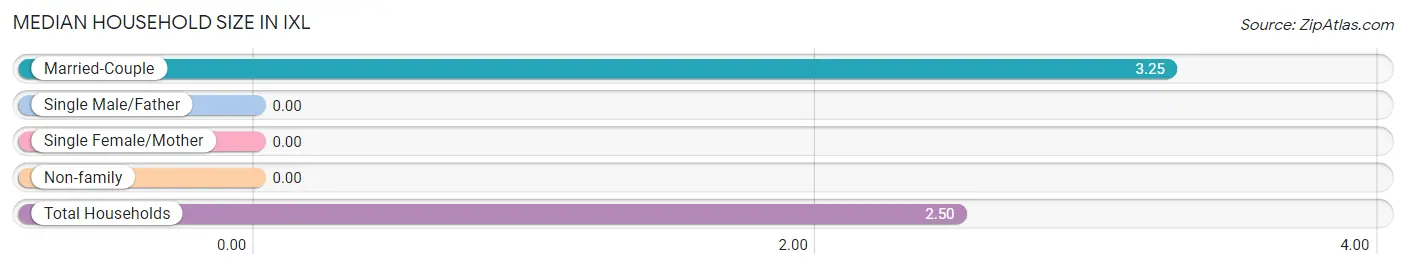
| Household Type | # Households | Household Size |
| Married-Couple | 8 (66.7%) | 3.25 |
| Single Male/Father | 0 (0.0%) | - |
| Single Female/Mother | 0 (0.0%) | - |
| Non-family | 4 (33.3%) | - |
| Total Households | 12 (100.0%) | 2.50 |
Household Size by Marriage Status in IXL
Out of a total of 12 households in IXL, 8 (66.7%) are family households, while 4 (33.3%) are nonfamily households. The most numerous type of family households are 4-person households, comprising 6, and the most common type of nonfamily households are 1-person households, comprising 4.
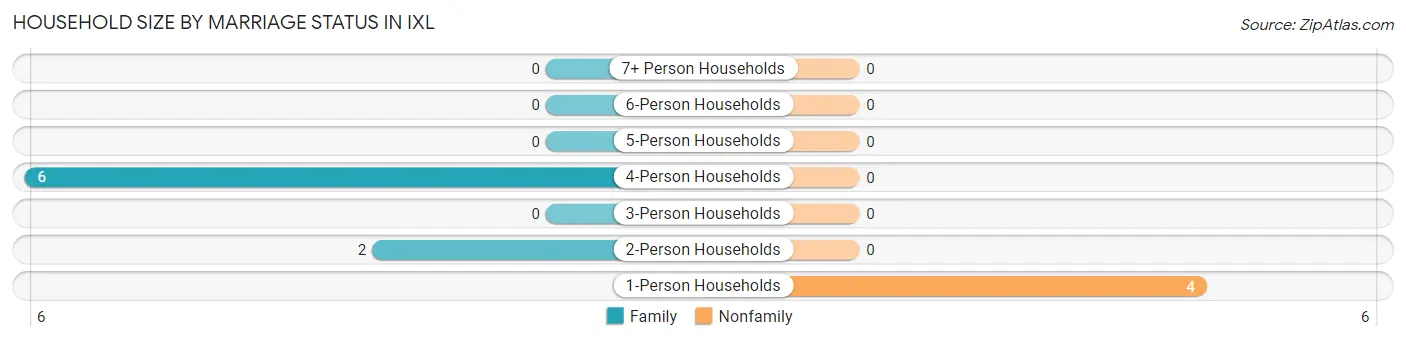
| Household Size | Family Households | Nonfamily Households |
| 1-Person Households | - | 4 (33.3%) |
| 2-Person Households | 2 (16.7%) | 0 (0.0%) |
| 3-Person Households | 0 (0.0%) | 0 (0.0%) |
| 4-Person Households | 6 (50.0%) | 0 (0.0%) |
| 5-Person Households | 0 (0.0%) | 0 (0.0%) |
| 6-Person Households | 0 (0.0%) | 0 (0.0%) |
| 7+ Person Households | 0 (0.0%) | 0 (0.0%) |
| Total | 8 (66.7%) | 4 (33.3%) |
Female Fertility in IXL
Fertility by Age in IXL
| Age Bracket | Women with Births | Births / 1,000 Women |
| 15 to 19 years | 0 (0.0%) | 0.0 |
| 20 to 34 years | 0 (0.0%) | 0.0 |
| 35 to 50 years | 0 (0.0%) | 0.0 |
| Total | 0 (0.0%) | 0.0 |
Fertility by Age by Marriage Status in IXL
| Age Bracket | Married | Unmarried |
| 15 to 19 years | 0 (0.0%) | 0 (0.0%) |
| 20 to 34 years | 0 (0.0%) | 0 (0.0%) |
| 35 to 50 years | 0 (0.0%) | 0 (0.0%) |
| Total | 0 (0.0%) | 0 (0.0%) |
Fertility by Education in IXL
| Educational Attainment | Women with Births | Births / 1,000 Women |
| Less than High School | 0 (0.0%) | 0.0 |
| High School Diploma | 0 (0.0%) | 0.0 |
| College or Associate's Degree | 0 (0.0%) | 0.0 |
| Bachelor's Degree | 0 (0.0%) | 0.0 |
| Graduate Degree | 0 (0.0%) | 0.0 |
| Total | 0 (0.0%) | 0.0 |
Fertility by Education by Marriage Status in IXL
| Educational Attainment | Married | Unmarried |
| Less than High School | 0 (0.0%) | 0 (0.0%) |
| High School Diploma | 0 (0.0%) | 0 (0.0%) |
| College or Associate's Degree | 0 (0.0%) | 0 (0.0%) |
| Bachelor's Degree | 0 (0.0%) | 0 (0.0%) |
| Graduate Degree | 0 (0.0%) | 0 (0.0%) |
| Total | 0 (0.0%) | 0 (0.0%) |
Employment Characteristics in IXL
Employment by Class of Employer in IXL
Among the 13 employed individuals in IXL, private company employees (7 | 53.8%), and local government employees (6 | 46.2%) make up the most common classes of employment.
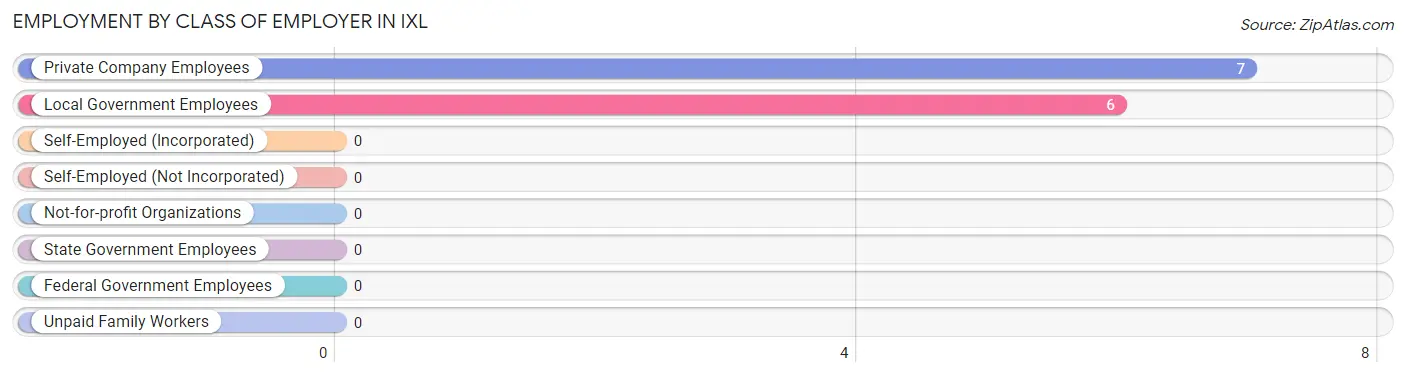
| Employer Class | # Employees | % Employees |
| Private Company Employees | 7 | 53.8% |
| Self-Employed (Incorporated) | 0 | 0.0% |
| Self-Employed (Not Incorporated) | 0 | 0.0% |
| Not-for-profit Organizations | 0 | 0.0% |
| Local Government Employees | 6 | 46.2% |
| State Government Employees | 0 | 0.0% |
| Federal Government Employees | 0 | 0.0% |
| Unpaid Family Workers | 0 | 0.0% |
| Total | 13 | 100.0% |
Employment Status by Age in IXL
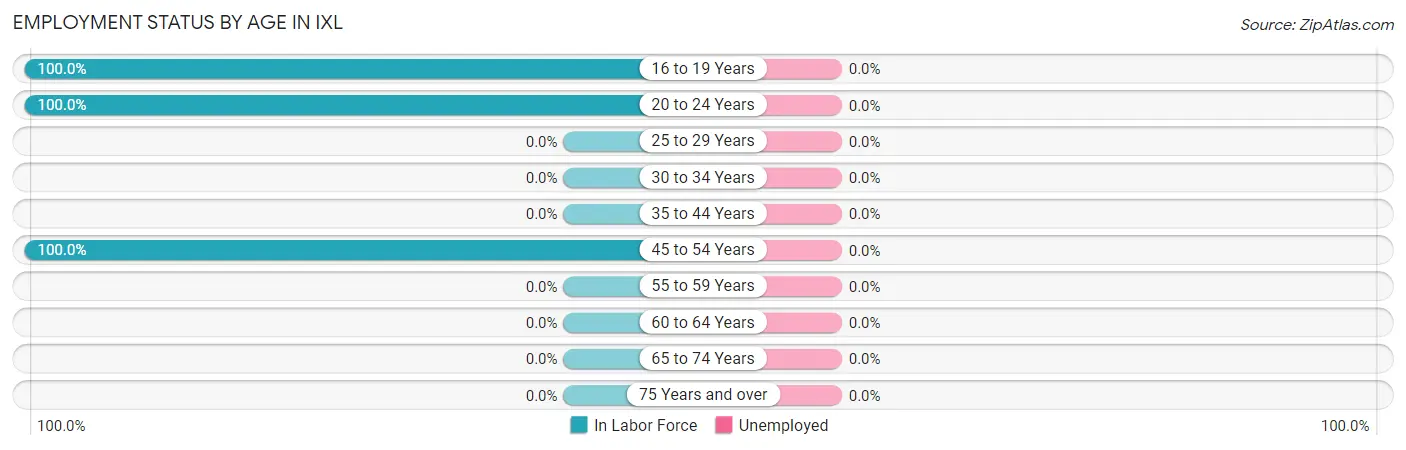
| Age Bracket | In Labor Force | Unemployed |
| 16 to 19 Years | 2 (100.0%) | 0 (0.0%) |
| 20 to 24 Years | 4 (100.0%) | 0 (0.0%) |
| 25 to 29 Years | 0 (0.0%) | 0 (0.0%) |
| 30 to 34 Years | 0 (0.0%) | 0 (0.0%) |
| 35 to 44 Years | 0 (0.0%) | 0 (0.0%) |
| 45 to 54 Years | 7 (100.0%) | 0 (0.0%) |
| 55 to 59 Years | 0 (0.0%) | 0 (0.0%) |
| 60 to 64 Years | 0 (0.0%) | 0 (0.0%) |
| 65 to 74 Years | 0 (0.0%) | 0 (0.0%) |
| 75 Years and over | 0 (0.0%) | 0 (0.0%) |
| Total | 13 (56.5%) | 0 (0.0%) |
Employment Status by Educational Attainment in IXL
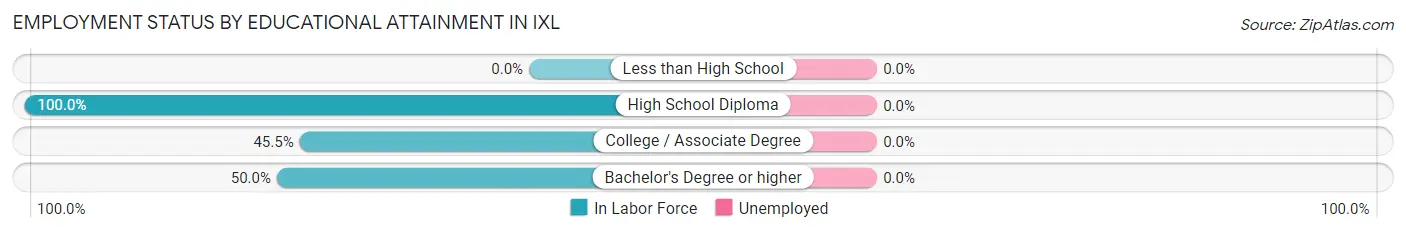
| Educational Attainment | In Labor Force | Unemployed |
| Less than High School | 0 (0.0%) | 0 (0.0%) |
| High School Diploma | 1 (100.0%) | 0 (0.0%) |
| College / Associate Degree | 5 (45.5%) | 0 (0.0%) |
| Bachelor's Degree or higher | 1 (50.0%) | 0 (0.0%) |
| Total | 7 (50.0%) | 0 (0.0%) |
Employment Occupations by Sex in IXL
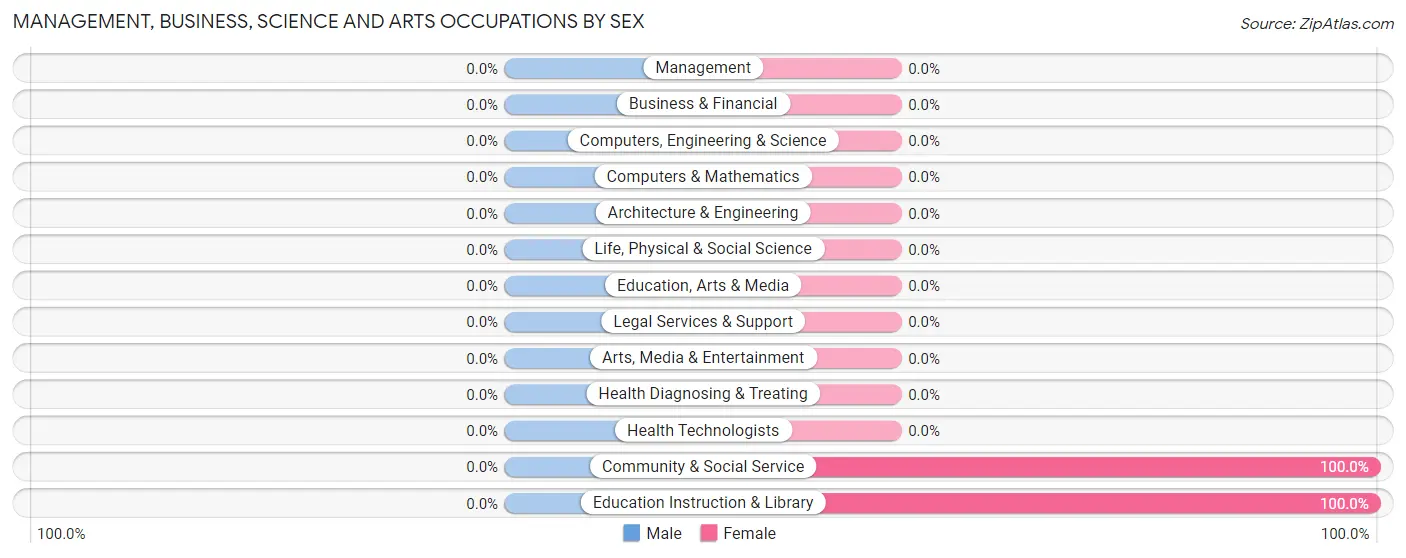
Management, Business, Science and Arts Occupations
The most common Management, Business, Science and Arts occupations in IXL are Community & Social Service (1 | 7.7%), and Education Instruction & Library (1 | 7.7%).
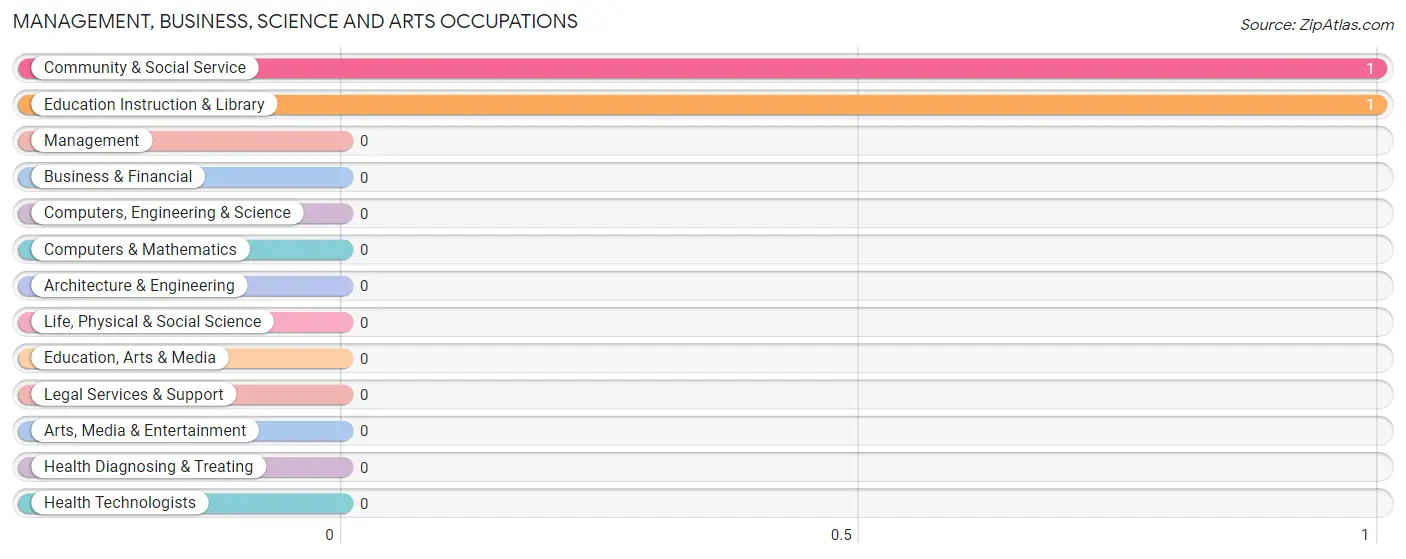
Management, Business, Science and Arts Occupations by Sex
| Occupation | Male | Female |
| Management | 0 (0.0%) | 0 (0.0%) |
| Business & Financial | 0 (0.0%) | 0 (0.0%) |
| Computers, Engineering & Science | 0 (0.0%) | 0 (0.0%) |
| Computers & Mathematics | 0 (0.0%) | 0 (0.0%) |
| Architecture & Engineering | 0 (0.0%) | 0 (0.0%) |
| Life, Physical & Social Science | 0 (0.0%) | 0 (0.0%) |
| Community & Social Service | 0 (0.0%) | 1 (100.0%) |
| Education, Arts & Media | 0 (0.0%) | 0 (0.0%) |
| Legal Services & Support | 0 (0.0%) | 0 (0.0%) |
| Education Instruction & Library | 0 (0.0%) | 1 (100.0%) |
| Arts, Media & Entertainment | 0 (0.0%) | 0 (0.0%) |
| Health Diagnosing & Treating | 0 (0.0%) | 0 (0.0%) |
| Health Technologists | 0 (0.0%) | 0 (0.0%) |
| Total (Category) | 0 (0.0%) | 1 (100.0%) |
| Total (Overall) | 1 (7.7%) | 12 (92.3%) |
Services Occupations
The most common Services occupations in IXL are Security & Protection (5 | 38.5%), and Law Enforcement (5 | 38.5%).
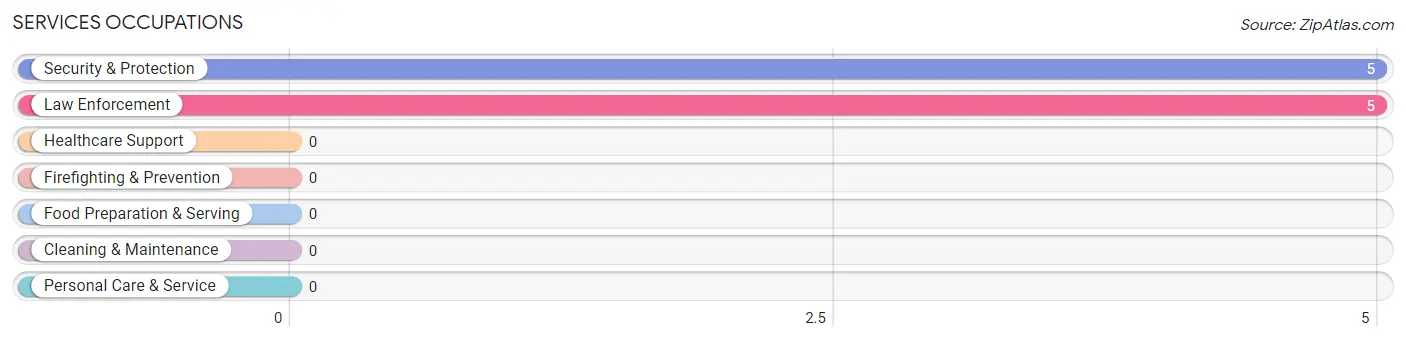
Services Occupations by Sex
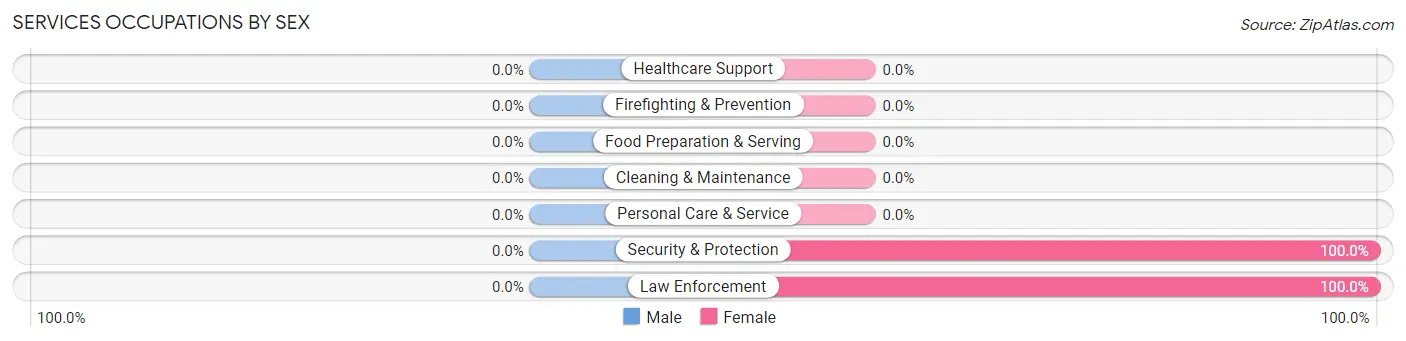
| Occupation | Male | Female |
| Healthcare Support | 0 (0.0%) | 0 (0.0%) |
| Security & Protection | 0 (0.0%) | 5 (100.0%) |
| Firefighting & Prevention | 0 (0.0%) | 0 (0.0%) |
| Law Enforcement | 0 (0.0%) | 5 (100.0%) |
| Food Preparation & Serving | 0 (0.0%) | 0 (0.0%) |
| Cleaning & Maintenance | 0 (0.0%) | 0 (0.0%) |
| Personal Care & Service | 0 (0.0%) | 0 (0.0%) |
| Total (Category) | 0 (0.0%) | 5 (100.0%) |
| Total (Overall) | 1 (7.7%) | 12 (92.3%) |
Sales and Office Occupations
The most common Sales and Office occupations in IXL are , and Office & Administration (4 | 30.8%).
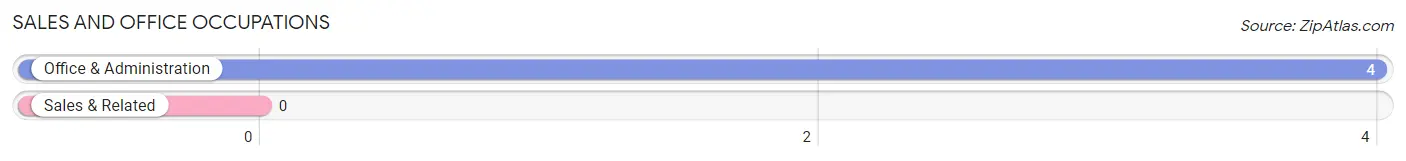
Sales and Office Occupations by Sex
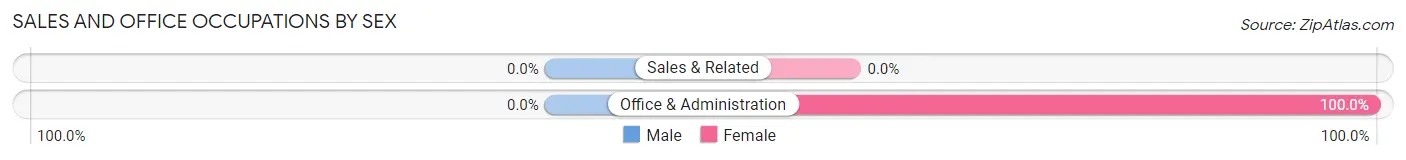
| Occupation | Male | Female |
| Sales & Related | 0 (0.0%) | 0 (0.0%) |
| Office & Administration | 0 (0.0%) | 4 (100.0%) |
| Total (Category) | 0 (0.0%) | 4 (100.0%) |
| Total (Overall) | 1 (7.7%) | 12 (92.3%) |
Natural Resources, Construction and Maintenance Occupations
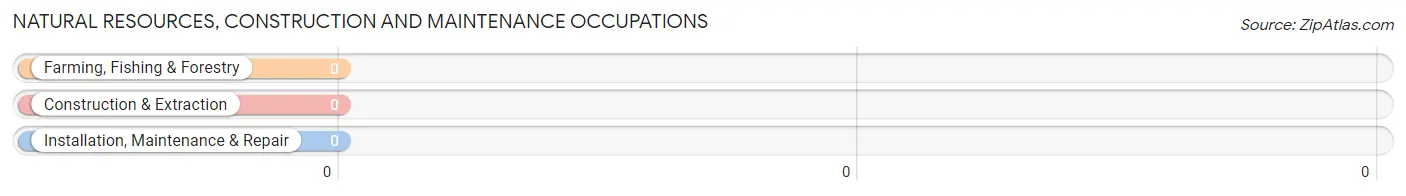
Natural Resources, Construction and Maintenance Occupations by Sex
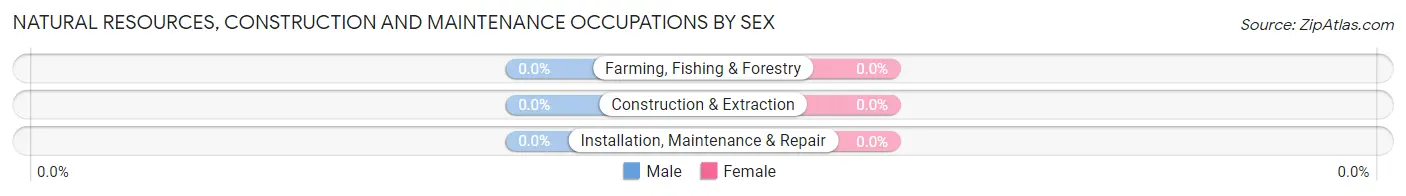
| Occupation | Male | Female |
| Farming, Fishing & Forestry | 0 (0.0%) | 0 (0.0%) |
| Construction & Extraction | 0 (0.0%) | 0 (0.0%) |
| Installation, Maintenance & Repair | 0 (0.0%) | 0 (0.0%) |
| Total (Category) | 0 (0.0%) | 0 (0.0%) |
| Total (Overall) | 1 (7.7%) | 12 (92.3%) |
Production, Transportation and Moving Occupations
The most common Production, Transportation and Moving occupations in IXL are Production (2 | 15.4%), and Transportation (1 | 7.7%).
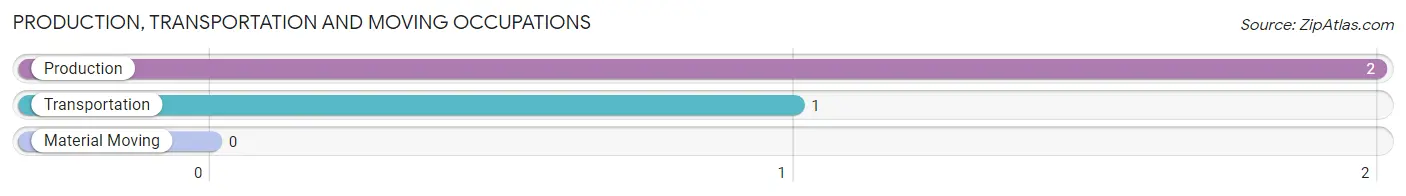
Production, Transportation and Moving Occupations by Sex
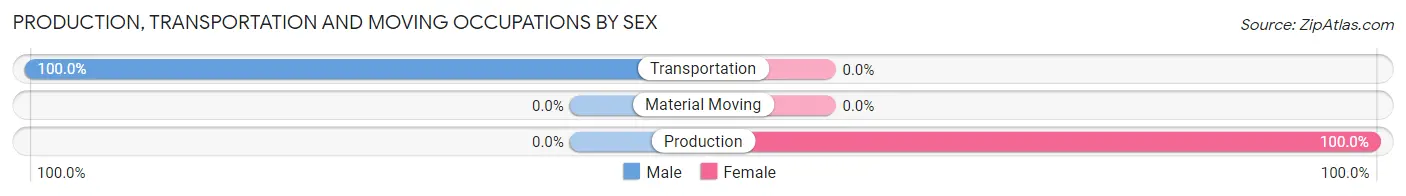
| Occupation | Male | Female |
| Production | 0 (0.0%) | 2 (100.0%) |
| Transportation | 1 (100.0%) | 0 (0.0%) |
| Material Moving | 0 (0.0%) | 0 (0.0%) |
| Total (Category) | 1 (33.3%) | 2 (66.7%) |
| Total (Overall) | 1 (7.7%) | 12 (92.3%) |
Employment Industries by Sex in IXL
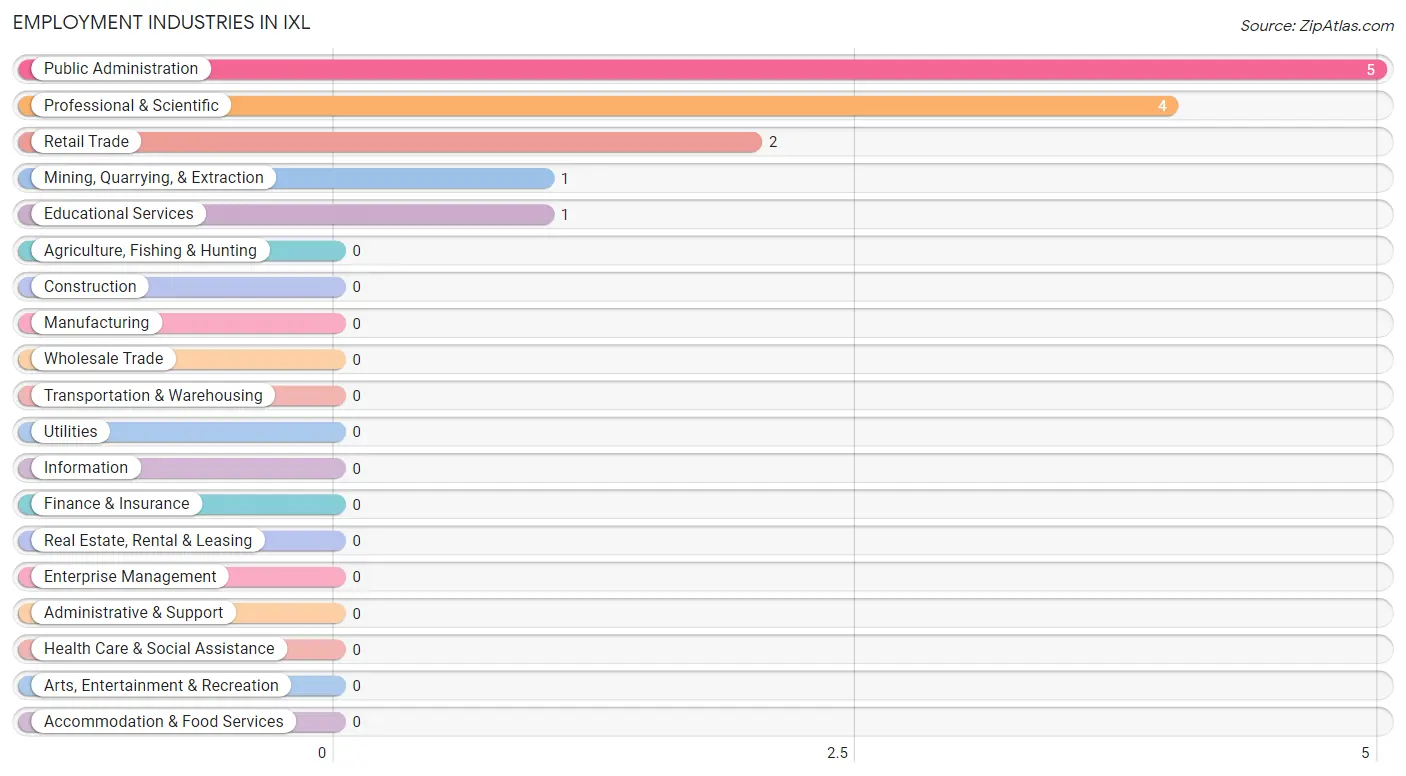
Employment Industries in IXL
The major employment industries in IXL include Public Administration (5 | 38.5%), Professional & Scientific (4 | 30.8%), Retail Trade (2 | 15.4%), Mining, Quarrying, & Extraction (1 | 7.7%), and Educational Services (1 | 7.7%).
Employment Industries by Sex in IXL
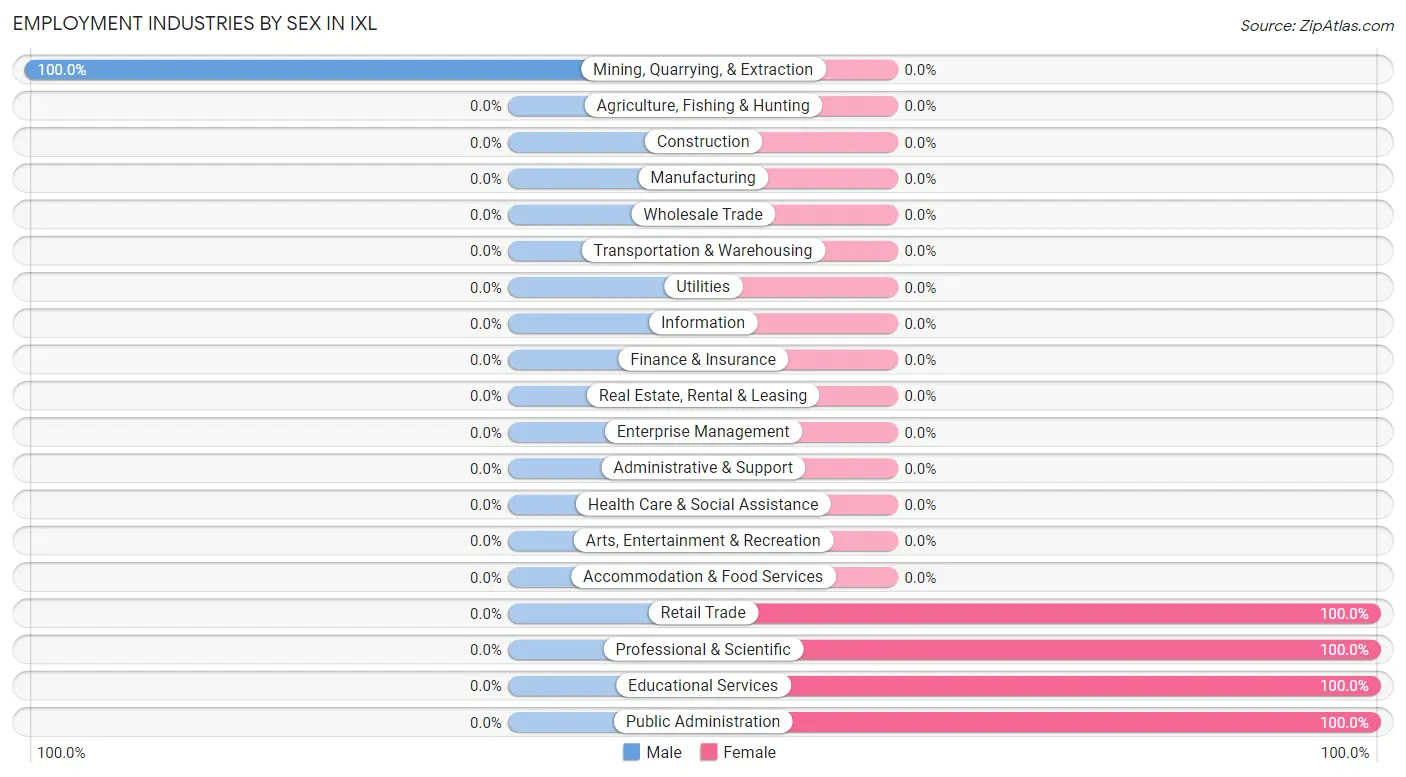
| Industry | Male | Female |
| Agriculture, Fishing & Hunting | 0 (0.0%) | 0 (0.0%) |
| Mining, Quarrying, & Extraction | 1 (100.0%) | 0 (0.0%) |
| Construction | 0 (0.0%) | 0 (0.0%) |
| Manufacturing | 0 (0.0%) | 0 (0.0%) |
| Wholesale Trade | 0 (0.0%) | 0 (0.0%) |
| Retail Trade | 0 (0.0%) | 2 (100.0%) |
| Transportation & Warehousing | 0 (0.0%) | 0 (0.0%) |
| Utilities | 0 (0.0%) | 0 (0.0%) |
| Information | 0 (0.0%) | 0 (0.0%) |
| Finance & Insurance | 0 (0.0%) | 0 (0.0%) |
| Real Estate, Rental & Leasing | 0 (0.0%) | 0 (0.0%) |
| Professional & Scientific | 0 (0.0%) | 4 (100.0%) |
| Enterprise Management | 0 (0.0%) | 0 (0.0%) |
| Administrative & Support | 0 (0.0%) | 0 (0.0%) |
| Educational Services | 0 (0.0%) | 1 (100.0%) |
| Health Care & Social Assistance | 0 (0.0%) | 0 (0.0%) |
| Arts, Entertainment & Recreation | 0 (0.0%) | 0 (0.0%) |
| Accommodation & Food Services | 0 (0.0%) | 0 (0.0%) |
| Public Administration | 0 (0.0%) | 5 (100.0%) |
| Total | 1 (7.7%) | 12 (92.3%) |
Education in IXL
School Enrollment in IXL
The most common levels of schooling among the 4 students in IXL are middle school (2 | 50.0%), and high school (2 | 50.0%).
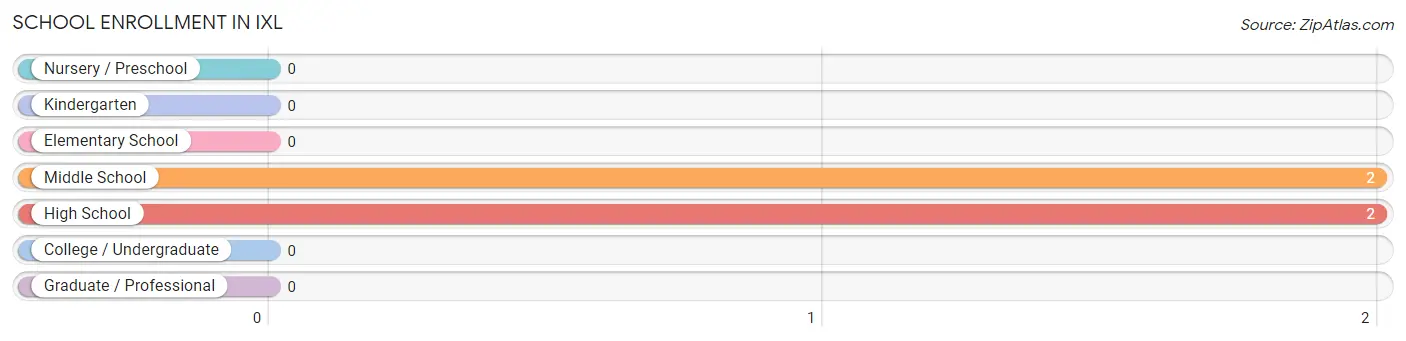
| School Level | # Students | % Students |
| Nursery / Preschool | 0 | 0.0% |
| Kindergarten | 0 | 0.0% |
| Elementary School | 0 | 0.0% |
| Middle School | 2 | 50.0% |
| High School | 2 | 50.0% |
| College / Undergraduate | 0 | 0.0% |
| Graduate / Professional | 0 | 0.0% |
| Total | 4 | 100.0% |
School Enrollment by Age by Funding Source in IXL
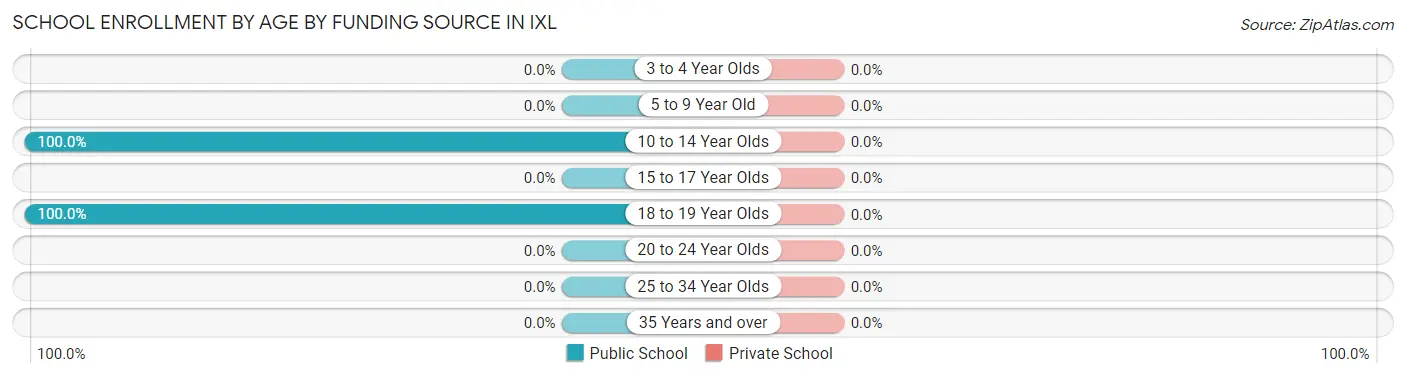
| Age Bracket | Public School | Private School |
| 3 to 4 Year Olds | 0 (0.0%) | 0 (0.0%) |
| 5 to 9 Year Old | 0 (0.0%) | 0 (0.0%) |
| 10 to 14 Year Olds | 2 (100.0%) | 0 (0.0%) |
| 15 to 17 Year Olds | 0 (0.0%) | 0 (0.0%) |
| 18 to 19 Year Olds | 2 (100.0%) | 0 (0.0%) |
| 20 to 24 Year Olds | 0 (0.0%) | 0 (0.0%) |
| 25 to 34 Year Olds | 0 (0.0%) | 0 (0.0%) |
| 35 Years and over | 0 (0.0%) | 0 (0.0%) |
| Total | 4 (100.0%) | 0 (0.0%) |
Educational Attainment by Field of Study in IXL
Bio, nature & agricultural (1 | 50.0%), and communications (1 | 50.0%) are the most common fields of study among 2 individuals in IXL who have obtained a bachelor's degree or higher.
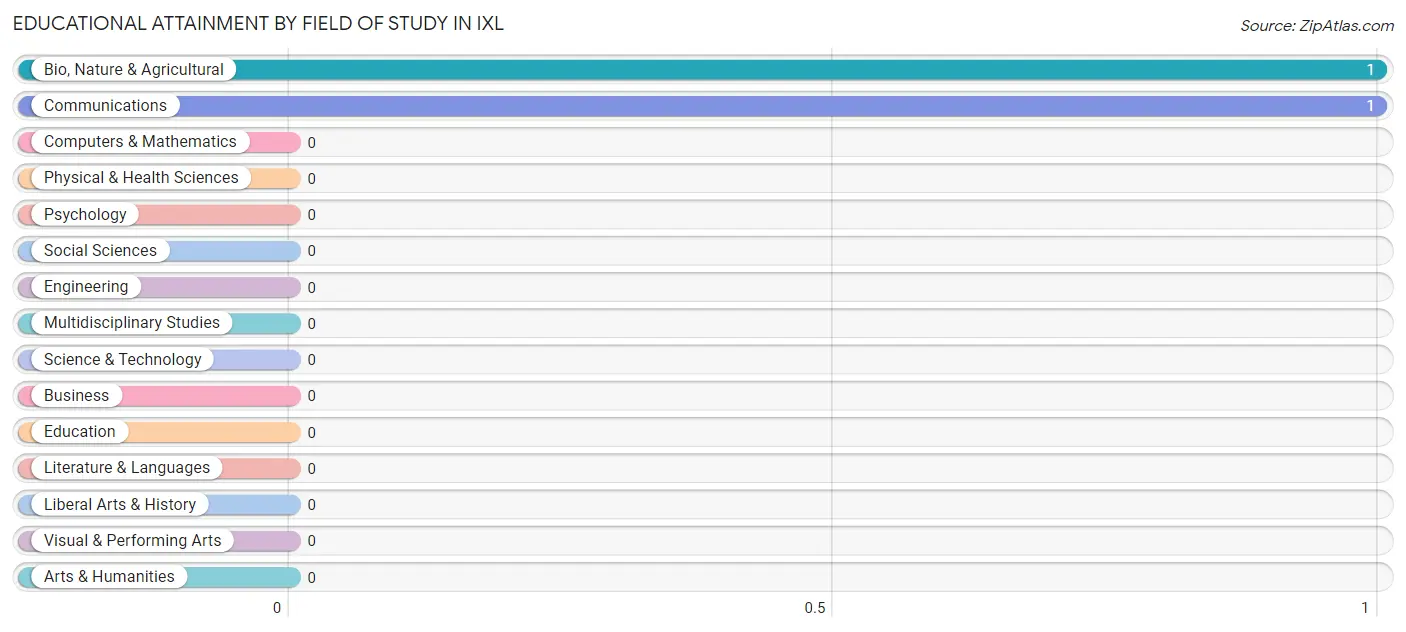
| Field of Study | # Graduates | % Graduates |
| Computers & Mathematics | 0 | 0.0% |
| Bio, Nature & Agricultural | 1 | 50.0% |
| Physical & Health Sciences | 0 | 0.0% |
| Psychology | 0 | 0.0% |
| Social Sciences | 0 | 0.0% |
| Engineering | 0 | 0.0% |
| Multidisciplinary Studies | 0 | 0.0% |
| Science & Technology | 0 | 0.0% |
| Business | 0 | 0.0% |
| Education | 0 | 0.0% |
| Literature & Languages | 0 | 0.0% |
| Liberal Arts & History | 0 | 0.0% |
| Visual & Performing Arts | 0 | 0.0% |
| Communications | 1 | 50.0% |
| Arts & Humanities | 0 | 0.0% |
| Total | 2 | 100.0% |
Transportation & Commute in IXL
Vehicle Availability by Sex in IXL
The most prevalent vehicle ownership categories in IXL are males with 5 or more vehicles (1, accounting for 100.0%) and females with 5 or more vehicles (3, making up 8.3%).
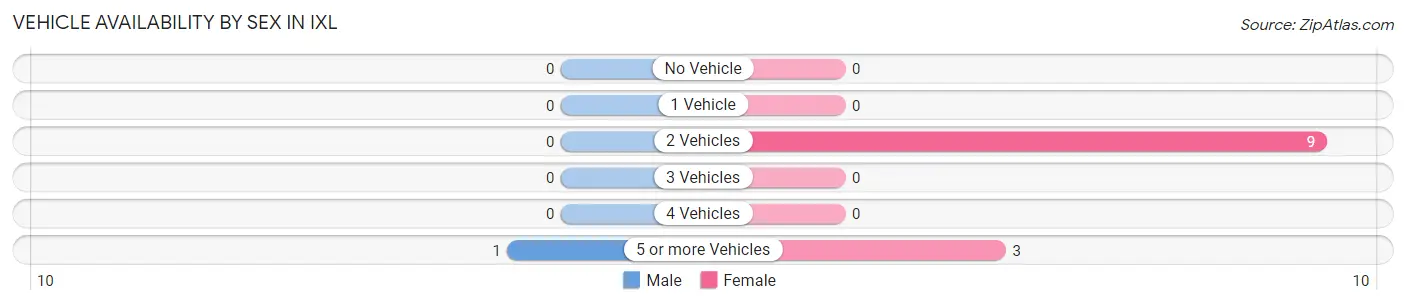
| Vehicles Available | Male | Female |
| No Vehicle | 0 (0.0%) | 0 (0.0%) |
| 1 Vehicle | 0 (0.0%) | 0 (0.0%) |
| 2 Vehicles | 0 (0.0%) | 9 (75.0%) |
| 3 Vehicles | 0 (0.0%) | 0 (0.0%) |
| 4 Vehicles | 0 (0.0%) | 0 (0.0%) |
| 5 or more Vehicles | 1 (100.0%) | 3 (25.0%) |
| Total | 1 (100.0%) | 12 (100.0%) |
Commute Time in IXL
The most frequently occuring commute durations in IXL are 10 to 14 minutes (6 commuters, 46.2%), 30 to 34 minutes (4 commuters, 30.8%), and 25 to 29 minutes (2 commuters, 15.4%).
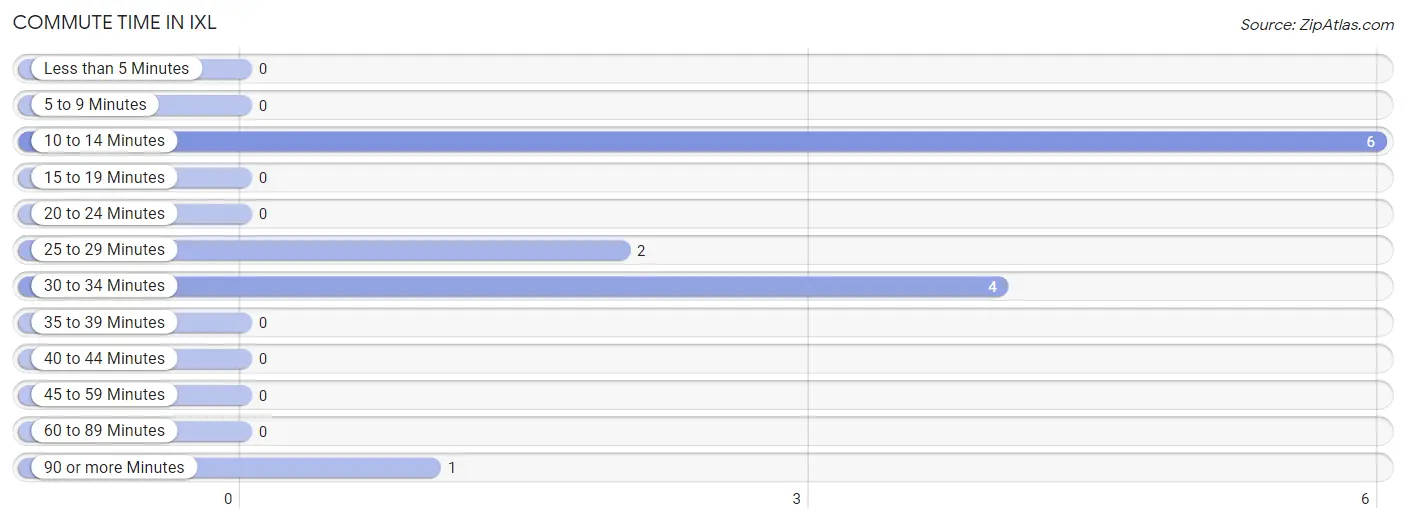
| Commute Time | # Commuters | % Commuters |
| Less than 5 Minutes | 0 | 0.0% |
| 5 to 9 Minutes | 0 | 0.0% |
| 10 to 14 Minutes | 6 | 46.2% |
| 15 to 19 Minutes | 0 | 0.0% |
| 20 to 24 Minutes | 0 | 0.0% |
| 25 to 29 Minutes | 2 | 15.4% |
| 30 to 34 Minutes | 4 | 30.8% |
| 35 to 39 Minutes | 0 | 0.0% |
| 40 to 44 Minutes | 0 | 0.0% |
| 45 to 59 Minutes | 0 | 0.0% |
| 60 to 89 Minutes | 0 | 0.0% |
| 90 or more Minutes | 1 | 7.7% |
Commute Time by Sex in IXL
The most common commute times in IXL are 90 or more minutes (1 commuters, 100.0%) for males and 10 to 14 minutes (6 commuters, 50.0%) for females.
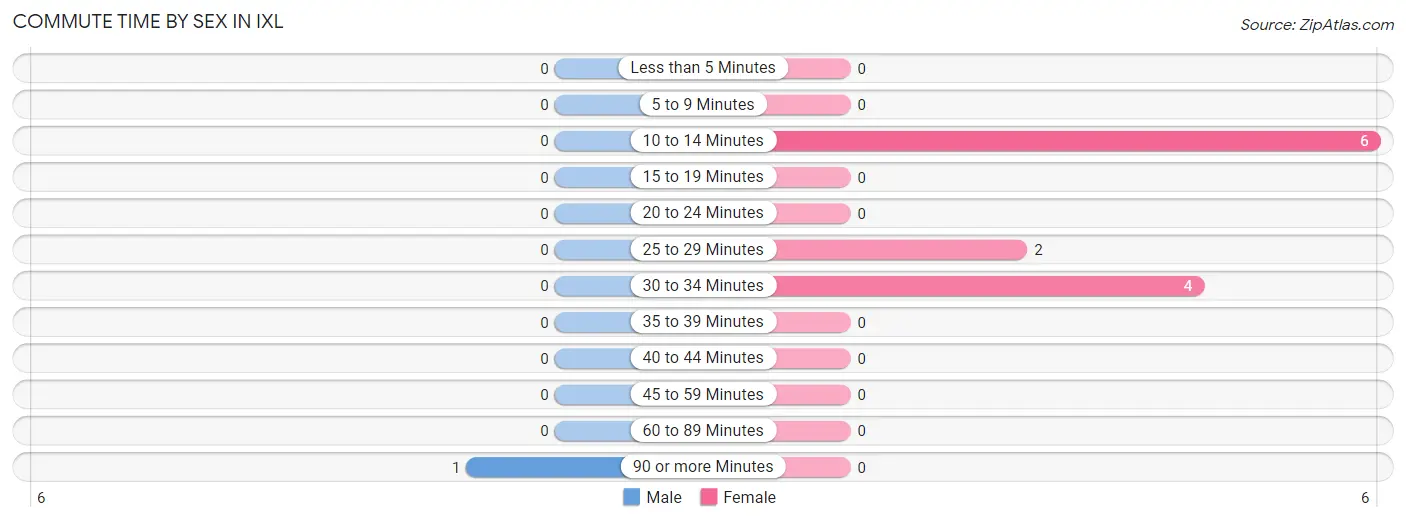
| Commute Time | Male | Female |
| Less than 5 Minutes | 0 (0.0%) | 0 (0.0%) |
| 5 to 9 Minutes | 0 (0.0%) | 0 (0.0%) |
| 10 to 14 Minutes | 0 (0.0%) | 6 (50.0%) |
| 15 to 19 Minutes | 0 (0.0%) | 0 (0.0%) |
| 20 to 24 Minutes | 0 (0.0%) | 0 (0.0%) |
| 25 to 29 Minutes | 0 (0.0%) | 2 (16.7%) |
| 30 to 34 Minutes | 0 (0.0%) | 4 (33.3%) |
| 35 to 39 Minutes | 0 (0.0%) | 0 (0.0%) |
| 40 to 44 Minutes | 0 (0.0%) | 0 (0.0%) |
| 45 to 59 Minutes | 0 (0.0%) | 0 (0.0%) |
| 60 to 89 Minutes | 0 (0.0%) | 0 (0.0%) |
| 90 or more Minutes | 1 (100.0%) | 0 (0.0%) |
Time of Departure to Work by Sex in IXL
The most frequent times of departure to work in IXL are 12:00 AM to 4:59 AM (1, 100.0%) for males and 7:00 AM to 7:29 AM (5, 41.7%) for females.
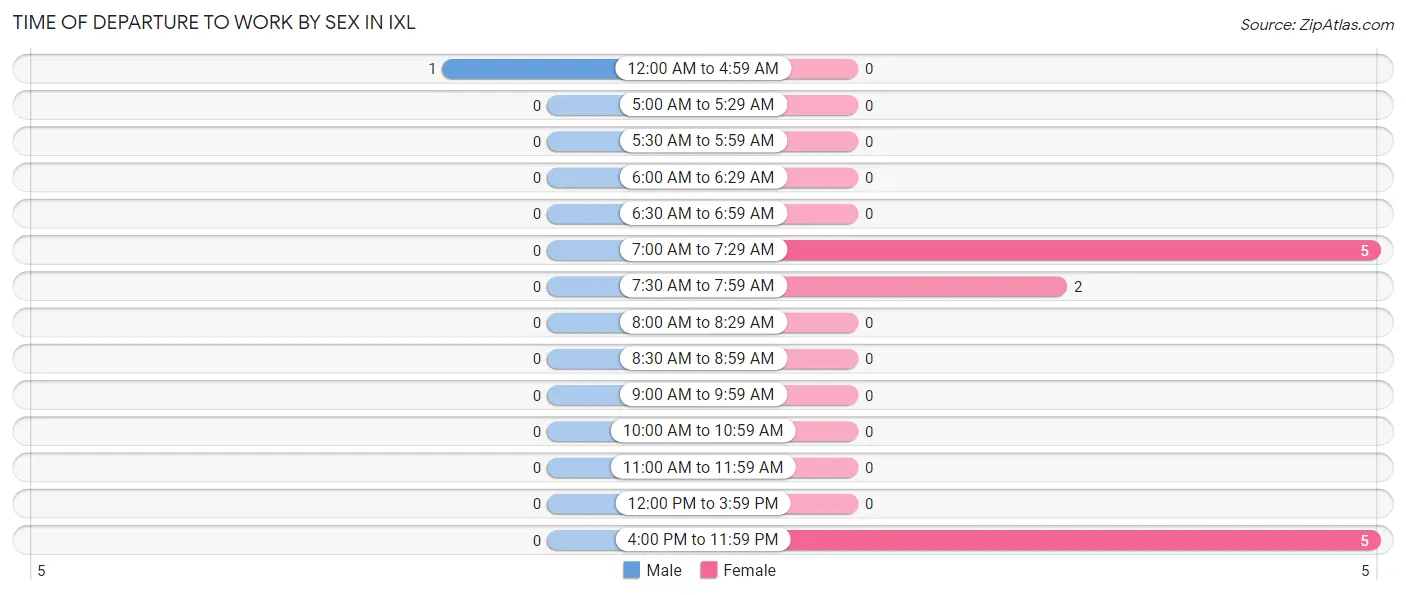
| Time of Departure | Male | Female |
| 12:00 AM to 4:59 AM | 1 (100.0%) | 0 (0.0%) |
| 5:00 AM to 5:29 AM | 0 (0.0%) | 0 (0.0%) |
| 5:30 AM to 5:59 AM | 0 (0.0%) | 0 (0.0%) |
| 6:00 AM to 6:29 AM | 0 (0.0%) | 0 (0.0%) |
| 6:30 AM to 6:59 AM | 0 (0.0%) | 0 (0.0%) |
| 7:00 AM to 7:29 AM | 0 (0.0%) | 5 (41.7%) |
| 7:30 AM to 7:59 AM | 0 (0.0%) | 2 (16.7%) |
| 8:00 AM to 8:29 AM | 0 (0.0%) | 0 (0.0%) |
| 8:30 AM to 8:59 AM | 0 (0.0%) | 0 (0.0%) |
| 9:00 AM to 9:59 AM | 0 (0.0%) | 0 (0.0%) |
| 10:00 AM to 10:59 AM | 0 (0.0%) | 0 (0.0%) |
| 11:00 AM to 11:59 AM | 0 (0.0%) | 0 (0.0%) |
| 12:00 PM to 3:59 PM | 0 (0.0%) | 0 (0.0%) |
| 4:00 PM to 11:59 PM | 0 (0.0%) | 5 (41.7%) |
| Total | 1 (100.0%) | 12 (100.0%) |
Housing Occupancy in IXL
Occupancy by Ownership in IXL
Of the total 12 dwellings in IXL, owner-occupied units account for 8 (66.7%), while renter-occupied units make up 4 (33.3%).
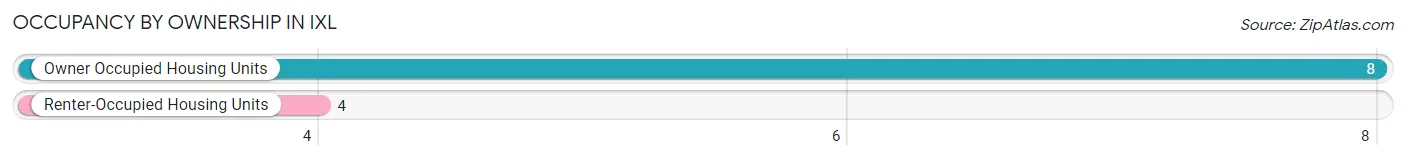
| Occupancy | # Housing Units | % Housing Units |
| Owner Occupied Housing Units | 8 | 66.7% |
| Renter-Occupied Housing Units | 4 | 33.3% |
| Total Occupied Housing Units | 12 | 100.0% |
Occupancy by Household Size in IXL
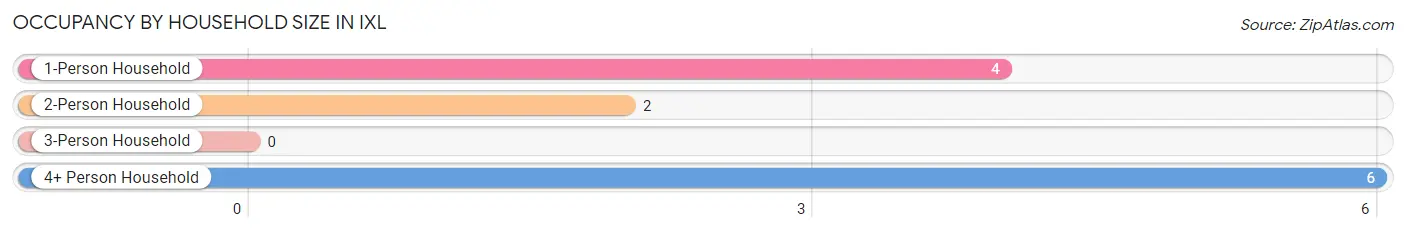
| Household Size | # Housing Units | % Housing Units |
| 1-Person Household | 4 | 33.3% |
| 2-Person Household | 2 | 16.7% |
| 3-Person Household | 0 | 0.0% |
| 4+ Person Household | 6 | 50.0% |
| Total Housing Units | 12 | 100.0% |
Occupancy by Ownership by Household Size in IXL
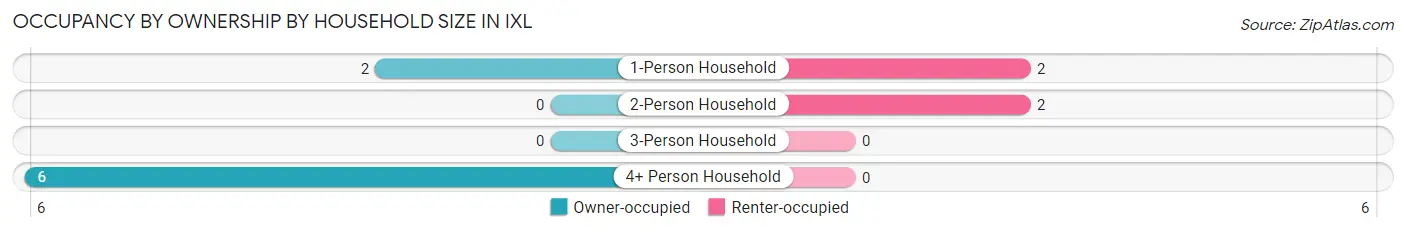
| Household Size | Owner-occupied | Renter-occupied |
| 1-Person Household | 2 (50.0%) | 2 (50.0%) |
| 2-Person Household | 0 (0.0%) | 2 (100.0%) |
| 3-Person Household | 0 (0.0%) | 0 (0.0%) |
| 4+ Person Household | 6 (100.0%) | 0 (0.0%) |
| Total Housing Units | 8 (66.7%) | 4 (33.3%) |
Occupancy by Educational Attainment in IXL
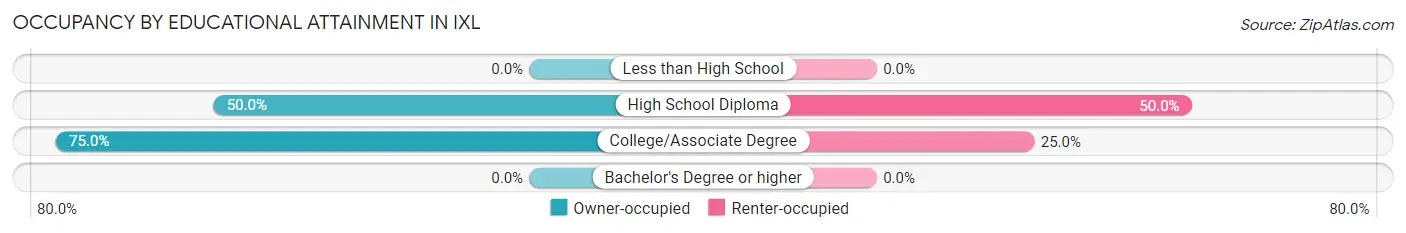
| Household Size | Owner-occupied | Renter-occupied |
| Less than High School | 0 (0.0%) | 0 (0.0%) |
| High School Diploma | 2 (50.0%) | 2 (50.0%) |
| College/Associate Degree | 6 (75.0%) | 2 (25.0%) |
| Bachelor's Degree or higher | 0 (0.0%) | 0 (0.0%) |
Occupancy by Age of Householder in IXL
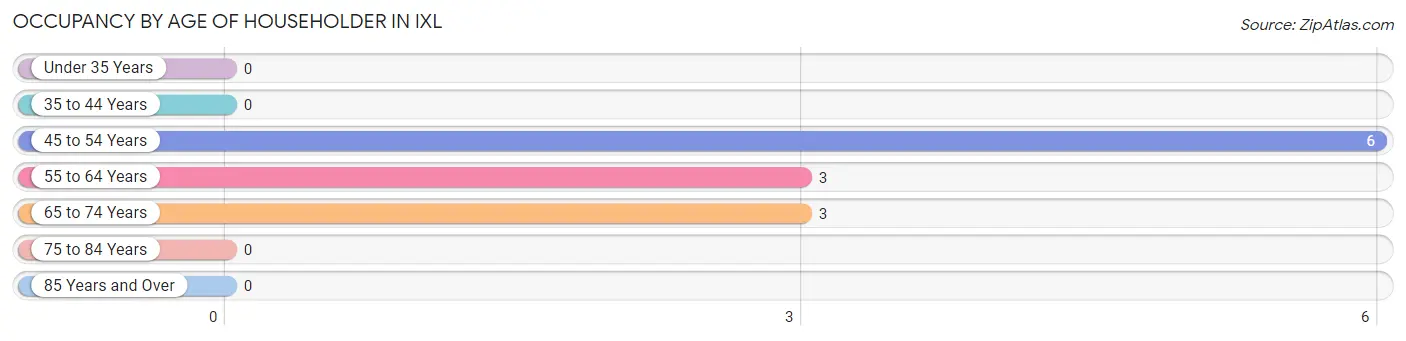
| Age Bracket | # Households | % Households |
| Under 35 Years | 0 | 0.0% |
| 35 to 44 Years | 0 | 0.0% |
| 45 to 54 Years | 6 | 50.0% |
| 55 to 64 Years | 3 | 25.0% |
| 65 to 74 Years | 3 | 25.0% |
| 75 to 84 Years | 0 | 0.0% |
| 85 Years and Over | 0 | 0.0% |
| Total | 12 | 100.0% |
Housing Finances in IXL
Median Income by Occupancy in IXL
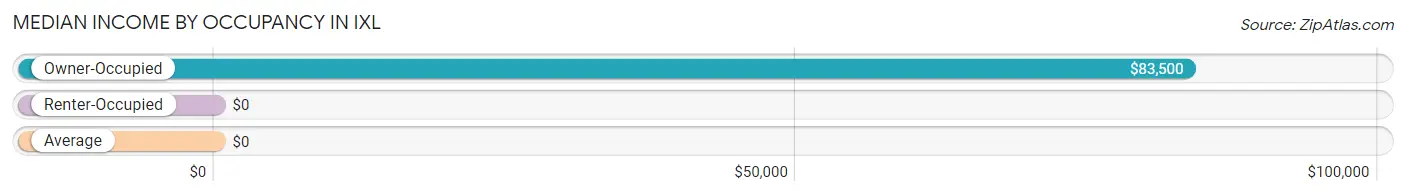
| Occupancy Type | # Households | Median Income |
| Owner-Occupied | 8 (66.7%) | $83,500 |
| Renter-Occupied | 4 (33.3%) | $0 |
| Average | 12 (100.0%) | $0 |
Occupancy by Householder Income Bracket in IXL
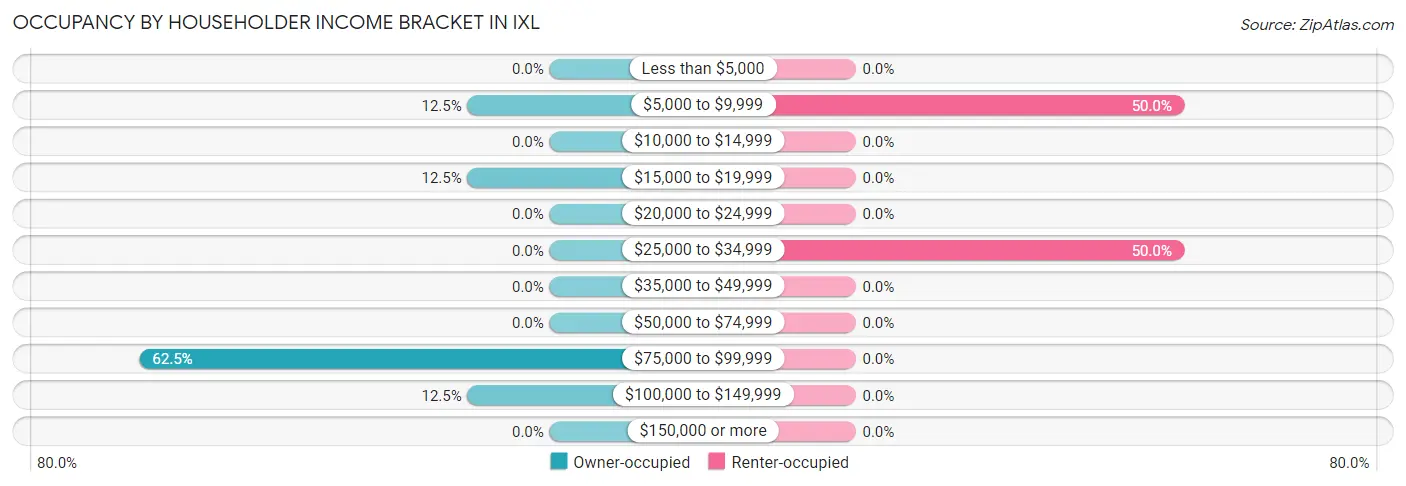
| Income Bracket | Owner-occupied | Renter-occupied |
| Less than $5,000 | 0 (0.0%) | 0 (0.0%) |
| $5,000 to $9,999 | 1 (12.5%) | 2 (50.0%) |
| $10,000 to $14,999 | 0 (0.0%) | 0 (0.0%) |
| $15,000 to $19,999 | 1 (12.5%) | 0 (0.0%) |
| $20,000 to $24,999 | 0 (0.0%) | 0 (0.0%) |
| $25,000 to $34,999 | 0 (0.0%) | 2 (50.0%) |
| $35,000 to $49,999 | 0 (0.0%) | 0 (0.0%) |
| $50,000 to $74,999 | 0 (0.0%) | 0 (0.0%) |
| $75,000 to $99,999 | 5 (62.5%) | 0 (0.0%) |
| $100,000 to $149,999 | 1 (12.5%) | 0 (0.0%) |
| $150,000 or more | 0 (0.0%) | 0 (0.0%) |
| Total | 8 (100.0%) | 4 (100.0%) |
Monthly Housing Cost Tiers in IXL
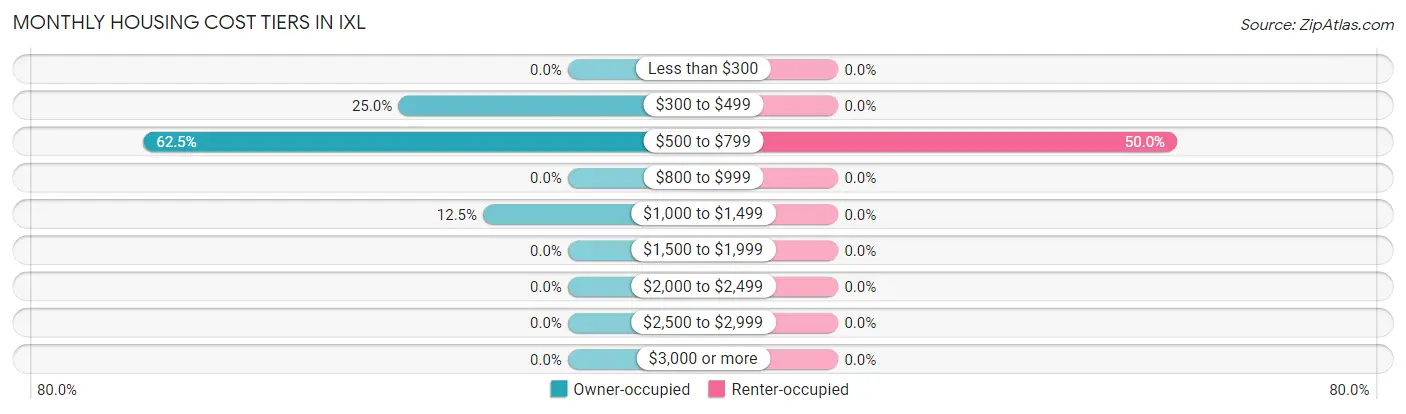
| Monthly Cost | Owner-occupied | Renter-occupied |
| Less than $300 | 0 (0.0%) | 0 (0.0%) |
| $300 to $499 | 2 (25.0%) | 0 (0.0%) |
| $500 to $799 | 5 (62.5%) | 2 (50.0%) |
| $800 to $999 | 0 (0.0%) | 0 (0.0%) |
| $1,000 to $1,499 | 1 (12.5%) | 0 (0.0%) |
| $1,500 to $1,999 | 0 (0.0%) | 0 (0.0%) |
| $2,000 to $2,499 | 0 (0.0%) | 0 (0.0%) |
| $2,500 to $2,999 | 0 (0.0%) | 0 (0.0%) |
| $3,000 or more | 0 (0.0%) | 0 (0.0%) |
| Total | 8 (100.0%) | 4 (100.0%) |
Physical Housing Characteristics in IXL
Housing Structures in IXL
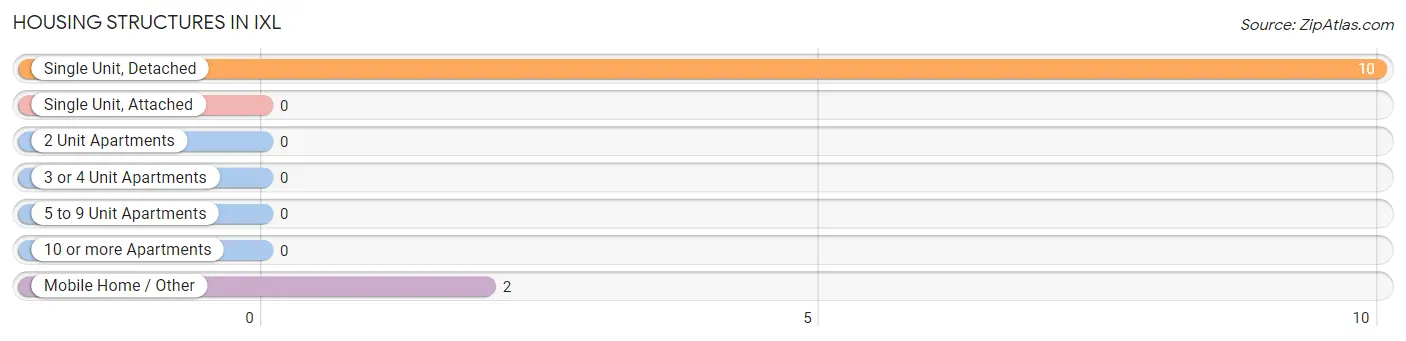
| Structure Type | # Housing Units | % Housing Units |
| Single Unit, Detached | 10 | 83.3% |
| Single Unit, Attached | 0 | 0.0% |
| 2 Unit Apartments | 0 | 0.0% |
| 3 or 4 Unit Apartments | 0 | 0.0% |
| 5 to 9 Unit Apartments | 0 | 0.0% |
| 10 or more Apartments | 0 | 0.0% |
| Mobile Home / Other | 2 | 16.7% |
| Total | 12 | 100.0% |
Housing Structures by Occupancy in IXL
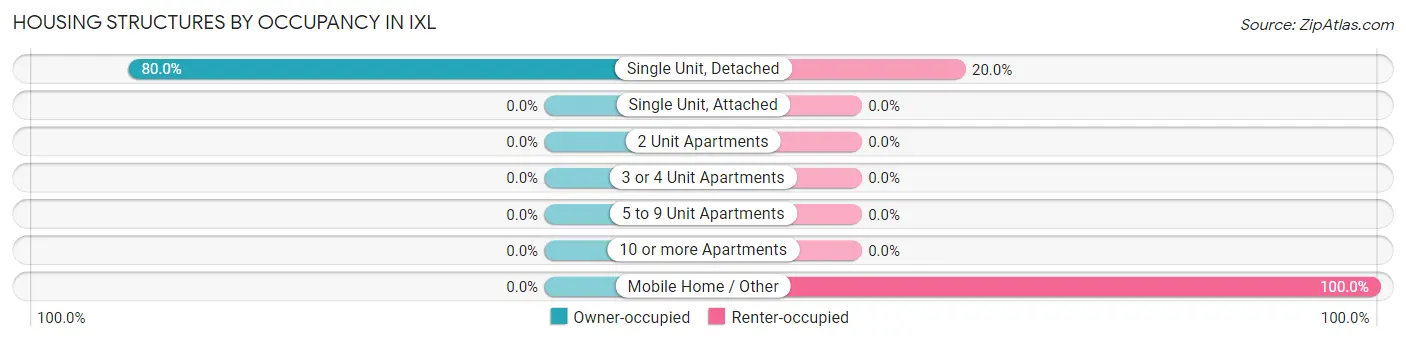
| Structure Type | Owner-occupied | Renter-occupied |
| Single Unit, Detached | 8 (80.0%) | 2 (20.0%) |
| Single Unit, Attached | 0 (0.0%) | 0 (0.0%) |
| 2 Unit Apartments | 0 (0.0%) | 0 (0.0%) |
| 3 or 4 Unit Apartments | 0 (0.0%) | 0 (0.0%) |
| 5 to 9 Unit Apartments | 0 (0.0%) | 0 (0.0%) |
| 10 or more Apartments | 0 (0.0%) | 0 (0.0%) |
| Mobile Home / Other | 0 (0.0%) | 2 (100.0%) |
| Total | 8 (66.7%) | 4 (33.3%) |
Housing Structures by Number of Rooms in IXL
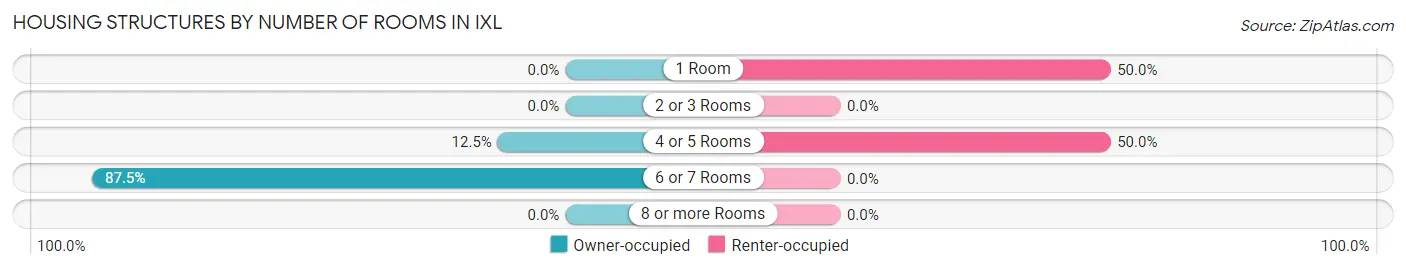
| Number of Rooms | Owner-occupied | Renter-occupied |
| 1 Room | 0 (0.0%) | 2 (50.0%) |
| 2 or 3 Rooms | 0 (0.0%) | 0 (0.0%) |
| 4 or 5 Rooms | 1 (12.5%) | 2 (50.0%) |
| 6 or 7 Rooms | 7 (87.5%) | 0 (0.0%) |
| 8 or more Rooms | 0 (0.0%) | 0 (0.0%) |
| Total | 8 (100.0%) | 4 (100.0%) |
Housing Structure by Heating Type in IXL
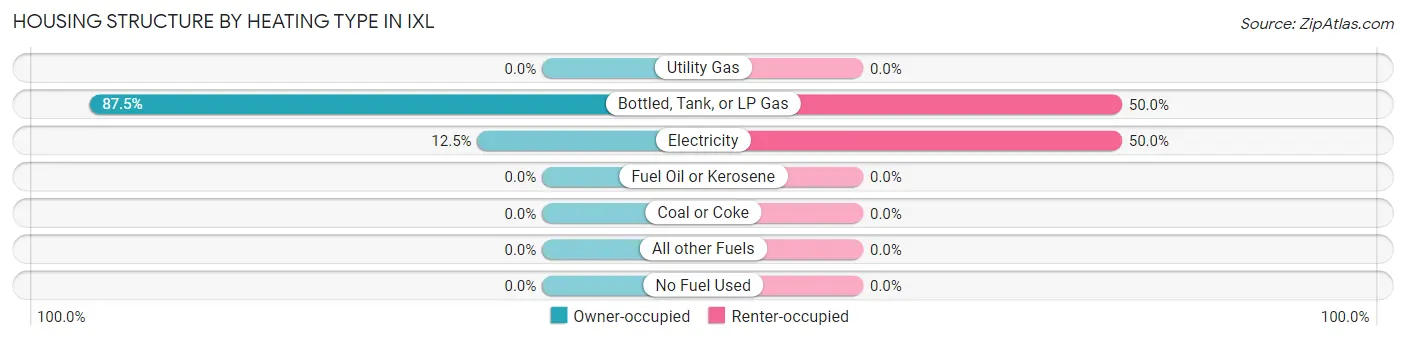
| Heating Type | Owner-occupied | Renter-occupied |
| Utility Gas | 0 (0.0%) | 0 (0.0%) |
| Bottled, Tank, or LP Gas | 7 (87.5%) | 2 (50.0%) |
| Electricity | 1 (12.5%) | 2 (50.0%) |
| Fuel Oil or Kerosene | 0 (0.0%) | 0 (0.0%) |
| Coal or Coke | 0 (0.0%) | 0 (0.0%) |
| All other Fuels | 0 (0.0%) | 0 (0.0%) |
| No Fuel Used | 0 (0.0%) | 0 (0.0%) |
| Total | 8 (100.0%) | 4 (100.0%) |
Household Vehicle Usage in IXL
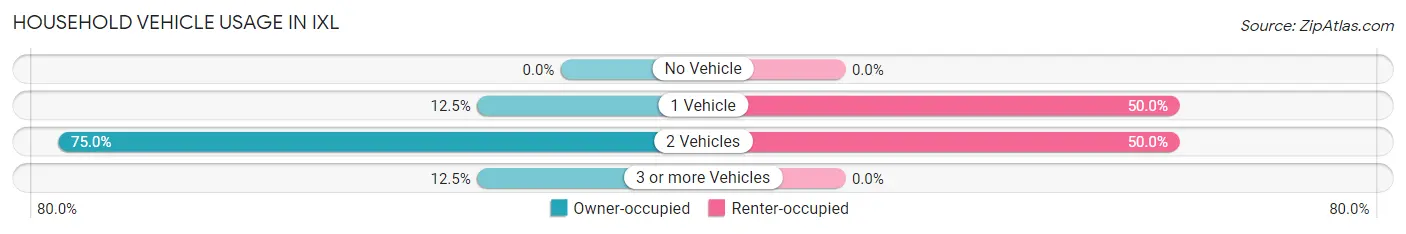
| Vehicles per Household | Owner-occupied | Renter-occupied |
| No Vehicle | 0 (0.0%) | 0 (0.0%) |
| 1 Vehicle | 1 (12.5%) | 2 (50.0%) |
| 2 Vehicles | 6 (75.0%) | 2 (50.0%) |
| 3 or more Vehicles | 1 (12.5%) | 0 (0.0%) |
| Total | 8 (100.0%) | 4 (100.0%) |
Real Estate & Mortgages in IXL
Real Estate and Mortgage Overview in IXL
| Characteristic | Without Mortgage | With Mortgage |
| Housing Units | 3 | 5 |
| Median Property Value | - | - |
| Median Household Income | - | - |
| Monthly Housing Costs | - | - |
| Real Estate Taxes | - | - |
Property Value by Mortgage Status in IXL
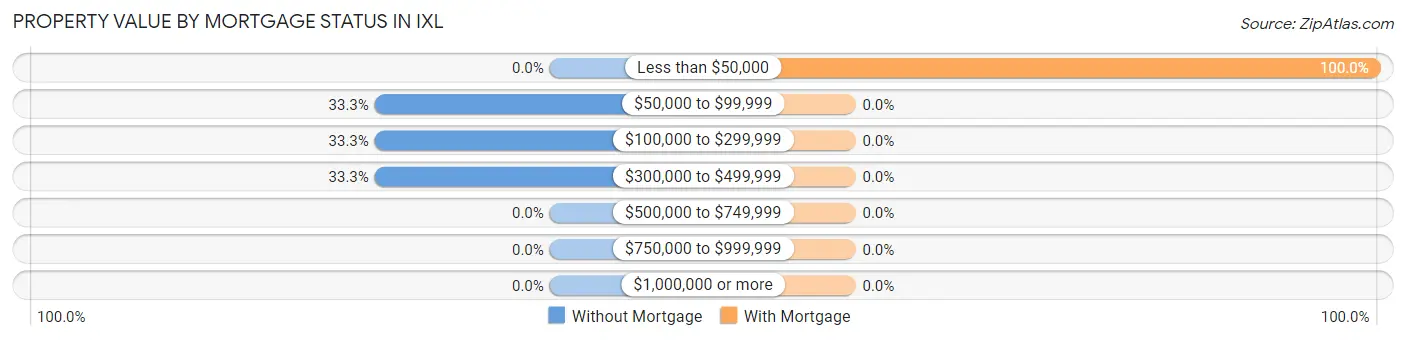
| Property Value | Without Mortgage | With Mortgage |
| Less than $50,000 | 0 (0.0%) | 5 (100.0%) |
| $50,000 to $99,999 | 1 (33.3%) | 0 (0.0%) |
| $100,000 to $299,999 | 1 (33.3%) | 0 (0.0%) |
| $300,000 to $499,999 | 1 (33.3%) | 0 (0.0%) |
| $500,000 to $749,999 | 0 (0.0%) | 0 (0.0%) |
| $750,000 to $999,999 | 0 (0.0%) | 0 (0.0%) |
| $1,000,000 or more | 0 (0.0%) | 0 (0.0%) |
| Total | 3 (100.0%) | 5 (100.0%) |
Household Income by Mortgage Status in IXL
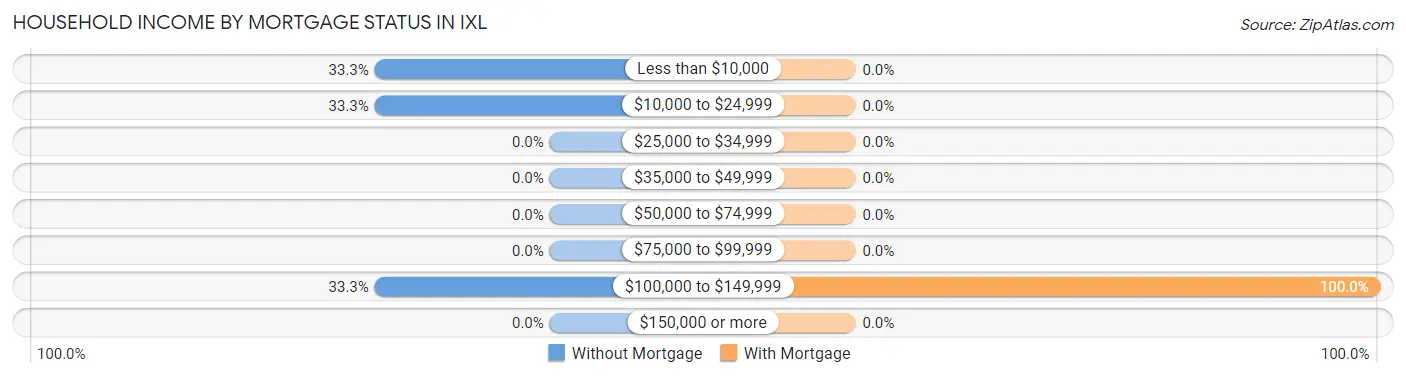
| Household Income | Without Mortgage | With Mortgage |
| Less than $10,000 | 1 (33.3%) | 0 (0.0%) |
| $10,000 to $24,999 | 1 (33.3%) | 0 (0.0%) |
| $25,000 to $34,999 | 0 (0.0%) | 0 (0.0%) |
| $35,000 to $49,999 | 0 (0.0%) | 0 (0.0%) |
| $50,000 to $74,999 | 0 (0.0%) | 0 (0.0%) |
| $75,000 to $99,999 | 0 (0.0%) | 0 (0.0%) |
| $100,000 to $149,999 | 1 (33.3%) | 5 (100.0%) |
| $150,000 or more | 0 (0.0%) | 0 (0.0%) |
| Total | 3 (100.0%) | 5 (100.0%) |
Property Value to Household Income Ratio in IXL
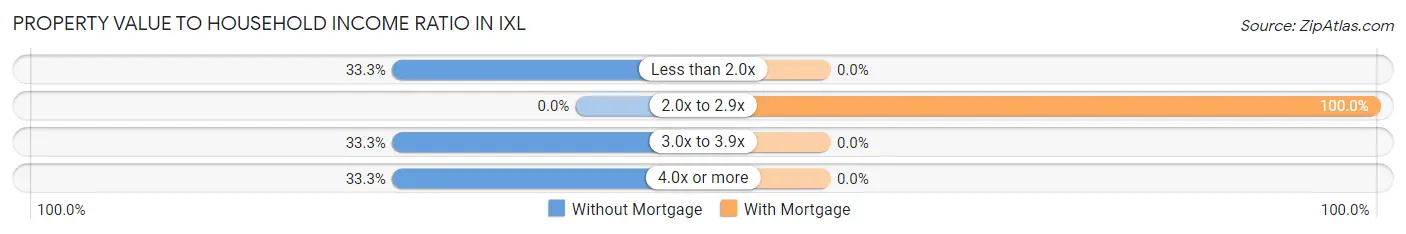
| Value-to-Income Ratio | Without Mortgage | With Mortgage |
| Less than 2.0x | 1 (33.3%) | 0 (0.0%) |
| 2.0x to 2.9x | 0 (0.0%) | 5 (100.0%) |
| 3.0x to 3.9x | 1 (33.3%) | 0 (0.0%) |
| 4.0x or more | 1 (33.3%) | 0 (0.0%) |
| Total | 3 (100.0%) | 5 (100.0%) |
Real Estate Taxes by Mortgage Status in IXL
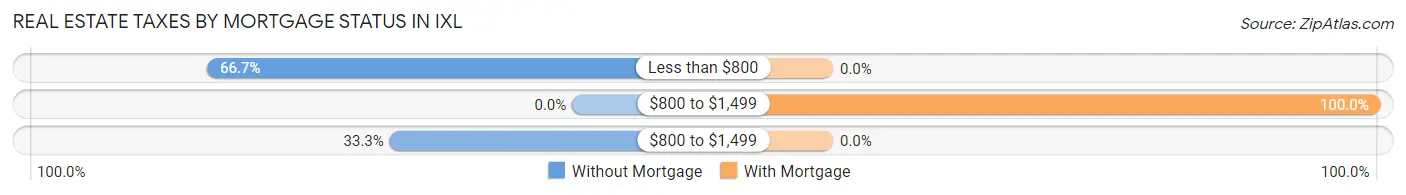
| Property Taxes | Without Mortgage | With Mortgage |
| Less than $800 | 2 (66.7%) | 0 (0.0%) |
| $800 to $1,499 | 0 (0.0%) | 5 (100.0%) |
| $800 to $1,499 | 1 (33.3%) | 0 (0.0%) |
| Total | 3 (100.0%) | 5 (100.0%) |
Health & Disability in IXL
Health Insurance Coverage by Age in IXL
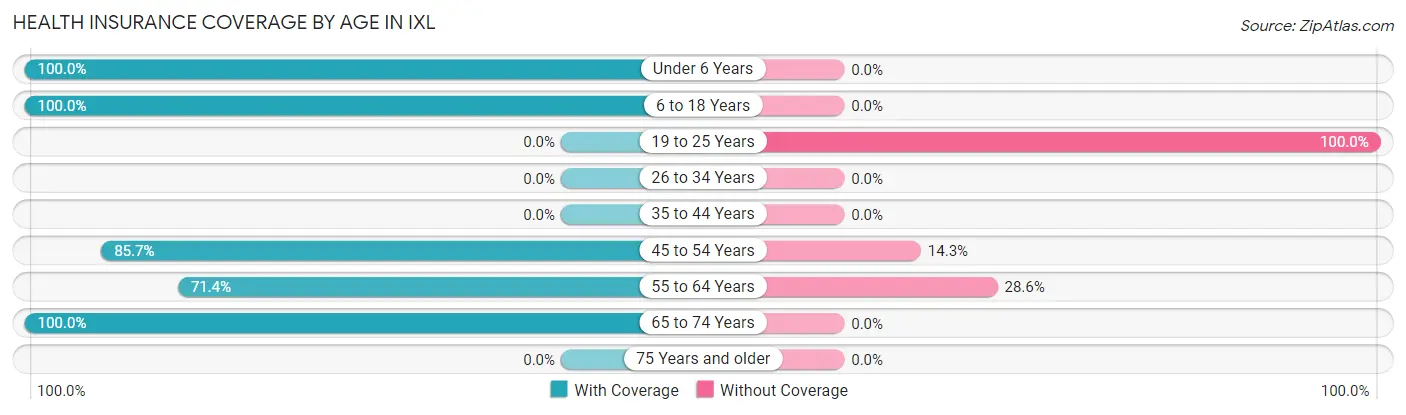
| Age Bracket | With Coverage | Without Coverage |
| Under 6 Years | 5 (100.0%) | 0 (0.0%) |
| 6 to 18 Years | 4 (100.0%) | 0 (0.0%) |
| 19 to 25 Years | 0 (0.0%) | 4 (100.0%) |
| 26 to 34 Years | 0 (0.0%) | 0 (0.0%) |
| 35 to 44 Years | 0 (0.0%) | 0 (0.0%) |
| 45 to 54 Years | 6 (85.7%) | 1 (14.3%) |
| 55 to 64 Years | 5 (71.4%) | 2 (28.6%) |
| 65 to 74 Years | 3 (100.0%) | 0 (0.0%) |
| 75 Years and older | 0 (0.0%) | 0 (0.0%) |
| Total | 23 (76.7%) | 7 (23.3%) |
Health Insurance Coverage by Citizenship Status in IXL
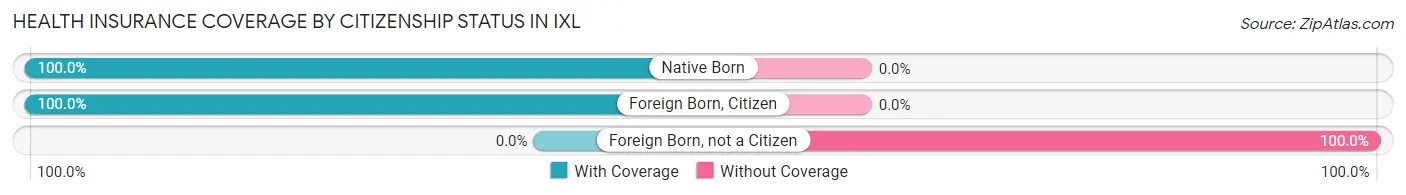
| Citizenship Status | With Coverage | Without Coverage |
| Native Born | 5 (100.0%) | 0 (0.0%) |
| Foreign Born, Citizen | 4 (100.0%) | 0 (0.0%) |
| Foreign Born, not a Citizen | 0 (0.0%) | 4 (100.0%) |
Health Insurance Coverage by Household Income in IXL
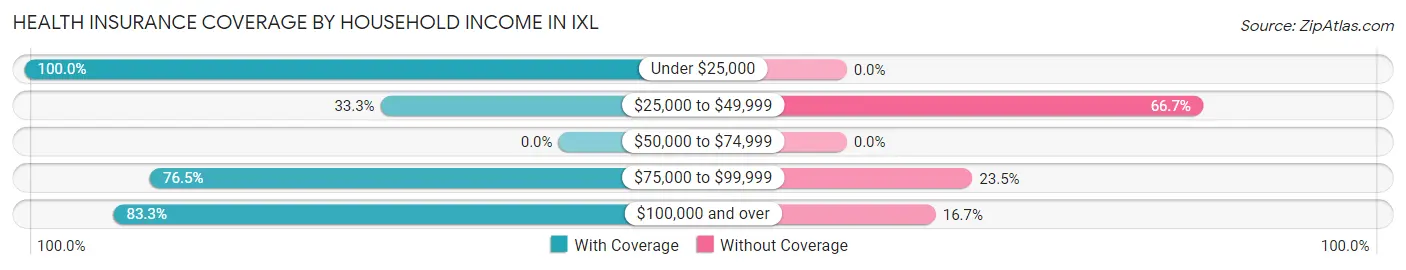
| Household Income | With Coverage | Without Coverage |
| Under $25,000 | 4 (100.0%) | 0 (0.0%) |
| $25,000 to $49,999 | 1 (33.3%) | 2 (66.7%) |
| $50,000 to $74,999 | 0 (0.0%) | 0 (0.0%) |
| $75,000 to $99,999 | 13 (76.5%) | 4 (23.5%) |
| $100,000 and over | 5 (83.3%) | 1 (16.7%) |
Public vs Private Health Insurance Coverage by Age in IXL
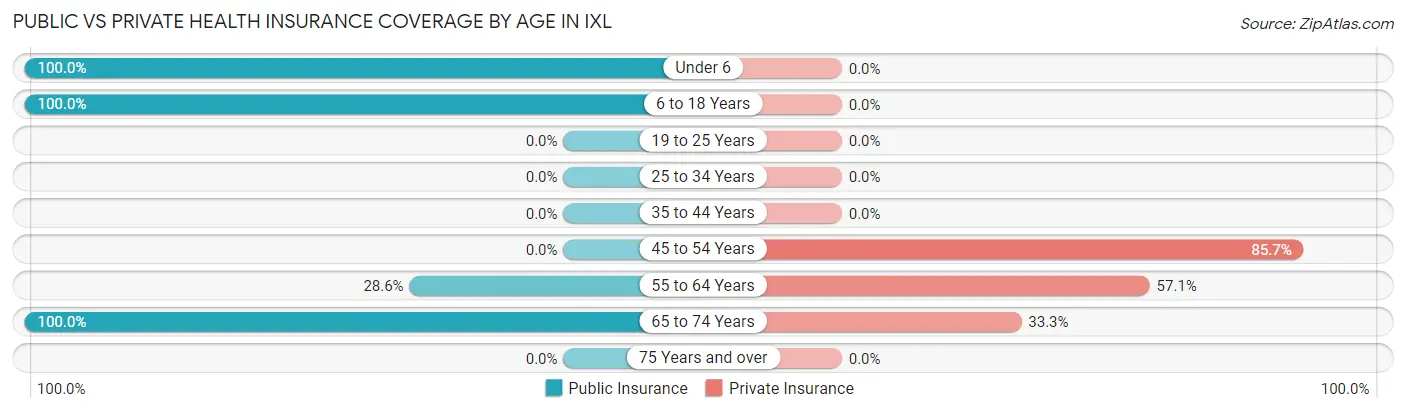
| Age Bracket | Public Insurance | Private Insurance |
| Under 6 | 5 (100.0%) | 0 (0.0%) |
| 6 to 18 Years | 4 (100.0%) | 0 (0.0%) |
| 19 to 25 Years | 0 (0.0%) | 0 (0.0%) |
| 25 to 34 Years | 0 (0.0%) | 0 (0.0%) |
| 35 to 44 Years | 0 (0.0%) | 0 (0.0%) |
| 45 to 54 Years | 0 (0.0%) | 6 (85.7%) |
| 55 to 64 Years | 2 (28.6%) | 4 (57.1%) |
| 65 to 74 Years | 3 (100.0%) | 1 (33.3%) |
| 75 Years and over | 0 (0.0%) | 0 (0.0%) |
| Total | 14 (46.7%) | 11 (36.7%) |
Disability Status by Sex by Age in IXL
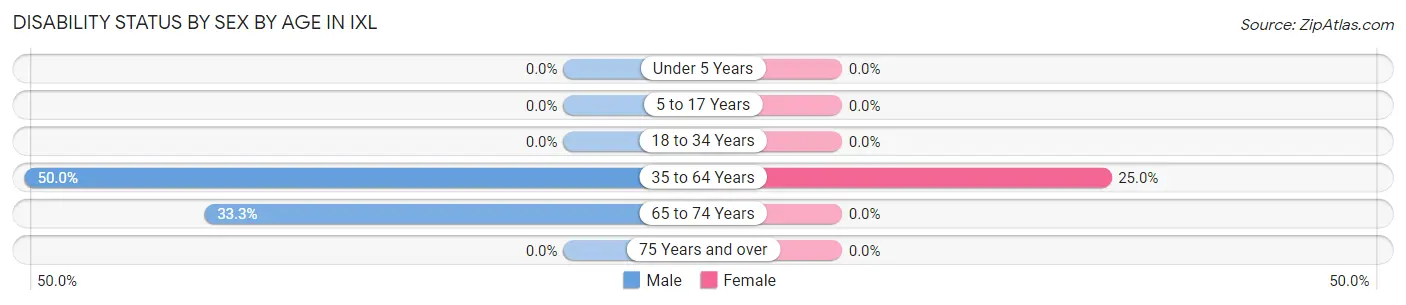
| Age Bracket | Male | Female |
| Under 5 Years | 0 (0.0%) | 0 (0.0%) |
| 5 to 17 Years | 0 (0.0%) | 0 (0.0%) |
| 18 to 34 Years | 0 (0.0%) | 0 (0.0%) |
| 35 to 64 Years | 3 (50.0%) | 2 (25.0%) |
| 65 to 74 Years | 1 (33.3%) | 0 (0.0%) |
| 75 Years and over | 0 (0.0%) | 0 (0.0%) |
Disability Class by Sex by Age in IXL
Disability Class: Hearing Difficulty
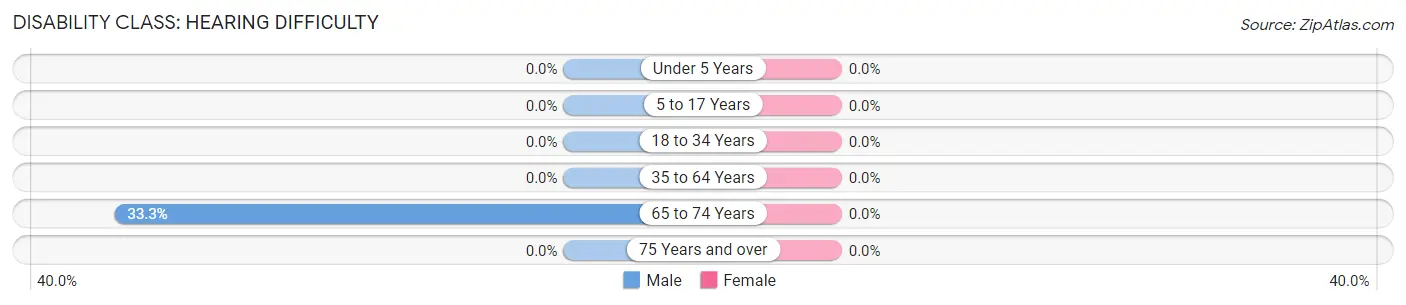
| Age Bracket | Male | Female |
| Under 5 Years | 0 (0.0%) | 0 (0.0%) |
| 5 to 17 Years | 0 (0.0%) | 0 (0.0%) |
| 18 to 34 Years | 0 (0.0%) | 0 (0.0%) |
| 35 to 64 Years | 0 (0.0%) | 0 (0.0%) |
| 65 to 74 Years | 1 (33.3%) | 0 (0.0%) |
| 75 Years and over | 0 (0.0%) | 0 (0.0%) |
Disability Class: Vision Difficulty
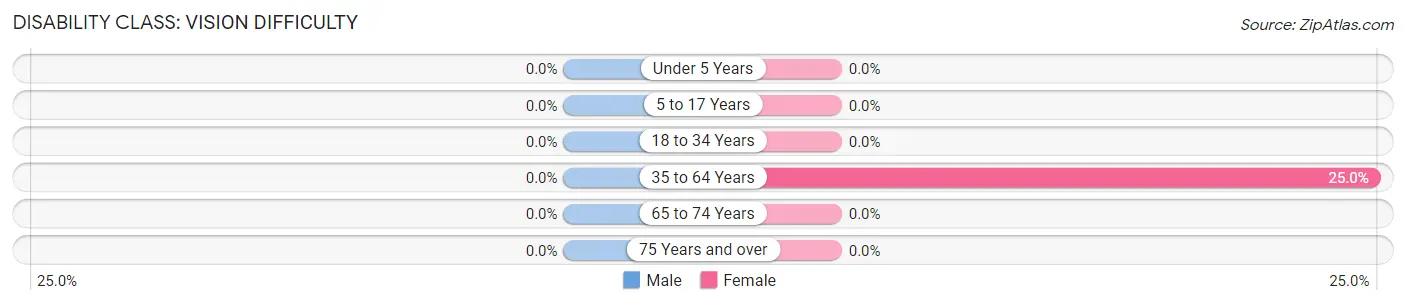
| Age Bracket | Male | Female |
| Under 5 Years | 0 (0.0%) | 0 (0.0%) |
| 5 to 17 Years | 0 (0.0%) | 0 (0.0%) |
| 18 to 34 Years | 0 (0.0%) | 0 (0.0%) |
| 35 to 64 Years | 0 (0.0%) | 2 (25.0%) |
| 65 to 74 Years | 0 (0.0%) | 0 (0.0%) |
| 75 Years and over | 0 (0.0%) | 0 (0.0%) |
Disability Class: Cognitive Difficulty
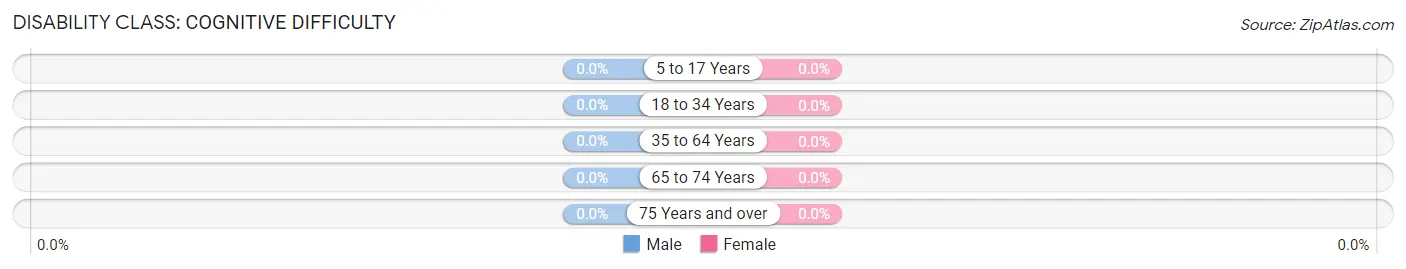
| Age Bracket | Male | Female |
| 5 to 17 Years | 0 (0.0%) | 0 (0.0%) |
| 18 to 34 Years | 0 (0.0%) | 0 (0.0%) |
| 35 to 64 Years | 0 (0.0%) | 0 (0.0%) |
| 65 to 74 Years | 0 (0.0%) | 0 (0.0%) |
| 75 Years and over | 0 (0.0%) | 0 (0.0%) |
Disability Class: Ambulatory Difficulty
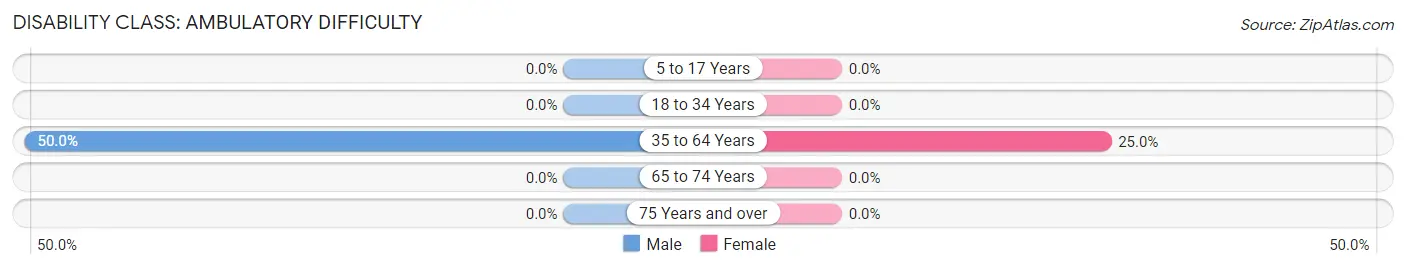
| Age Bracket | Male | Female |
| 5 to 17 Years | 0 (0.0%) | 0 (0.0%) |
| 18 to 34 Years | 0 (0.0%) | 0 (0.0%) |
| 35 to 64 Years | 3 (50.0%) | 2 (25.0%) |
| 65 to 74 Years | 0 (0.0%) | 0 (0.0%) |
| 75 Years and over | 0 (0.0%) | 0 (0.0%) |
Disability Class: Self-Care Difficulty

| Age Bracket | Male | Female |
| 5 to 17 Years | 0 (0.0%) | 0 (0.0%) |
| 18 to 34 Years | 0 (0.0%) | 0 (0.0%) |
| 35 to 64 Years | 0 (0.0%) | 0 (0.0%) |
| 65 to 74 Years | 0 (0.0%) | 0 (0.0%) |
| 75 Years and over | 0 (0.0%) | 0 (0.0%) |
Technology Access in IXL
Computing Device Access in IXL
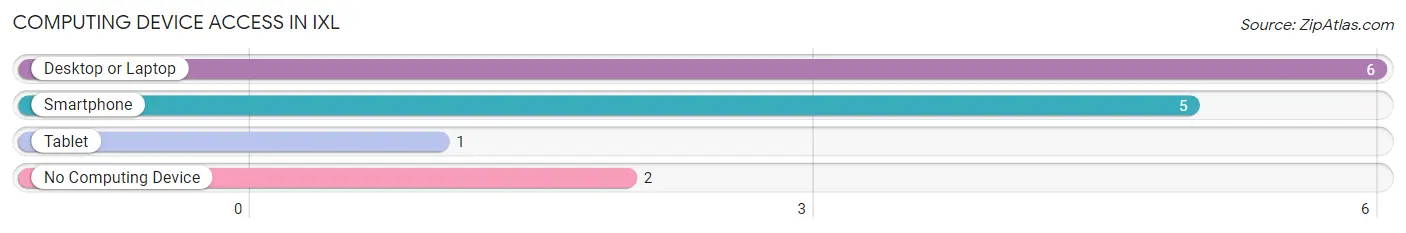
| Device Type | # Households | % Households |
| Desktop or Laptop | 6 | 50.0% |
| Smartphone | 5 | 41.7% |
| Tablet | 1 | 8.3% |
| No Computing Device | 2 | 16.7% |
| Total | 12 | 100.0% |
Internet Access in IXL
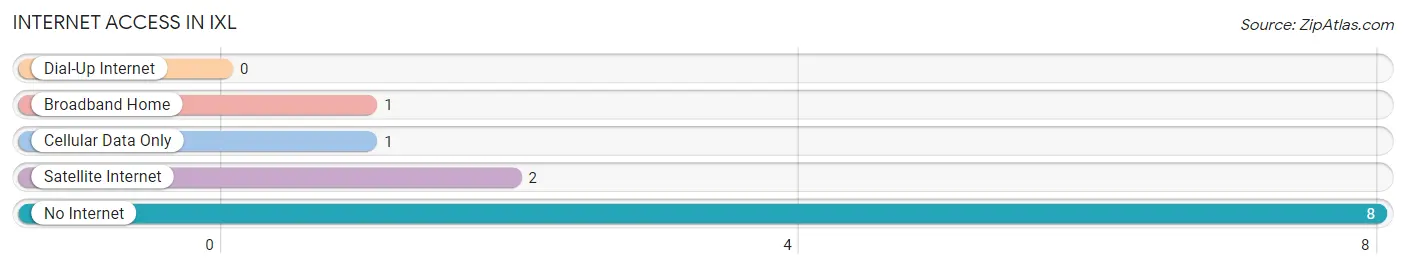
| Internet Type | # Households | % Households |
| Dial-Up Internet | 0 | 0.0% |
| Broadband Home | 1 | 8.3% |
| Cellular Data Only | 1 | 8.3% |
| Satellite Internet | 2 | 16.7% |
| No Internet | 8 | 66.7% |
| Total | 12 | 100.0% |
IXL Summary
Oklahoma is a state located in the South Central region of the United States. It is bordered by Texas to the south, Arkansas to the east, Kansas to the north, and Colorado and New Mexico to the west. Oklahoma is the 20th most populous state in the United States, with an estimated population of 3.9 million in 2019. It is the 28th largest state in terms of land area, covering an area of 69,899 square miles.
Geography
Oklahoma is located in the Great Plains region of the United States. It is bordered by Texas to the south, Arkansas to the east, Kansas to the north, and Colorado and New Mexico to the west. The state is divided into 77 counties and contains five major physiographic regions: the Ozark Plateau, the Ouachita Mountains, the Arbuckle Mountains, the Red Bed Plains, and the Great Plains. The state is home to a variety of landscapes, including rolling hills, prairies, forests, and mountains. The highest point in the state is Black Mesa, located in the panhandle region, at 4,973 feet above sea level. The state also contains several major rivers, including the Arkansas, Canadian, and Red Rivers.
History
Oklahoma has a rich and varied history. The area was originally inhabited by Native American tribes, including the Cherokee, Choctaw, Chickasaw, and Creek. In the early 1800s, the area was part of the Louisiana Purchase and was later designated as Indian Territory. In 1889, the area was opened to white settlement and was admitted to the Union as the 46th state in 1907.
During the 20th century, Oklahoma experienced significant economic growth, largely due to the discovery of oil and natural gas. The state also experienced a period of population growth, as people from other parts of the country moved to Oklahoma in search of economic opportunity.
Economy
Oklahoma has a diverse economy, with a mix of industries including agriculture, energy, manufacturing, and services. The state is a major producer of oil and natural gas, and is home to several major energy companies. Agriculture is also an important part of the state’s economy, with wheat, cotton, and cattle being the main products. Manufacturing is also a major industry, with products ranging from aircraft parts to food processing. The state is also home to several major companies, including Boeing, AT&T, and Walmart.
Demographics
As of 2019, Oklahoma had an estimated population of 3.9 million. The state is home to a diverse population, with the largest ethnic groups being White (68.3%), American Indian and Alaska Native (9.2%), and Hispanic or Latino (7.7%). The state also has a large population of African Americans (7.6%) and Asians (2.2%). The median household income in Oklahoma is $50,051, and the poverty rate is 16.2%. The state’s largest cities are Oklahoma City, Tulsa, Norman, and Broken Arrow.
Common Questions
What is Per Capita Income in IXL?
Per Capita income in IXL is $18,330.
What is the Median Family Income in IXL?
Median Family Income in IXL is $83,500.
What is Inequality or Gini Index in IXL?
Inequality or Gini Index in IXL is 0.39.
What is the Total Population of IXL?
Total Population of IXL is 30.
What is the Total Male Population of IXL?
Total Male Population of IXL is 16.
What is the Total Female Population of IXL?
Total Female Population of IXL is 14.
What is the Ratio of Males per 100 Females in IXL?
There are 114.29 Males per 100 Females in IXL.
What is the Ratio of Females per 100 Males in IXL?
There are 87.50 Females per 100 Males in IXL.
What is the Median Population Age in IXL?
Median Population Age in IXL is 48.2 Years.
What is the Average Family Size in IXL
Average Family Size in IXL is 3.2 People.
What is the Average Household Size in IXL
Average Household Size in IXL is 2.5 People.
How Large is the Labor Force in IXL?
There are 13 People in the Labor Forcein in IXL.
What is the Percentage of People in the Labor Force in IXL?
56.5% of People are in the Labor Force in IXL.