Okmulgee, OK Map & Demographics
Okmulgee Map
Okmulgee Overview
$23,834
PER CAPITA INCOME
$46,054
AVG FAMILY INCOME
$38,311
AVG HOUSEHOLD INCOME
13.1%
WAGE / INCOME GAP [ % ]
86.9¢/ $1
WAGE / INCOME GAP [ $ ]
$7,980
FAMILY INCOME DEFICIT
0.53
INEQUALITY / GINI INDEX
11,366
TOTAL POPULATION
5,525
MALE POPULATION
5,841
FEMALE POPULATION
94.59
MALES / 100 FEMALES
105.72
FEMALES / 100 MALES
35.5
MEDIAN AGE
3.1
AVG FAMILY SIZE
2.4
AVG HOUSEHOLD SIZE
4,758
LABOR FORCE [ PEOPLE ]
51.3%
PERCENT IN LABOR FORCE
9.2%
UNEMPLOYMENT RATE
Okmulgee Zip Codes
Okmulgee Area Codes
Income in Okmulgee
Income Overview in Okmulgee
Per Capita Income in Okmulgee is $23,834, while median incomes of families and households are $46,054 and $38,311 respectively.
| Characteristic | Number | Measure |
| Per Capita Income | 11,366 | $23,834 |
| Median Family Income | 2,413 | $46,054 |
| Mean Family Income | 2,413 | $62,205 |
| Median Household Income | 4,267 | $38,311 |
| Mean Household Income | 4,267 | $58,971 |
| Income Deficit | 2,413 | $7,980 |
| Wage / Income Gap (%) | 11,366 | 13.14% |
| Wage / Income Gap ($) | 11,366 | 86.86¢ per $1 |
| Gini / Inequality Index | 11,366 | 0.53 |
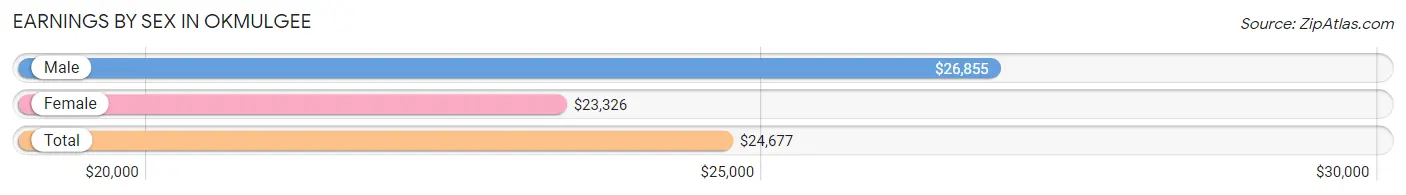
Earnings by Sex in Okmulgee
Average Earnings in Okmulgee are $24,677, $26,855 for men and $23,326 for women, a difference of 13.1%.
| Sex | Number | Average Earnings |
| Male | 2,422 (49.5%) | $26,855 |
| Female | 2,470 (50.5%) | $23,326 |
| Total | 4,892 (100.0%) | $24,677 |
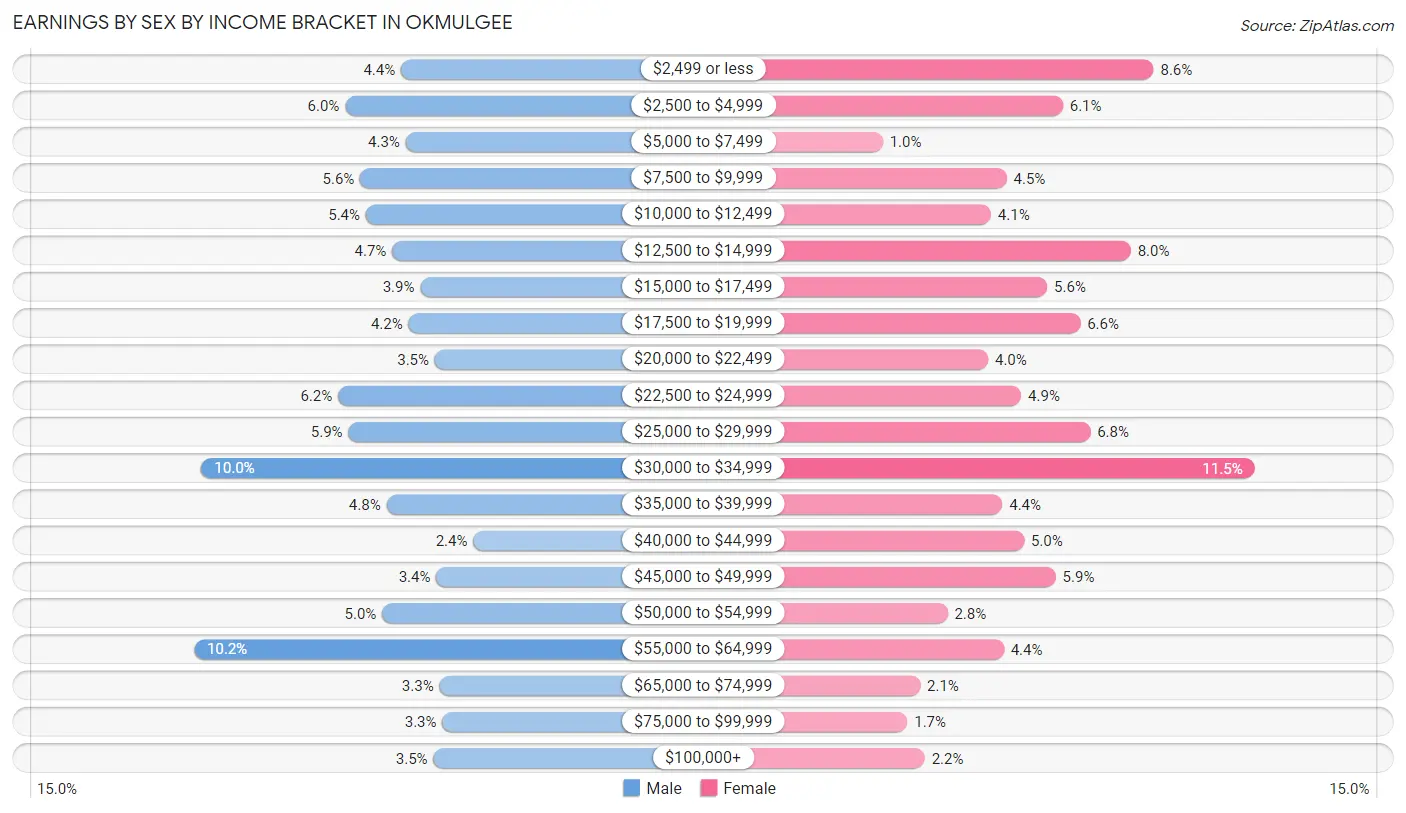
Earnings by Sex by Income Bracket in Okmulgee
The most common earnings brackets in Okmulgee are $55,000 to $64,999 for men (248 | 10.2%) and $30,000 to $34,999 for women (283 | 11.5%).
| Income | Male | Female |
| $2,499 or less | 107 (4.4%) | 213 (8.6%) |
| $2,500 to $4,999 | 145 (6.0%) | 150 (6.1%) |
| $5,000 to $7,499 | 104 (4.3%) | 25 (1.0%) |
| $7,500 to $9,999 | 135 (5.6%) | 111 (4.5%) |
| $10,000 to $12,499 | 131 (5.4%) | 100 (4.1%) |
| $12,500 to $14,999 | 113 (4.7%) | 197 (8.0%) |
| $15,000 to $17,499 | 94 (3.9%) | 139 (5.6%) |
| $17,500 to $19,999 | 102 (4.2%) | 162 (6.6%) |
| $20,000 to $22,499 | 84 (3.5%) | 98 (4.0%) |
| $22,500 to $24,999 | 150 (6.2%) | 121 (4.9%) |
| $25,000 to $29,999 | 143 (5.9%) | 169 (6.8%) |
| $30,000 to $34,999 | 243 (10.0%) | 283 (11.5%) |
| $35,000 to $39,999 | 117 (4.8%) | 108 (4.4%) |
| $40,000 to $44,999 | 58 (2.4%) | 123 (5.0%) |
| $45,000 to $49,999 | 83 (3.4%) | 145 (5.9%) |
| $50,000 to $54,999 | 120 (5.0%) | 70 (2.8%) |
| $55,000 to $64,999 | 248 (10.2%) | 109 (4.4%) |
| $65,000 to $74,999 | 81 (3.3%) | 51 (2.1%) |
| $75,000 to $99,999 | 79 (3.3%) | 42 (1.7%) |
| $100,000+ | 85 (3.5%) | 54 (2.2%) |
| Total | 2,422 (100.0%) | 2,470 (100.0%) |
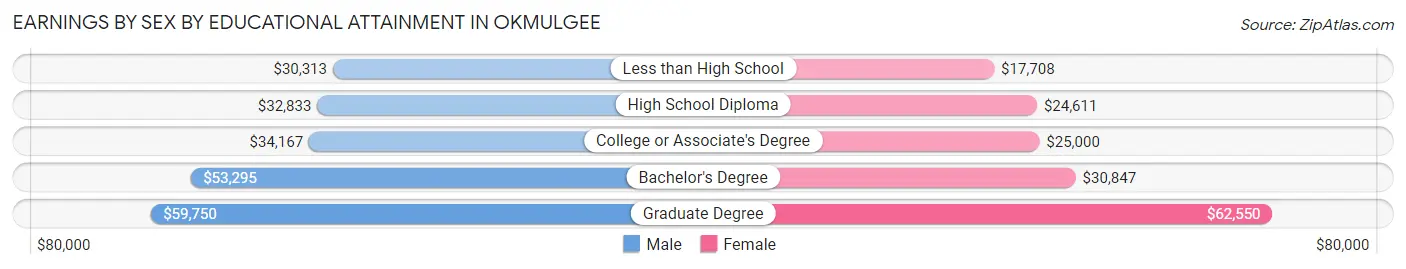
Earnings by Sex by Educational Attainment in Okmulgee
Average earnings in Okmulgee are $33,163 for men and $26,325 for women, a difference of 20.6%. Men with an educational attainment of graduate degree enjoy the highest average annual earnings of $59,750, while those with less than high school education earn the least with $30,313. Women with an educational attainment of graduate degree earn the most with the average annual earnings of $62,550, while those with less than high school education have the smallest earnings of $17,708.
| Educational Attainment | Male Income | Female Income |
| Less than High School | $30,313 | $17,708 |
| High School Diploma | $32,833 | $24,611 |
| College or Associate's Degree | $34,167 | $25,000 |
| Bachelor's Degree | $53,295 | $30,847 |
| Graduate Degree | $59,750 | $62,550 |
| Total | $33,163 | $26,325 |
Family Income in Okmulgee
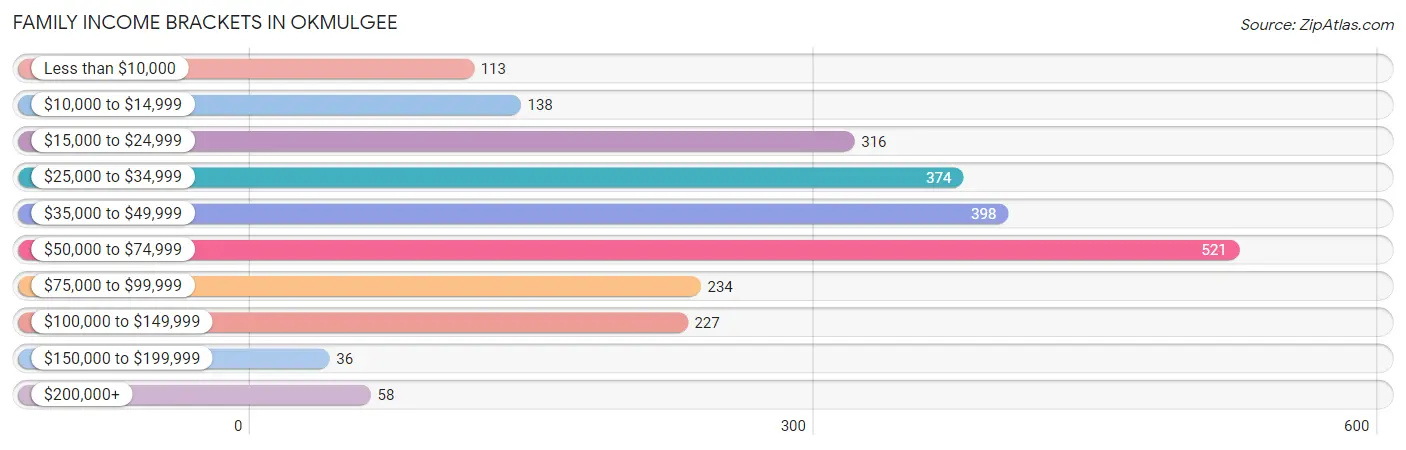
Family Income Brackets in Okmulgee
According to the Okmulgee family income data, there are 521 families falling into the $50,000 to $74,999 income range, which is the most common income bracket and makes up 21.6% of all families. Conversely, the $150,000 to $199,999 income bracket is the least frequent group with only 36 families (1.5%) belonging to this category.
| Income Bracket | # Families | % Families |
| Less than $10,000 | 113 | 4.7% |
| $10,000 to $14,999 | 138 | 5.7% |
| $15,000 to $24,999 | 316 | 13.1% |
| $25,000 to $34,999 | 374 | 15.5% |
| $35,000 to $49,999 | 398 | 16.5% |
| $50,000 to $74,999 | 521 | 21.6% |
| $75,000 to $99,999 | 234 | 9.7% |
| $100,000 to $149,999 | 227 | 9.4% |
| $150,000 to $199,999 | 36 | 1.5% |
| $200,000+ | 58 | 2.4% |
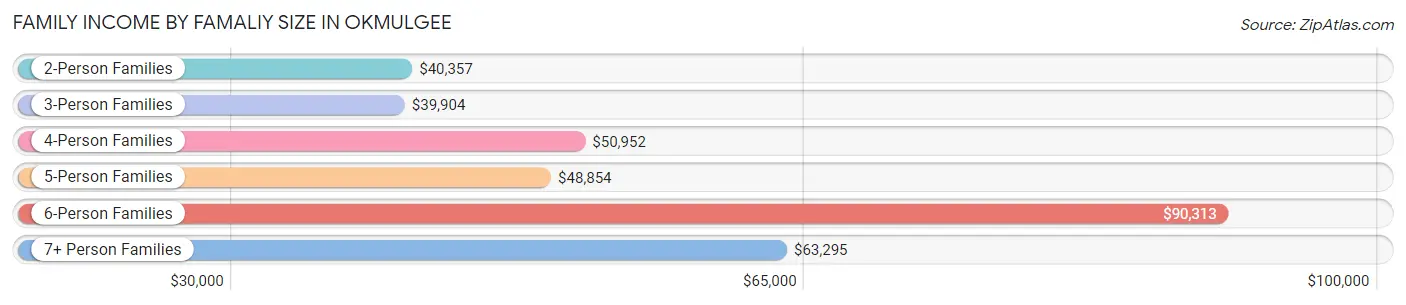
Family Income by Famaliy Size in Okmulgee
6-person families (70 | 2.9%) account for the highest median family income in Okmulgee with $90,313 per family, while 2-person families (1,168 | 48.4%) have the highest median income of $20,178 per family member.
| Income Bracket | # Families | Median Income |
| 2-Person Families | 1,168 (48.4%) | $40,357 |
| 3-Person Families | 680 (28.2%) | $39,904 |
| 4-Person Families | 350 (14.5%) | $50,952 |
| 5-Person Families | 116 (4.8%) | $48,854 |
| 6-Person Families | 70 (2.9%) | $90,313 |
| 7+ Person Families | 29 (1.2%) | $63,295 |
| Total | 2,413 (100.0%) | $46,054 |
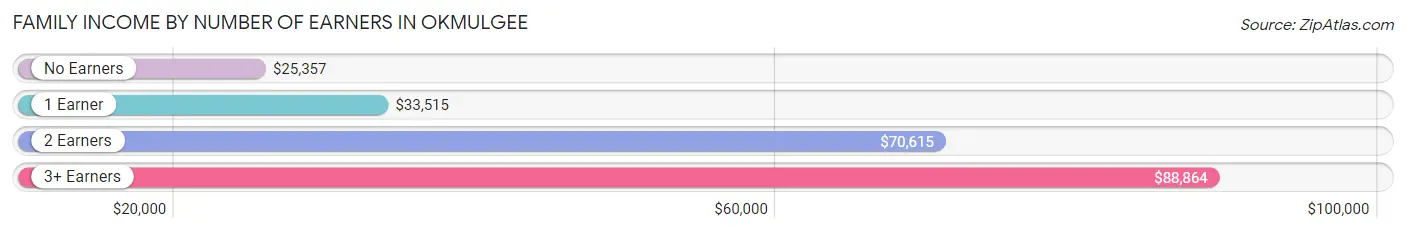
Family Income by Number of Earners in Okmulgee
The median family income in Okmulgee is $46,054, with families comprising 3+ earners (188) having the highest median family income of $88,864, while families with no earners (472) have the lowest median family income of $25,357, accounting for 7.8% and 19.6% of families, respectively.
| Number of Earners | # Families | Median Income |
| No Earners | 472 (19.6%) | $25,357 |
| 1 Earner | 1,081 (44.8%) | $33,515 |
| 2 Earners | 672 (27.9%) | $70,615 |
| 3+ Earners | 188 (7.8%) | $88,864 |
| Total | 2,413 (100.0%) | $46,054 |
Household Income in Okmulgee
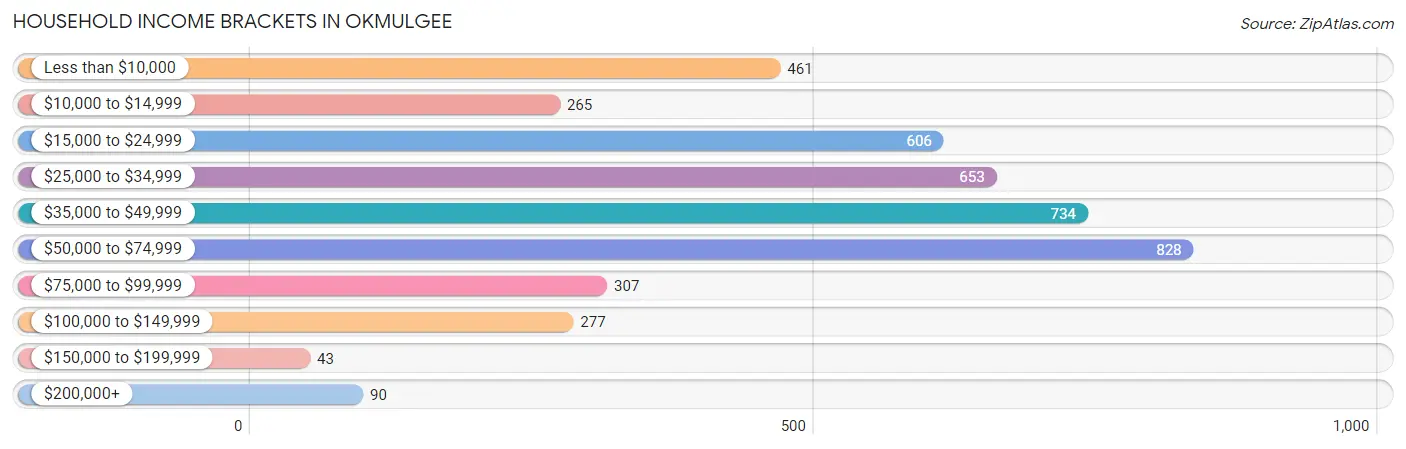
Household Income Brackets in Okmulgee
With 828 households falling in the category, the $50,000 to $74,999 income range is the most frequent in Okmulgee, accounting for 19.4% of all households. In contrast, only 43 households (1.0%) fall into the $150,000 to $199,999 income bracket, making it the least populous group.
| Income Bracket | # Households | % Households |
| Less than $10,000 | 461 | 10.8% |
| $10,000 to $14,999 | 265 | 6.2% |
| $15,000 to $24,999 | 606 | 14.2% |
| $25,000 to $34,999 | 653 | 15.3% |
| $35,000 to $49,999 | 734 | 17.2% |
| $50,000 to $74,999 | 828 | 19.4% |
| $75,000 to $99,999 | 307 | 7.2% |
| $100,000 to $149,999 | 277 | 6.5% |
| $150,000 to $199,999 | 43 | 1.0% |
| $200,000+ | 90 | 2.1% |
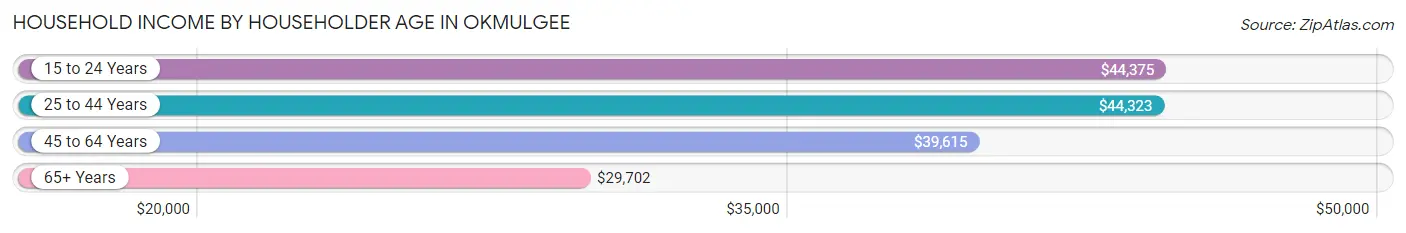
Household Income by Householder Age in Okmulgee
The median household income in Okmulgee is $38,311, with the highest median household income of $44,375 found in the 15 to 24 years age bracket for the primary householder. A total of 249 households (5.8%) fall into this category. Meanwhile, the 65+ years age bracket for the primary householder has the lowest median household income of $29,702, with 1,345 households (31.5%) in this group.
| Income Bracket | # Households | Median Income |
| 15 to 24 Years | 249 (5.8%) | $44,375 |
| 25 to 44 Years | 1,171 (27.4%) | $44,323 |
| 45 to 64 Years | 1,502 (35.2%) | $39,615 |
| 65+ Years | 1,345 (31.5%) | $29,702 |
| Total | 4,267 (100.0%) | $38,311 |
Poverty in Okmulgee
Income Below Poverty by Sex and Age in Okmulgee
With 22.6% poverty level for males and 23.8% for females among the residents of Okmulgee, under 5 year old males and 5 year old females are the most vulnerable to poverty, with 142 males (58.2%) and 32 females (55.2%) in their respective age groups living below the poverty level.
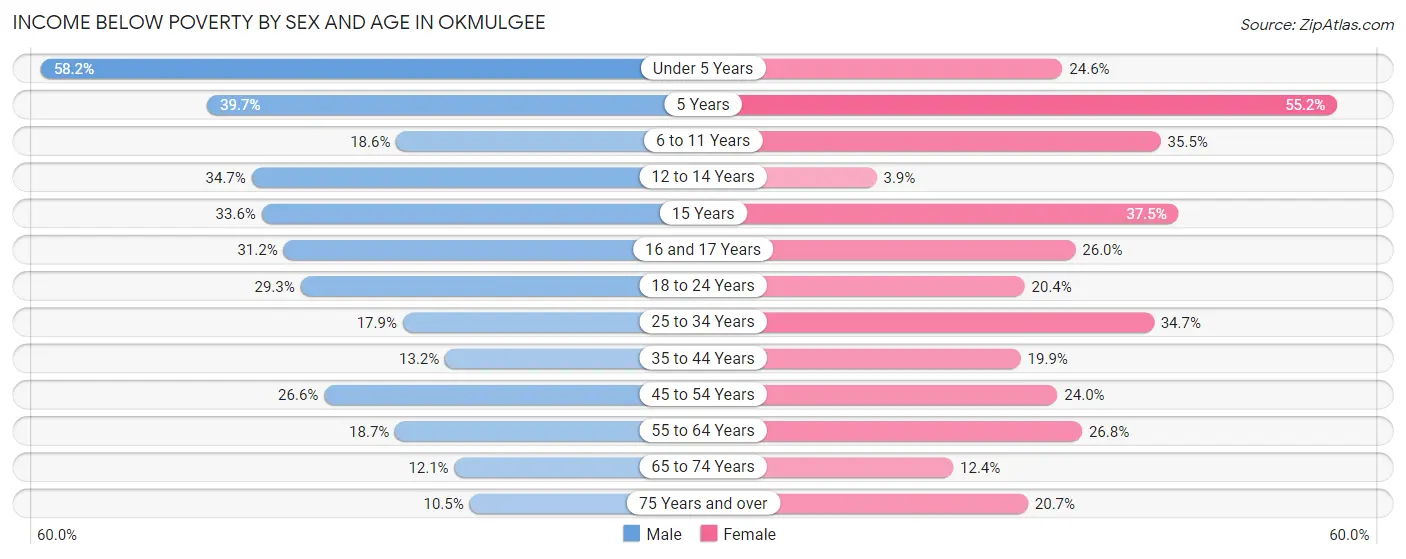
| Age Bracket | Male | Female |
| Under 5 Years | 142 (58.2%) | 85 (24.6%) |
| 5 Years | 25 (39.7%) | 32 (55.2%) |
| 6 to 11 Years | 67 (18.6%) | 98 (35.5%) |
| 12 to 14 Years | 67 (34.7%) | 11 (3.9%) |
| 15 Years | 42 (33.6%) | 18 (37.5%) |
| 16 and 17 Years | 48 (31.2%) | 45 (26.0%) |
| 18 to 24 Years | 144 (29.3%) | 91 (20.4%) |
| 25 to 34 Years | 102 (17.9%) | 297 (34.7%) |
| 35 to 44 Years | 86 (13.2%) | 101 (19.9%) |
| 45 to 54 Years | 122 (26.6%) | 187 (24.0%) |
| 55 to 64 Years | 115 (18.7%) | 176 (26.8%) |
| 65 to 74 Years | 54 (12.1%) | 77 (12.4%) |
| 75 Years and over | 21 (10.4%) | 109 (20.7%) |
| Total | 1,035 (22.6%) | 1,327 (23.8%) |
Income Above Poverty by Sex and Age in Okmulgee
According to the poverty statistics in Okmulgee, males aged 75 years and over and females aged 12 to 14 years are the age groups that are most secure financially, with 89.5% of males and 96.1% of females in these age groups living above the poverty line.
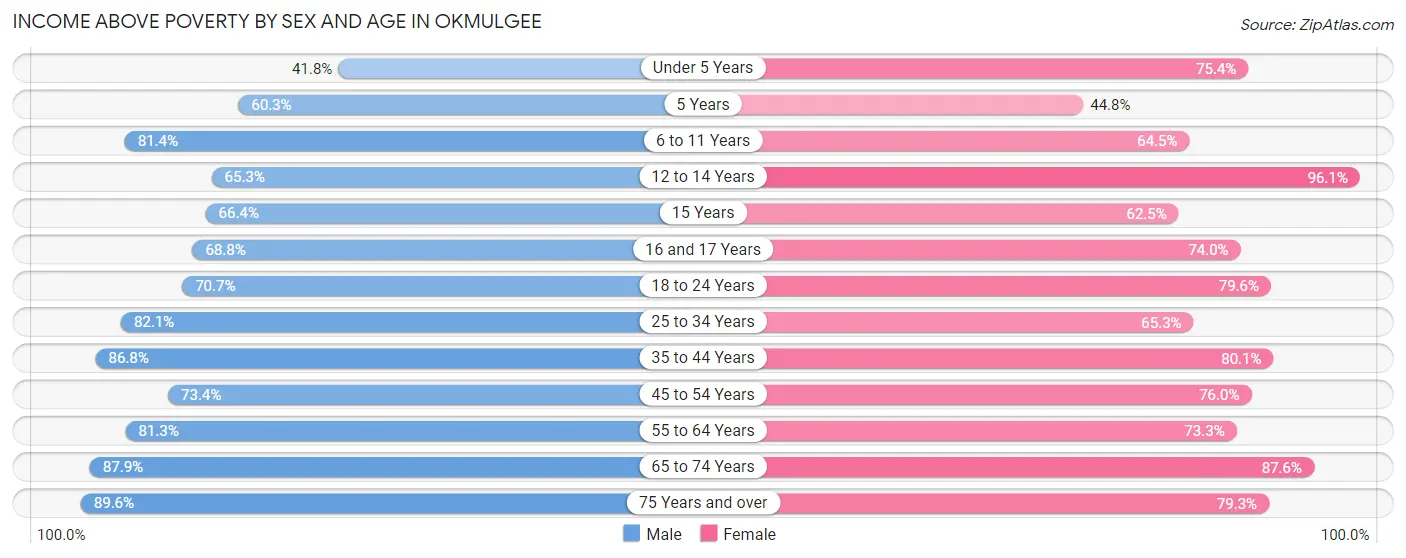
| Age Bracket | Male | Female |
| Under 5 Years | 102 (41.8%) | 261 (75.4%) |
| 5 Years | 38 (60.3%) | 26 (44.8%) |
| 6 to 11 Years | 293 (81.4%) | 178 (64.5%) |
| 12 to 14 Years | 126 (65.3%) | 273 (96.1%) |
| 15 Years | 83 (66.4%) | 30 (62.5%) |
| 16 and 17 Years | 106 (68.8%) | 128 (74.0%) |
| 18 to 24 Years | 348 (70.7%) | 356 (79.6%) |
| 25 to 34 Years | 468 (82.1%) | 558 (65.3%) |
| 35 to 44 Years | 567 (86.8%) | 406 (80.1%) |
| 45 to 54 Years | 336 (73.4%) | 592 (76.0%) |
| 55 to 64 Years | 499 (81.3%) | 482 (73.3%) |
| 65 to 74 Years | 391 (87.9%) | 544 (87.6%) |
| 75 Years and over | 180 (89.5%) | 417 (79.3%) |
| Total | 3,537 (77.4%) | 4,251 (76.2%) |
Income Below Poverty Among Married-Couple Families in Okmulgee
The poverty statistics for married-couple families in Okmulgee show that 10.2% or 121 of the total 1,192 families live below the poverty line. Families with 5 or more children have the highest poverty rate of 50.0%, comprising of 11 families. On the other hand, families with no children have the lowest poverty rate of 4.5%, which includes 31 families.
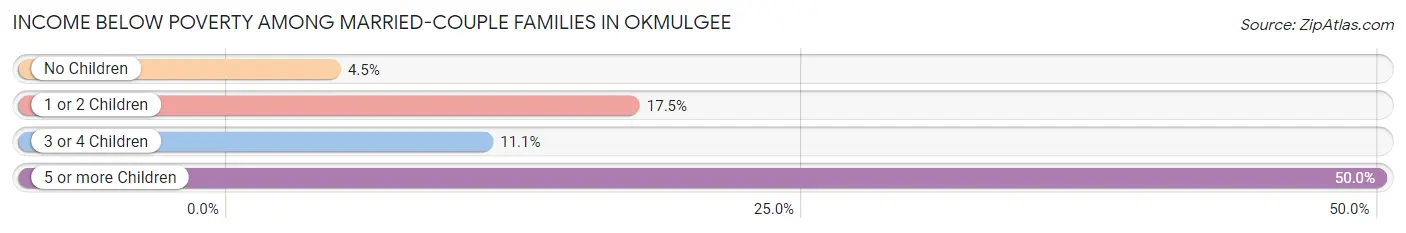
| Children | Above Poverty | Below Poverty |
| No Children | 661 (95.5%) | 31 (4.5%) |
| 1 or 2 Children | 335 (82.5%) | 71 (17.5%) |
| 3 or 4 Children | 64 (88.9%) | 8 (11.1%) |
| 5 or more Children | 11 (50.0%) | 11 (50.0%) |
| Total | 1,071 (89.8%) | 121 (10.2%) |
Income Below Poverty Among Single-Parent Households in Okmulgee
According to the poverty data in Okmulgee, 20.6% or 56 single-father households and 32.5% or 308 single-mother households are living below the poverty line. Among single-father households, those with no children have the highest poverty rate, with 41 households (30.1%) experiencing poverty. Likewise, among single-mother households, those with 3 or 4 children have the highest poverty rate, with 44 households (67.7%) falling below the poverty line.
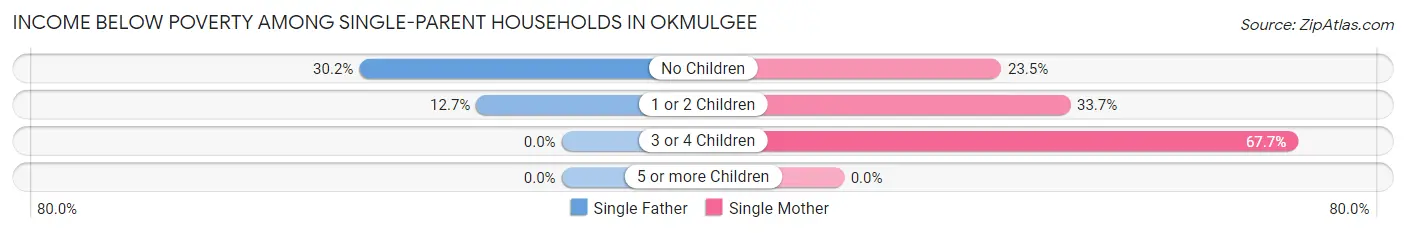
| Children | Single Father | Single Mother |
| No Children | 41 (30.1%) | 68 (23.4%) |
| 1 or 2 Children | 15 (12.7%) | 196 (33.7%) |
| 3 or 4 Children | 0 (0.0%) | 44 (67.7%) |
| 5 or more Children | 0 (0.0%) | 0 (0.0%) |
| Total | 56 (20.6%) | 308 (32.5%) |
Income Below Poverty Among Married-Couple vs Single-Parent Households in Okmulgee
The poverty data for Okmulgee shows that 121 of the married-couple family households (10.2%) and 364 of the single-parent households (29.8%) are living below the poverty level. Within the married-couple family households, those with 5 or more children have the highest poverty rate, with 11 households (50.0%) falling below the poverty line. Among the single-parent households, those with 3 or 4 children have the highest poverty rate, with 44 household (53.0%) living below poverty.
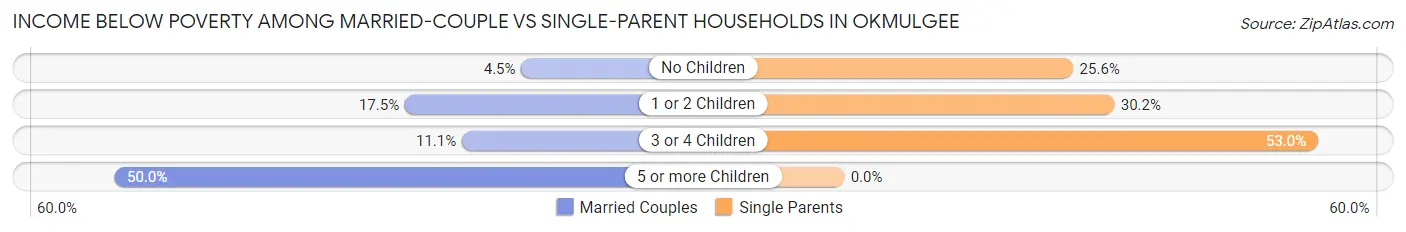
| Children | Married-Couple Families | Single-Parent Households |
| No Children | 31 (4.5%) | 109 (25.6%) |
| 1 or 2 Children | 71 (17.5%) | 211 (30.2%) |
| 3 or 4 Children | 8 (11.1%) | 44 (53.0%) |
| 5 or more Children | 11 (50.0%) | 0 (0.0%) |
| Total | 121 (10.2%) | 364 (29.8%) |
Race in Okmulgee
The most populous races in Okmulgee are White / Caucasian (6,013 | 52.9%), Native / Alaskan (1,880 | 16.5%), and Black / African American (1,802 | 15.9%).
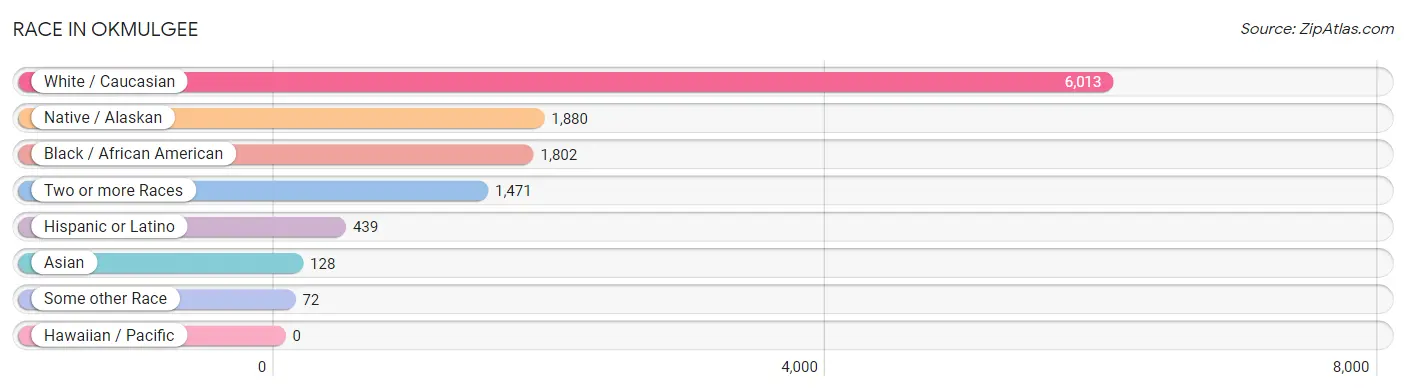
| Race | # Population | % Population |
| Asian | 128 | 1.1% |
| Black / African American | 1,802 | 15.9% |
| Hawaiian / Pacific | 0 | 0.0% |
| Hispanic or Latino | 439 | 3.9% |
| Native / Alaskan | 1,880 | 16.5% |
| White / Caucasian | 6,013 | 52.9% |
| Two or more Races | 1,471 | 12.9% |
| Some other Race | 72 | 0.6% |
| Total | 11,366 | 100.0% |
Ancestry in Okmulgee
The most populous ancestries reported in Okmulgee are Creek (1,490 | 13.1%), German (961 | 8.5%), English (932 | 8.2%), Irish (921 | 8.1%), and Cherokee (819 | 7.2%), together accounting for 45.1% of all Okmulgee residents.
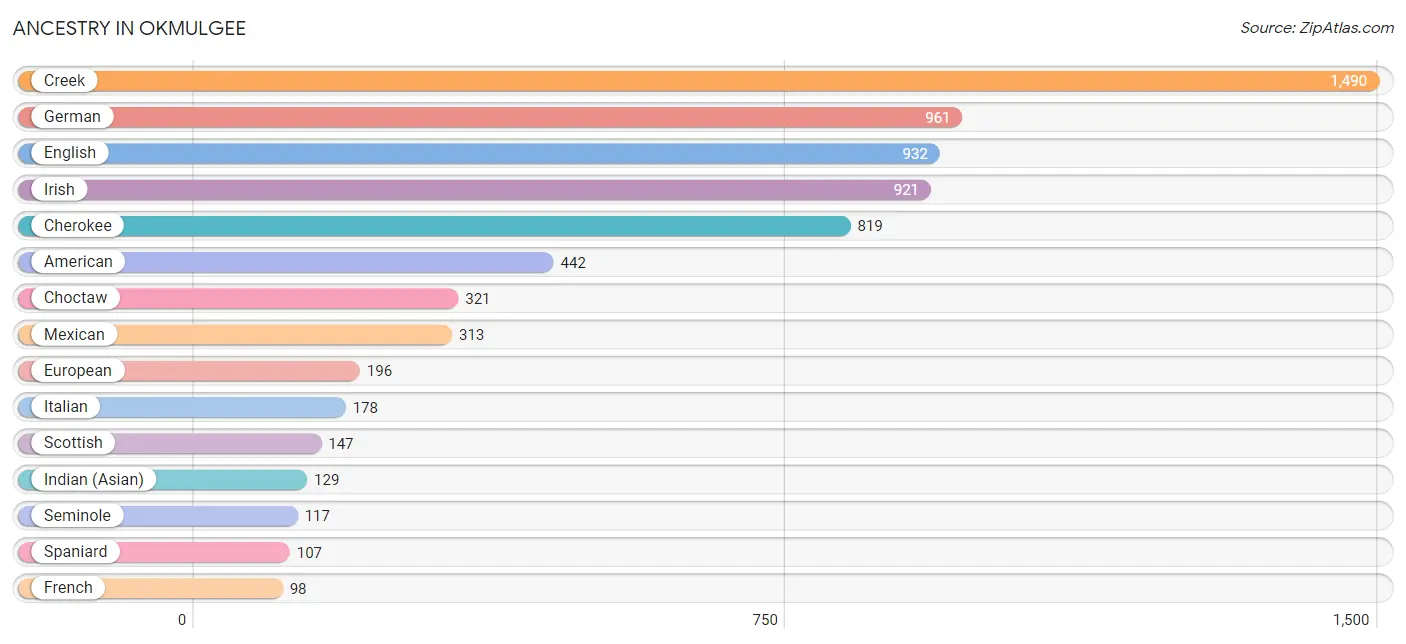
| Ancestry | # Population | % Population |
| African | 39 | 0.3% |
| American | 442 | 3.9% |
| Arapaho | 13 | 0.1% |
| British | 40 | 0.4% |
| Cherokee | 819 | 7.2% |
| Chickasaw | 59 | 0.5% |
| Chippewa | 19 | 0.2% |
| Choctaw | 321 | 2.8% |
| Colville | 12 | 0.1% |
| Creek | 1,490 | 13.1% |
| Croatian | 6 | 0.1% |
| Czech | 26 | 0.2% |
| Danish | 20 | 0.2% |
| Dutch | 32 | 0.3% |
| Dutch West Indian | 23 | 0.2% |
| English | 932 | 8.2% |
| European | 196 | 1.7% |
| Finnish | 9 | 0.1% |
| French | 98 | 0.9% |
| French Canadian | 39 | 0.3% |
| German | 961 | 8.5% |
| Hungarian | 5 | 0.0% |
| Indian (Asian) | 129 | 1.1% |
| Irish | 921 | 8.1% |
| Iroquois | 7 | 0.1% |
| Italian | 178 | 1.6% |
| Jamaican | 12 | 0.1% |
| Kiowa | 10 | 0.1% |
| Korean | 73 | 0.6% |
| Lumbee | 5 | 0.0% |
| Mexican | 313 | 2.8% |
| Native Hawaiian | 73 | 0.6% |
| Nigerian | 27 | 0.2% |
| Norwegian | 74 | 0.6% |
| Polish | 95 | 0.8% |
| Puerto Rican | 10 | 0.1% |
| Russian | 38 | 0.3% |
| Scotch-Irish | 74 | 0.6% |
| Scottish | 147 | 1.3% |
| Seminole | 117 | 1.0% |
| Spaniard | 107 | 0.9% |
| Sri Lankan | 14 | 0.1% |
| Subsaharan African | 58 | 0.5% |
| Swedish | 45 | 0.4% |
| Thai | 50 | 0.4% |
| Welsh | 7 | 0.1% | View All 46 Rows |
Immigrants in Okmulgee
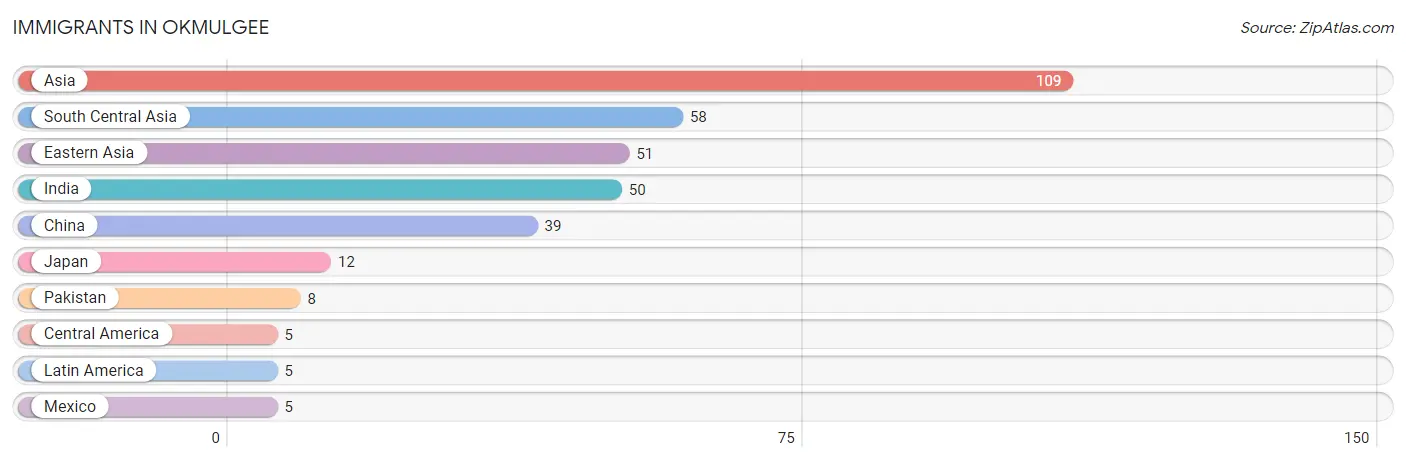
The most numerous immigrant groups reported in Okmulgee came from Asia (109 | 1.0%), South Central Asia (58 | 0.5%), Eastern Asia (51 | 0.4%), India (50 | 0.4%), and China (39 | 0.3%), together accounting for 2.7% of all Okmulgee residents.
| Immigration Origin | # Population | % Population |
| Asia | 109 | 1.0% |
| Central America | 5 | 0.0% |
| China | 39 | 0.3% |
| Eastern Asia | 51 | 0.4% |
| India | 50 | 0.4% |
| Japan | 12 | 0.1% |
| Latin America | 5 | 0.0% |
| Mexico | 5 | 0.0% |
| Pakistan | 8 | 0.1% |
| South Central Asia | 58 | 0.5% | View All 10 Rows |
Sex and Age in Okmulgee
Sex and Age in Okmulgee
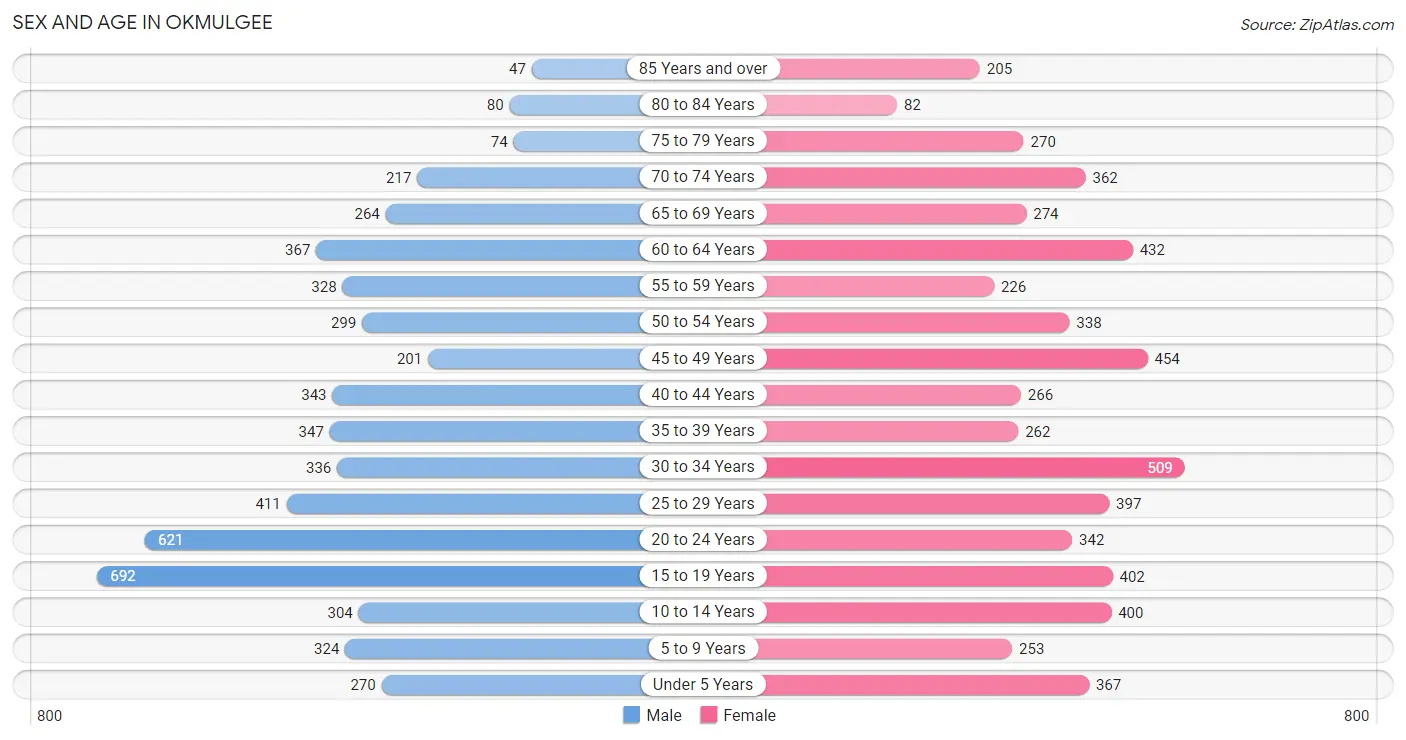
The most populous age groups in Okmulgee are 15 to 19 Years (692 | 12.5%) for men and 30 to 34 Years (509 | 8.7%) for women.
| Age Bracket | Male | Female |
| Under 5 Years | 270 (4.9%) | 367 (6.3%) |
| 5 to 9 Years | 324 (5.9%) | 253 (4.3%) |
| 10 to 14 Years | 304 (5.5%) | 400 (6.9%) |
| 15 to 19 Years | 692 (12.5%) | 402 (6.9%) |
| 20 to 24 Years | 621 (11.2%) | 342 (5.9%) |
| 25 to 29 Years | 411 (7.4%) | 397 (6.8%) |
| 30 to 34 Years | 336 (6.1%) | 509 (8.7%) |
| 35 to 39 Years | 347 (6.3%) | 262 (4.5%) |
| 40 to 44 Years | 343 (6.2%) | 266 (4.5%) |
| 45 to 49 Years | 201 (3.6%) | 454 (7.8%) |
| 50 to 54 Years | 299 (5.4%) | 338 (5.8%) |
| 55 to 59 Years | 328 (5.9%) | 226 (3.9%) |
| 60 to 64 Years | 367 (6.6%) | 432 (7.4%) |
| 65 to 69 Years | 264 (4.8%) | 274 (4.7%) |
| 70 to 74 Years | 217 (3.9%) | 362 (6.2%) |
| 75 to 79 Years | 74 (1.3%) | 270 (4.6%) |
| 80 to 84 Years | 80 (1.5%) | 82 (1.4%) |
| 85 Years and over | 47 (0.9%) | 205 (3.5%) |
| Total | 5,525 (100.0%) | 5,841 (100.0%) |
Families and Households in Okmulgee
Median Family Size in Okmulgee
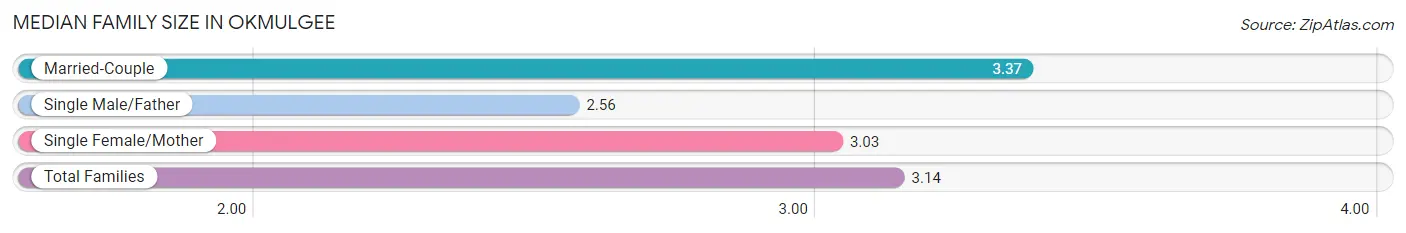
The median family size in Okmulgee is 3.14 persons per family, with married-couple families (1,192 | 49.4%) accounting for the largest median family size of 3.37 persons per family. On the other hand, single male/father families (272 | 11.3%) represent the smallest median family size with 2.56 persons per family.
| Family Type | # Families | Family Size |
| Married-Couple | 1,192 (49.4%) | 3.37 |
| Single Male/Father | 272 (11.3%) | 2.56 |
| Single Female/Mother | 949 (39.3%) | 3.03 |
| Total Families | 2,413 (100.0%) | 3.14 |
Median Household Size in Okmulgee
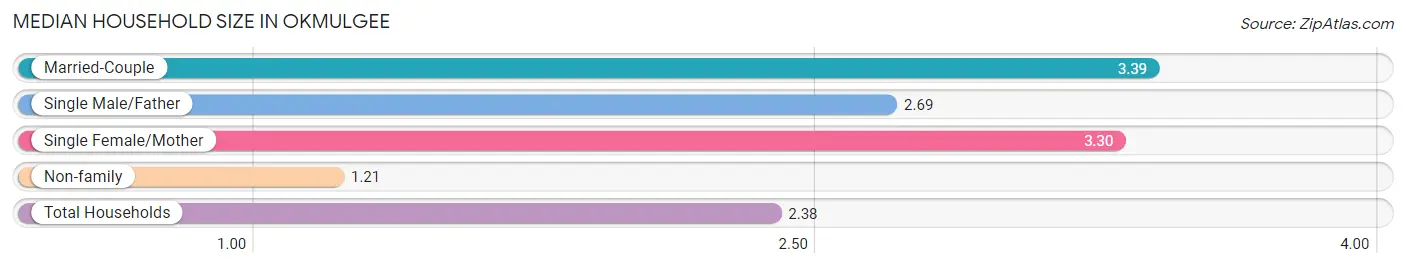
The median household size in Okmulgee is 2.38 persons per household, with married-couple households (1,192 | 27.9%) accounting for the largest median household size of 3.39 persons per household. non-family households (1,854 | 43.4%) represent the smallest median household size with 1.21 persons per household.
| Household Type | # Households | Household Size |
| Married-Couple | 1,192 (27.9%) | 3.39 |
| Single Male/Father | 272 (6.4%) | 2.69 |
| Single Female/Mother | 949 (22.2%) | 3.30 |
| Non-family | 1,854 (43.4%) | 1.21 |
| Total Households | 4,267 (100.0%) | 2.38 |
Household Size by Marriage Status in Okmulgee
Out of a total of 4,267 households in Okmulgee, 2,413 (56.6%) are family households, while 1,854 (43.4%) are nonfamily households. The most numerous type of family households are 2-person households, comprising 1,106, and the most common type of nonfamily households are 1-person households, comprising 1,619.
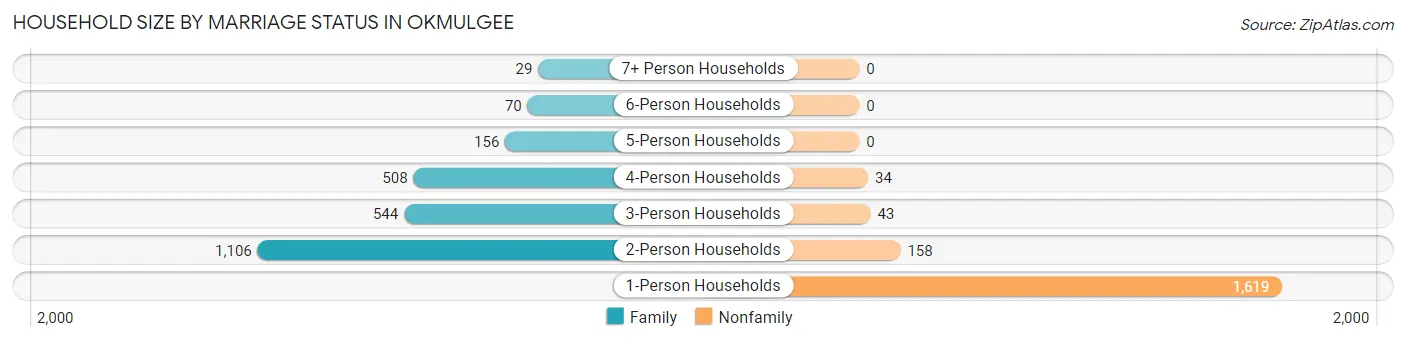
| Household Size | Family Households | Nonfamily Households |
| 1-Person Households | - | 1,619 (37.9%) |
| 2-Person Households | 1,106 (25.9%) | 158 (3.7%) |
| 3-Person Households | 544 (12.8%) | 43 (1.0%) |
| 4-Person Households | 508 (11.9%) | 34 (0.8%) |
| 5-Person Households | 156 (3.7%) | 0 (0.0%) |
| 6-Person Households | 70 (1.6%) | 0 (0.0%) |
| 7+ Person Households | 29 (0.7%) | 0 (0.0%) |
| Total | 2,413 (56.6%) | 1,854 (43.4%) |
Female Fertility in Okmulgee
Fertility by Age in Okmulgee
Average fertility rate in Okmulgee is 37.0 births per 1,000 women. Women in the age bracket of 20 to 34 years have the highest fertility rate with 53.0 births per 1,000 women. Women in the age bracket of 20 to 34 years acount for 67.3% of all women with births.
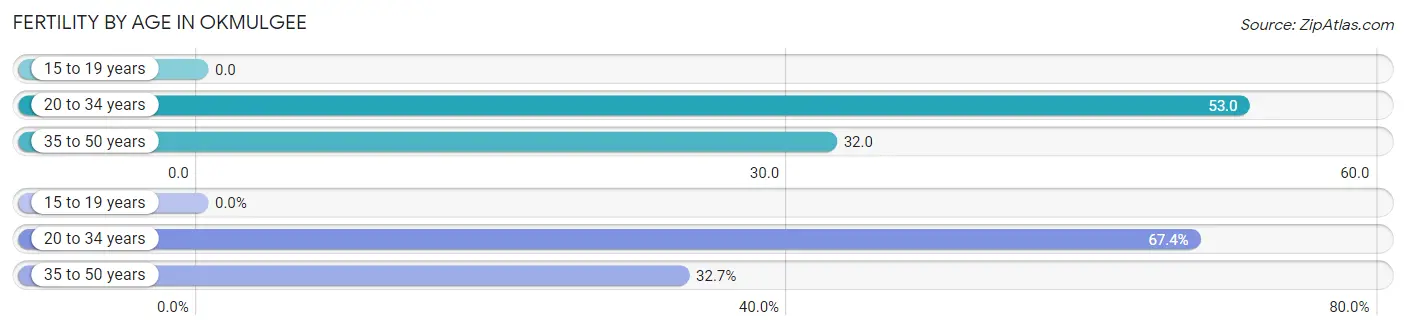
| Age Bracket | Women with Births | Births / 1,000 Women |
| 15 to 19 years | 0 (0.0%) | 0.0 |
| 20 to 34 years | 66 (67.3%) | 53.0 |
| 35 to 50 years | 32 (32.7%) | 32.0 |
| Total | 98 (100.0%) | 37.0 |
Fertility by Age by Marriage Status in Okmulgee
59.2% of women with births (98) in Okmulgee are married. The highest percentage of unmarried women with births falls into 20 to 34 years age bracket with 60.6% of them unmarried at the time of birth, while the lowest percentage of unmarried women with births belong to 35 to 50 years age bracket with 0.0% of them unmarried.
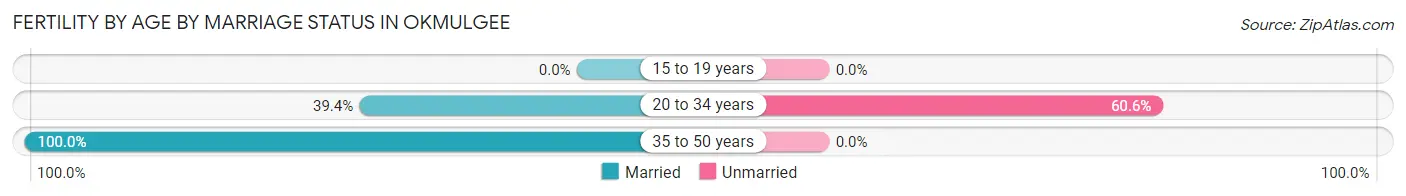
| Age Bracket | Married | Unmarried |
| 15 to 19 years | 0 (0.0%) | 0 (0.0%) |
| 20 to 34 years | 26 (39.4%) | 40 (60.6%) |
| 35 to 50 years | 32 (100.0%) | 0 (0.0%) |
| Total | 58 (59.2%) | 40 (40.8%) |
Fertility by Education in Okmulgee
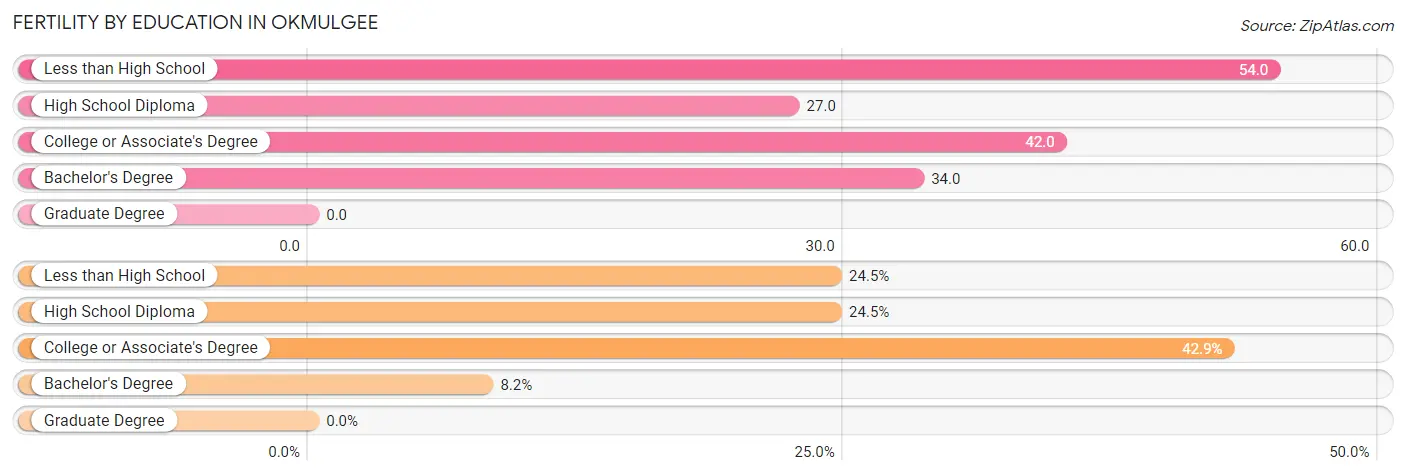
| Educational Attainment | Women with Births | Births / 1,000 Women |
| Less than High School | 24 (24.5%) | 54.0 |
| High School Diploma | 24 (24.5%) | 27.0 |
| College or Associate's Degree | 42 (42.9%) | 42.0 |
| Bachelor's Degree | 8 (8.2%) | 34.0 |
| Graduate Degree | 0 (0.0%) | 0.0 |
| Total | 98 (100.0%) | 37.0 |
Fertility by Education by Marriage Status in Okmulgee
40.8% of women with births in Okmulgee are unmarried. Women with the educational attainment of bachelor's degree are most likely to be married with 100.0% of them married at childbirth, while women with the educational attainment of less than high school are least likely to be married with 100.0% of them unmarried at childbirth.
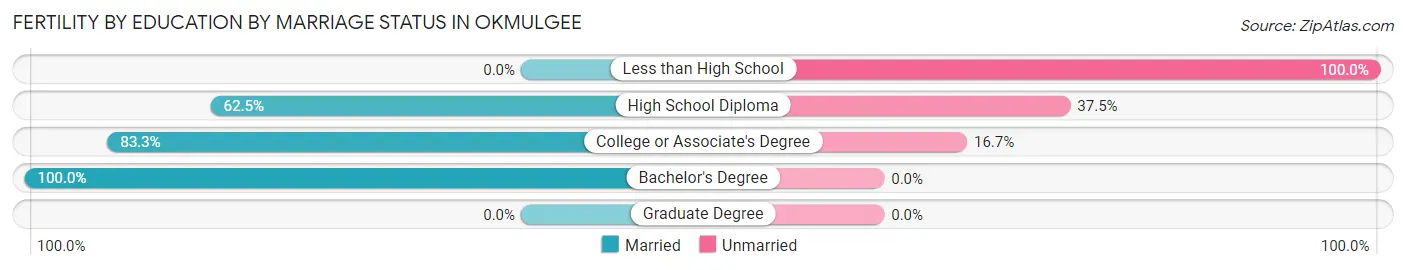
| Educational Attainment | Married | Unmarried |
| Less than High School | 0 (0.0%) | 24 (100.0%) |
| High School Diploma | 15 (62.5%) | 9 (37.5%) |
| College or Associate's Degree | 35 (83.3%) | 7 (16.7%) |
| Bachelor's Degree | 8 (100.0%) | 0 (0.0%) |
| Graduate Degree | 0 (0.0%) | 0 (0.0%) |
| Total | 58 (59.2%) | 40 (40.8%) |
Employment Characteristics in Okmulgee
Employment by Class of Employer in Okmulgee
Among the 4,241 employed individuals in Okmulgee, private company employees (2,772 | 65.4%), local government employees (478 | 11.3%), and not-for-profit organizations (348 | 8.2%) make up the most common classes of employment.
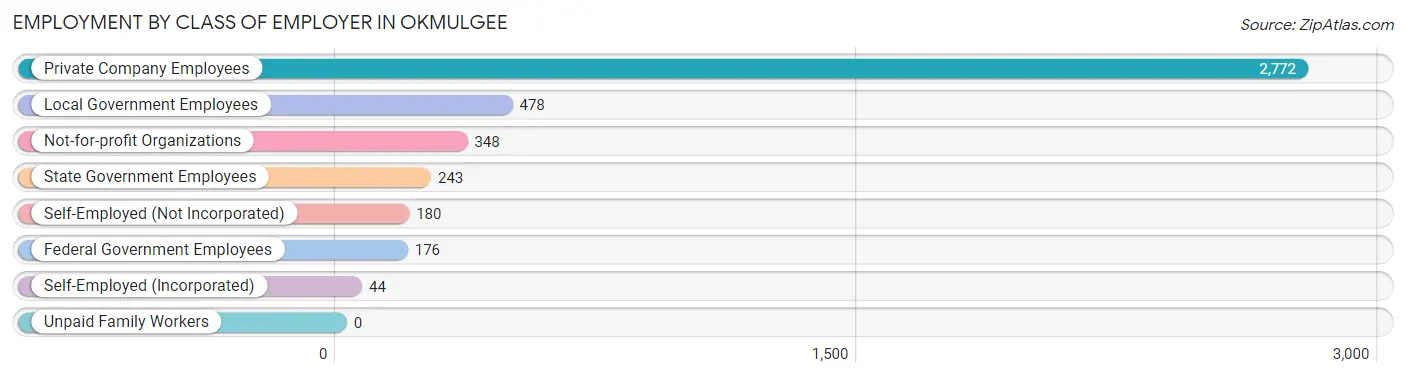
| Employer Class | # Employees | % Employees |
| Private Company Employees | 2,772 | 65.4% |
| Self-Employed (Incorporated) | 44 | 1.0% |
| Self-Employed (Not Incorporated) | 180 | 4.2% |
| Not-for-profit Organizations | 348 | 8.2% |
| Local Government Employees | 478 | 11.3% |
| State Government Employees | 243 | 5.7% |
| Federal Government Employees | 176 | 4.2% |
| Unpaid Family Workers | 0 | 0.0% |
| Total | 4,241 | 100.0% |
Employment Status by Age in Okmulgee
According to the labor force statistics for Okmulgee, out of the total population over 16 years of age (9,275), 51.3% or 4,758 individuals are in the labor force, with 9.2% or 438 of them unemployed. The age group with the highest labor force participation rate is 35 to 44 years, with 76.4% or 931 individuals in the labor force. Within the labor force, the 30 to 34 years age range has the highest percentage of unemployed individuals, with 20.1% or 123 of them being unemployed.
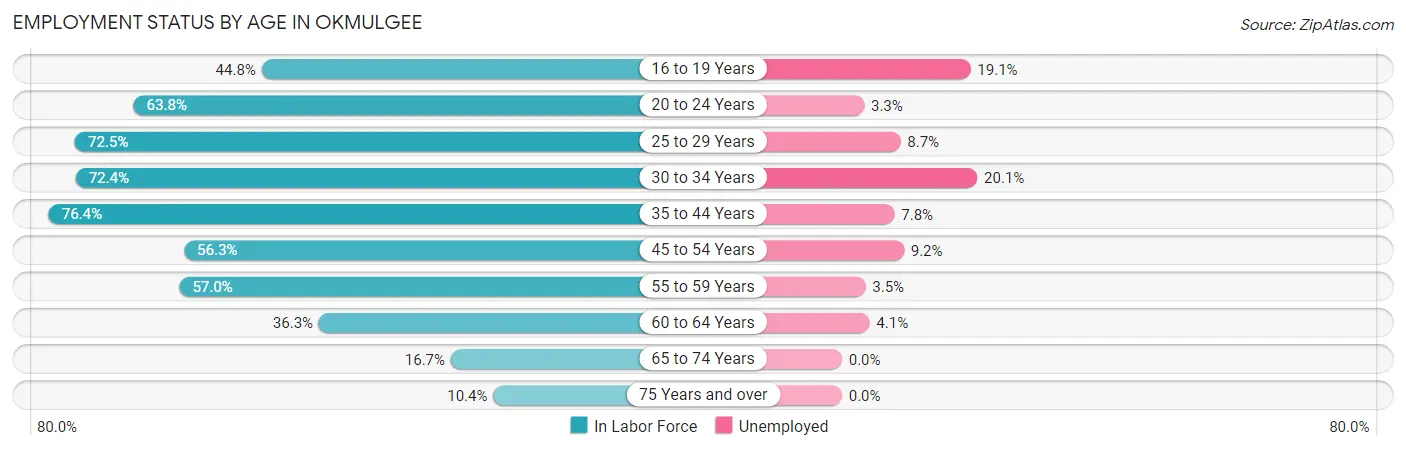
| Age Bracket | In Labor Force | Unemployed |
| 16 to 19 Years | 413 (44.8%) | 79 (19.1%) |
| 20 to 24 Years | 614 (63.8%) | 20 (3.3%) |
| 25 to 29 Years | 586 (72.5%) | 51 (8.7%) |
| 30 to 34 Years | 612 (72.4%) | 123 (20.1%) |
| 35 to 44 Years | 931 (76.4%) | 73 (7.8%) |
| 45 to 54 Years | 727 (56.3%) | 67 (9.2%) |
| 55 to 59 Years | 316 (57.0%) | 11 (3.5%) |
| 60 to 64 Years | 290 (36.3%) | 12 (4.1%) |
| 65 to 74 Years | 187 (16.7%) | 0 (0.0%) |
| 75 Years and over | 79 (10.4%) | 0 (0.0%) |
| Total | 4,758 (51.3%) | 438 (9.2%) |
Employment Status by Educational Attainment in Okmulgee
According to labor force statistics for Okmulgee, 62.8% of individuals (3,464) out of the total population between 25 and 64 years of age (5,516) are in the labor force, with 9.7% or 336 of them being unemployed. The group with the highest labor force participation rate are those with the educational attainment of bachelor's degree or higher, with 88.6% or 568 individuals in the labor force. Within the labor force, individuals with less than high school education have the highest percentage of unemployment, with 13.2% or 49 of them being unemployed.
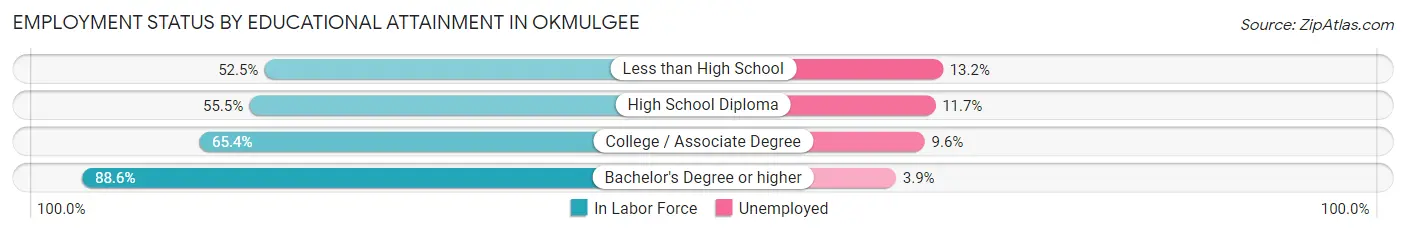
| Educational Attainment | In Labor Force | Unemployed |
| Less than High School | 371 (52.5%) | 93 (13.2%) |
| High School Diploma | 1,133 (55.5%) | 239 (11.7%) |
| College / Associate Degree | 1,391 (65.4%) | 204 (9.6%) |
| Bachelor's Degree or higher | 568 (88.6%) | 25 (3.9%) |
| Total | 3,464 (62.8%) | 535 (9.7%) |
Employment Occupations by Sex in Okmulgee
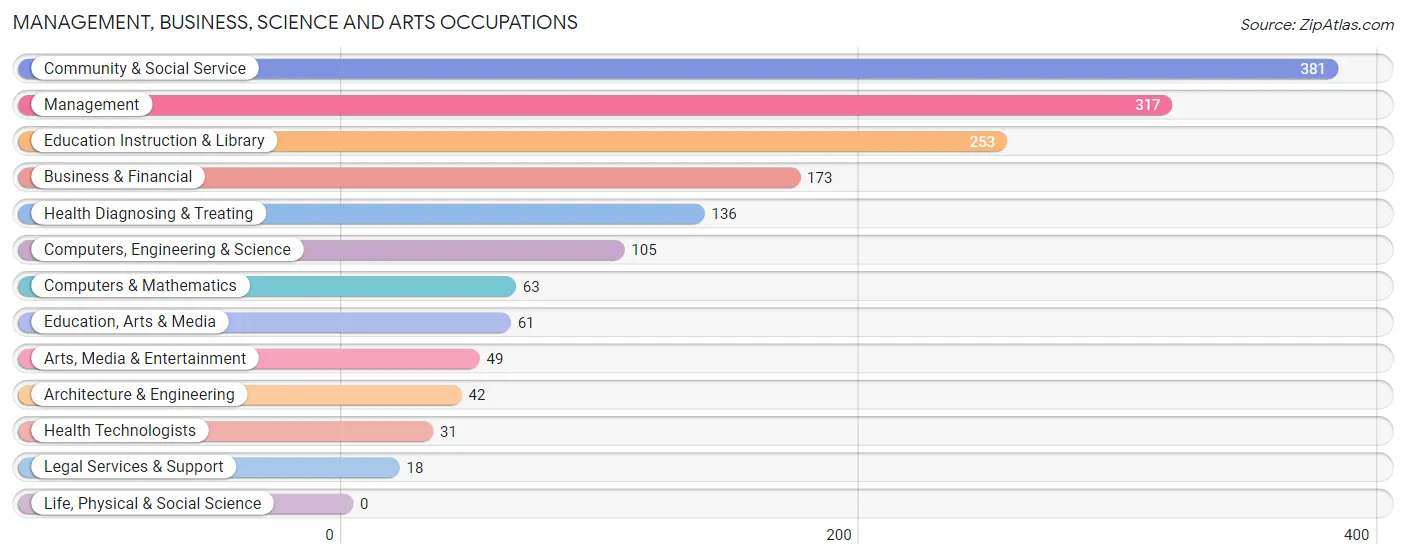
Management, Business, Science and Arts Occupations
The most common Management, Business, Science and Arts occupations in Okmulgee are Community & Social Service (381 | 8.8%), Management (317 | 7.3%), Education Instruction & Library (253 | 5.9%), Business & Financial (173 | 4.0%), and Health Diagnosing & Treating (136 | 3.2%).
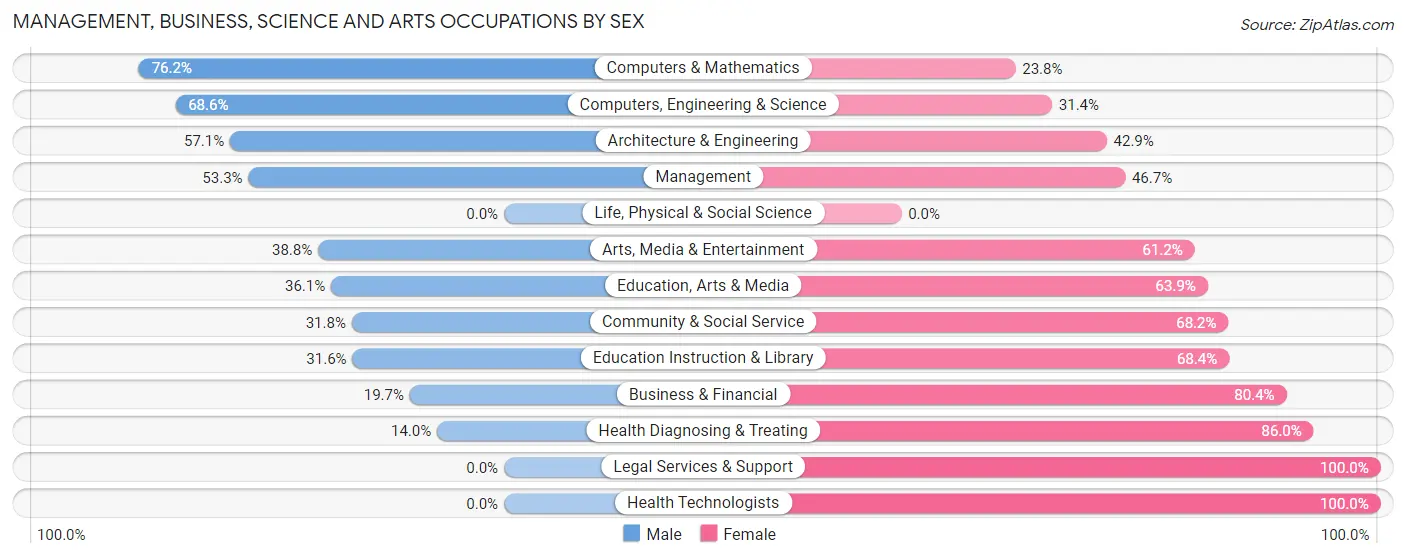
Management, Business, Science and Arts Occupations by Sex
Within the Management, Business, Science and Arts occupations in Okmulgee, the most male-oriented occupations are Computers & Mathematics (76.2%), Computers, Engineering & Science (68.6%), and Architecture & Engineering (57.1%), while the most female-oriented occupations are Legal Services & Support (100.0%), Health Technologists (100.0%), and Health Diagnosing & Treating (86.0%).
| Occupation | Male | Female |
| Management | 169 (53.3%) | 148 (46.7%) |
| Business & Financial | 34 (19.7%) | 139 (80.3%) |
| Computers, Engineering & Science | 72 (68.6%) | 33 (31.4%) |
| Computers & Mathematics | 48 (76.2%) | 15 (23.8%) |
| Architecture & Engineering | 24 (57.1%) | 18 (42.9%) |
| Life, Physical & Social Science | 0 (0.0%) | 0 (0.0%) |
| Community & Social Service | 121 (31.8%) | 260 (68.2%) |
| Education, Arts & Media | 22 (36.1%) | 39 (63.9%) |
| Legal Services & Support | 0 (0.0%) | 18 (100.0%) |
| Education Instruction & Library | 80 (31.6%) | 173 (68.4%) |
| Arts, Media & Entertainment | 19 (38.8%) | 30 (61.2%) |
| Health Diagnosing & Treating | 19 (14.0%) | 117 (86.0%) |
| Health Technologists | 0 (0.0%) | 31 (100.0%) |
| Total (Category) | 415 (37.3%) | 697 (62.7%) |
| Total (Overall) | 2,147 (49.7%) | 2,171 (50.3%) |
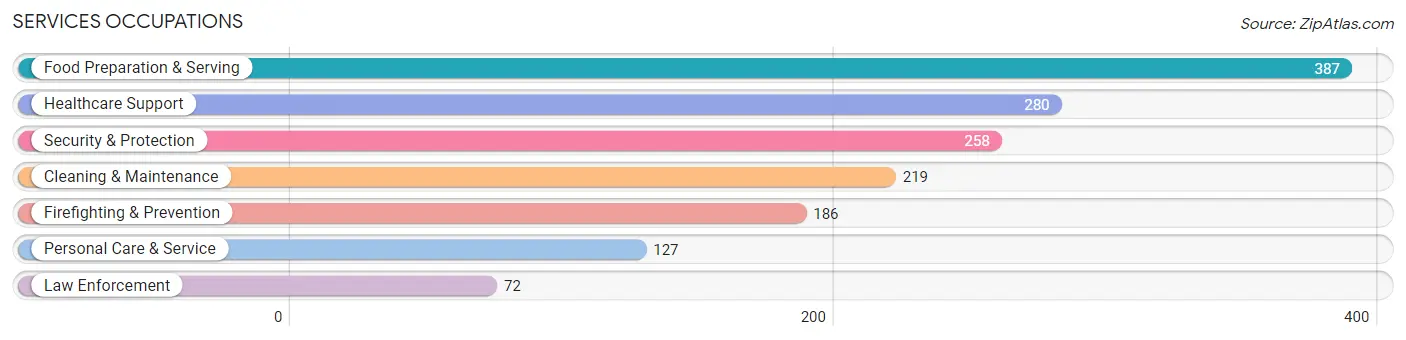
Services Occupations
The most common Services occupations in Okmulgee are Food Preparation & Serving (387 | 9.0%), Healthcare Support (280 | 6.5%), Security & Protection (258 | 6.0%), Cleaning & Maintenance (219 | 5.1%), and Firefighting & Prevention (186 | 4.3%).
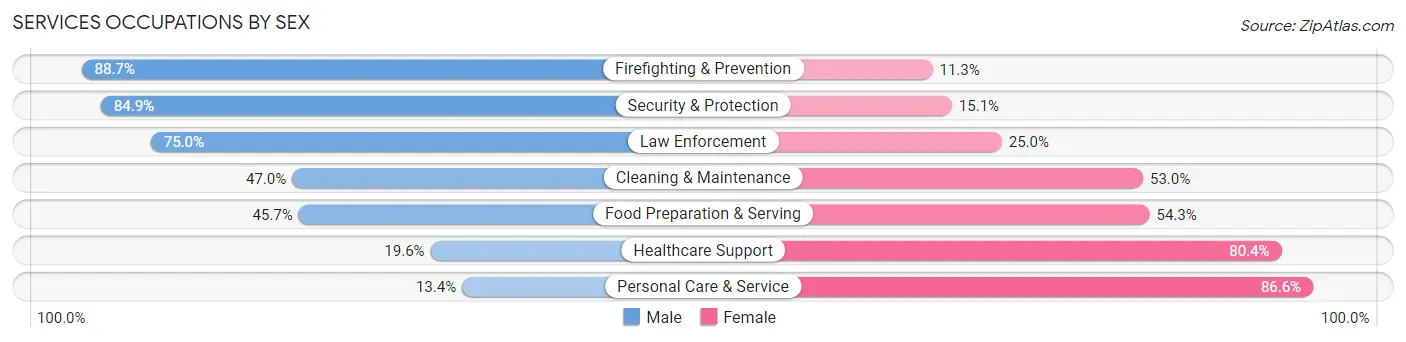
Services Occupations by Sex
Within the Services occupations in Okmulgee, the most male-oriented occupations are Firefighting & Prevention (88.7%), Security & Protection (84.9%), and Law Enforcement (75.0%), while the most female-oriented occupations are Personal Care & Service (86.6%), Healthcare Support (80.4%), and Food Preparation & Serving (54.3%).
| Occupation | Male | Female |
| Healthcare Support | 55 (19.6%) | 225 (80.4%) |
| Security & Protection | 219 (84.9%) | 39 (15.1%) |
| Firefighting & Prevention | 165 (88.7%) | 21 (11.3%) |
| Law Enforcement | 54 (75.0%) | 18 (25.0%) |
| Food Preparation & Serving | 177 (45.7%) | 210 (54.3%) |
| Cleaning & Maintenance | 103 (47.0%) | 116 (53.0%) |
| Personal Care & Service | 17 (13.4%) | 110 (86.6%) |
| Total (Category) | 571 (44.9%) | 700 (55.1%) |
| Total (Overall) | 2,147 (49.7%) | 2,171 (50.3%) |
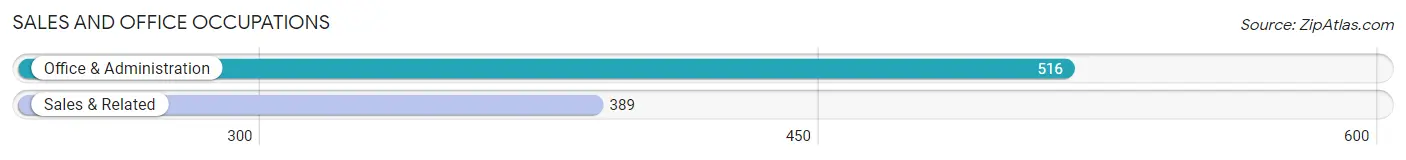
Sales and Office Occupations
The most common Sales and Office occupations in Okmulgee are Office & Administration (516 | 11.9%), and Sales & Related (389 | 9.0%).
Sales and Office Occupations by Sex
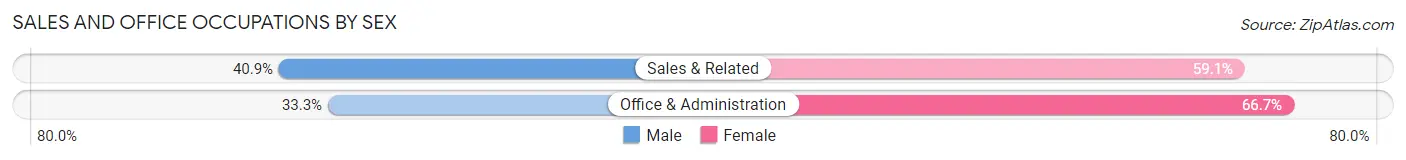
| Occupation | Male | Female |
| Sales & Related | 159 (40.9%) | 230 (59.1%) |
| Office & Administration | 172 (33.3%) | 344 (66.7%) |
| Total (Category) | 331 (36.6%) | 574 (63.4%) |
| Total (Overall) | 2,147 (49.7%) | 2,171 (50.3%) |
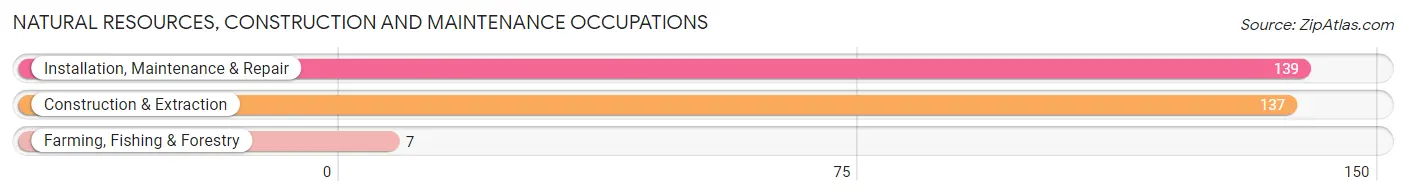
Natural Resources, Construction and Maintenance Occupations
The most common Natural Resources, Construction and Maintenance occupations in Okmulgee are Installation, Maintenance & Repair (139 | 3.2%), Construction & Extraction (137 | 3.2%), and Farming, Fishing & Forestry (7 | 0.2%).
Natural Resources, Construction and Maintenance Occupations by Sex
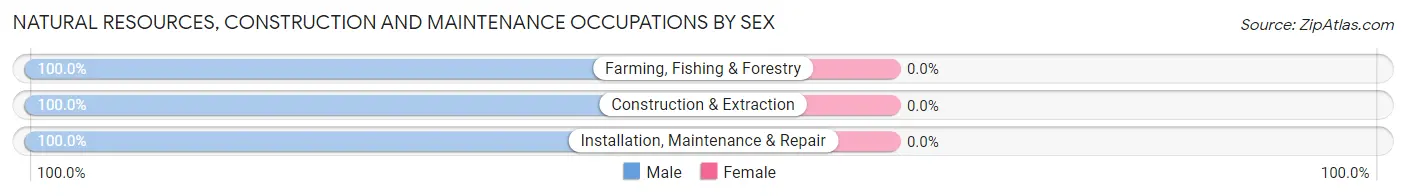
| Occupation | Male | Female |
| Farming, Fishing & Forestry | 7 (100.0%) | 0 (0.0%) |
| Construction & Extraction | 137 (100.0%) | 0 (0.0%) |
| Installation, Maintenance & Repair | 139 (100.0%) | 0 (0.0%) |
| Total (Category) | 283 (100.0%) | 0 (0.0%) |
| Total (Overall) | 2,147 (49.7%) | 2,171 (50.3%) |
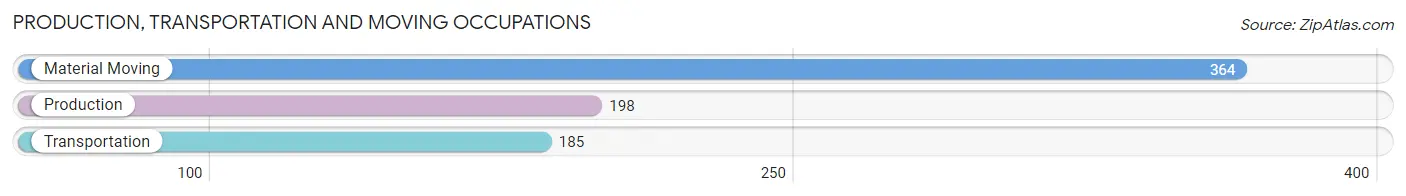
Production, Transportation and Moving Occupations
The most common Production, Transportation and Moving occupations in Okmulgee are Material Moving (364 | 8.4%), Production (198 | 4.6%), and Transportation (185 | 4.3%).
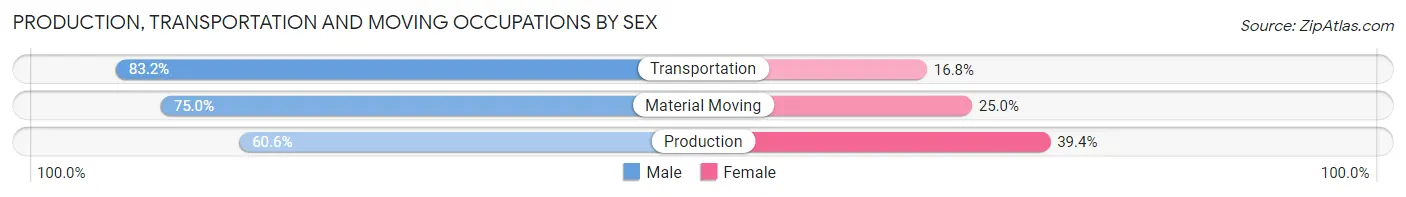
Production, Transportation and Moving Occupations by Sex
| Occupation | Male | Female |
| Production | 120 (60.6%) | 78 (39.4%) |
| Transportation | 154 (83.2%) | 31 (16.8%) |
| Material Moving | 273 (75.0%) | 91 (25.0%) |
| Total (Category) | 547 (73.2%) | 200 (26.8%) |
| Total (Overall) | 2,147 (49.7%) | 2,171 (50.3%) |
Employment Industries by Sex in Okmulgee
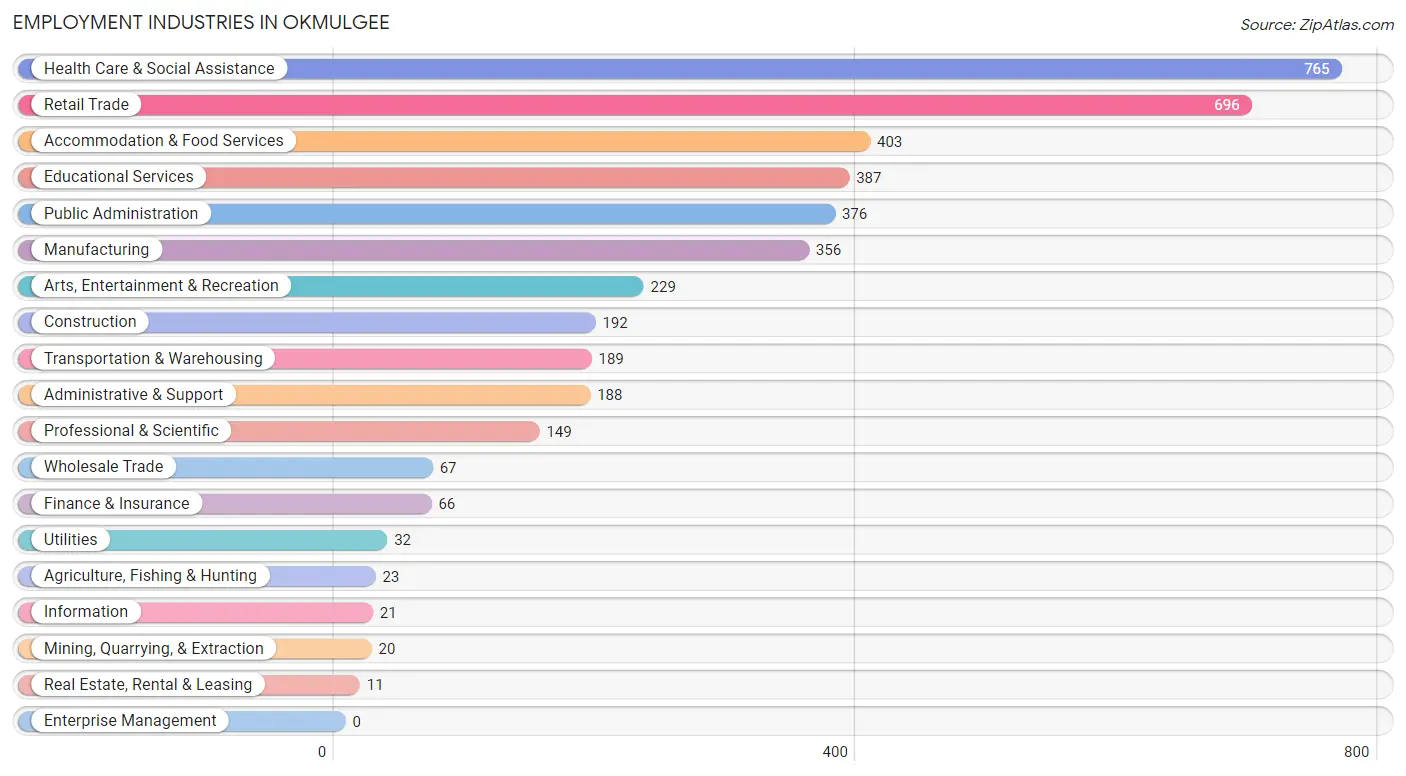
Employment Industries in Okmulgee
The major employment industries in Okmulgee include Health Care & Social Assistance (765 | 17.7%), Retail Trade (696 | 16.1%), Accommodation & Food Services (403 | 9.3%), Educational Services (387 | 9.0%), and Public Administration (376 | 8.7%).
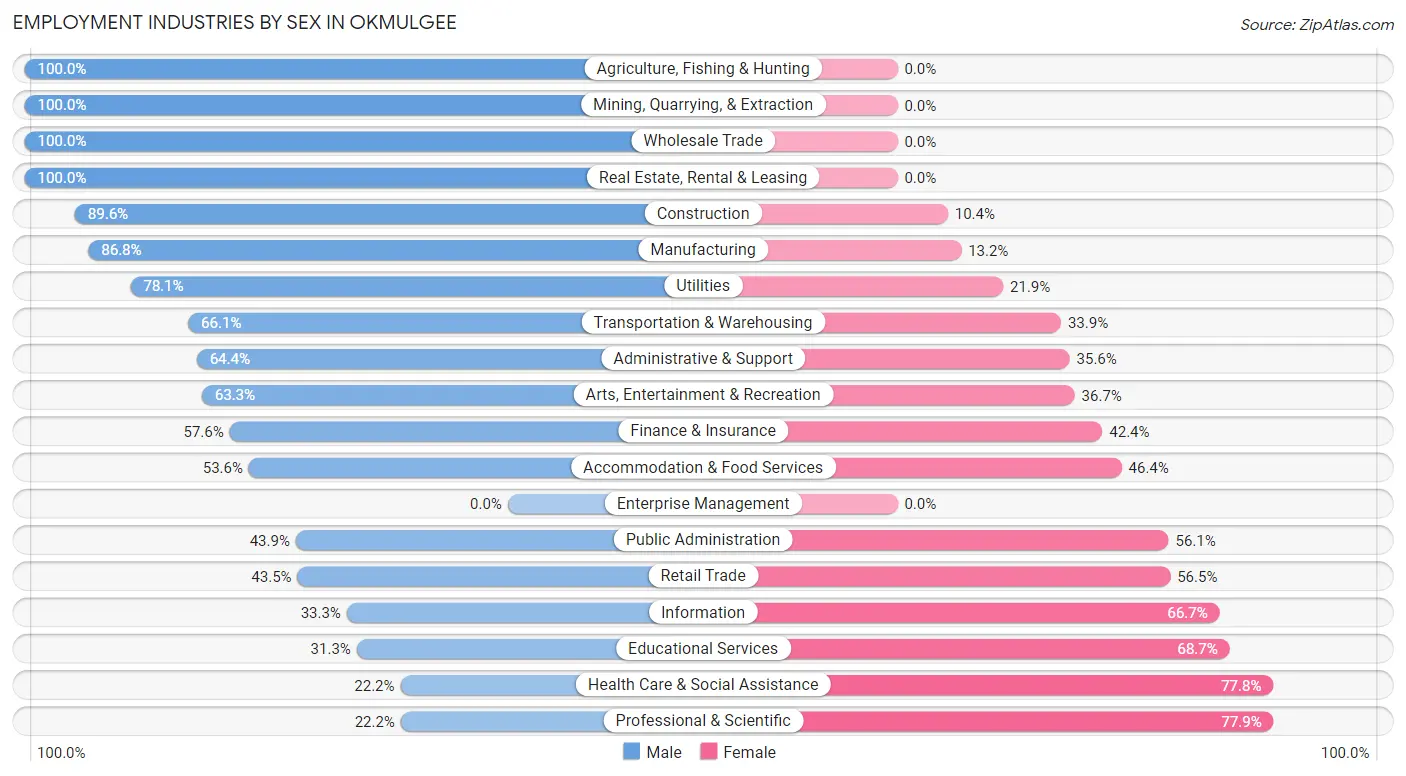
Employment Industries by Sex in Okmulgee
The Okmulgee industries that see more men than women are Agriculture, Fishing & Hunting (100.0%), Mining, Quarrying, & Extraction (100.0%), and Wholesale Trade (100.0%), whereas the industries that tend to have a higher number of women are Professional & Scientific (77.8%), Health Care & Social Assistance (77.8%), and Educational Services (68.7%).
| Industry | Male | Female |
| Agriculture, Fishing & Hunting | 23 (100.0%) | 0 (0.0%) |
| Mining, Quarrying, & Extraction | 20 (100.0%) | 0 (0.0%) |
| Construction | 172 (89.6%) | 20 (10.4%) |
| Manufacturing | 309 (86.8%) | 47 (13.2%) |
| Wholesale Trade | 67 (100.0%) | 0 (0.0%) |
| Retail Trade | 303 (43.5%) | 393 (56.5%) |
| Transportation & Warehousing | 125 (66.1%) | 64 (33.9%) |
| Utilities | 25 (78.1%) | 7 (21.9%) |
| Information | 7 (33.3%) | 14 (66.7%) |
| Finance & Insurance | 38 (57.6%) | 28 (42.4%) |
| Real Estate, Rental & Leasing | 11 (100.0%) | 0 (0.0%) |
| Professional & Scientific | 33 (22.2%) | 116 (77.8%) |
| Enterprise Management | 0 (0.0%) | 0 (0.0%) |
| Administrative & Support | 121 (64.4%) | 67 (35.6%) |
| Educational Services | 121 (31.3%) | 266 (68.7%) |
| Health Care & Social Assistance | 170 (22.2%) | 595 (77.8%) |
| Arts, Entertainment & Recreation | 145 (63.3%) | 84 (36.7%) |
| Accommodation & Food Services | 216 (53.6%) | 187 (46.4%) |
| Public Administration | 165 (43.9%) | 211 (56.1%) |
| Total | 2,147 (49.7%) | 2,171 (50.3%) |
Education in Okmulgee
School Enrollment in Okmulgee
The most common levels of schooling among the 2,898 students in Okmulgee are college / undergraduate (996 | 34.4%), middle school (578 | 19.9%), and elementary school (502 | 17.3%).
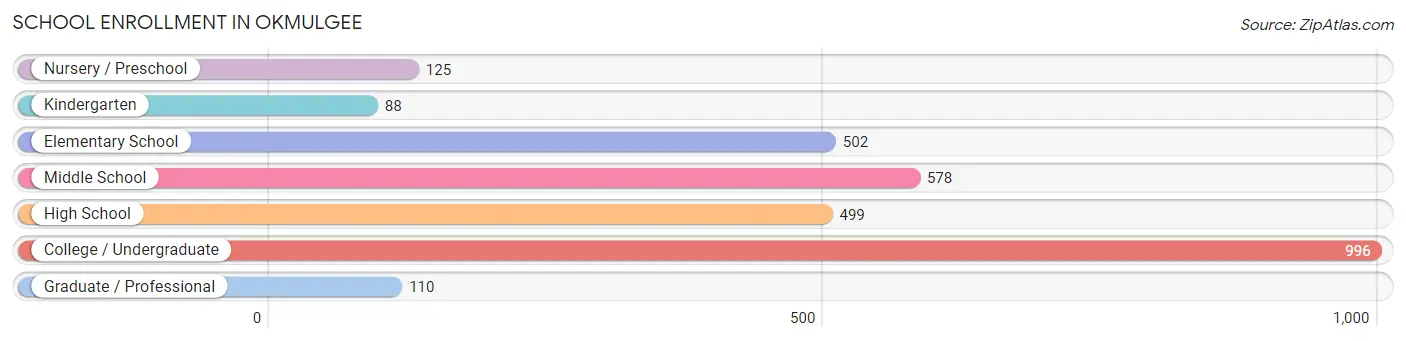
| School Level | # Students | % Students |
| Nursery / Preschool | 125 | 4.3% |
| Kindergarten | 88 | 3.0% |
| Elementary School | 502 | 17.3% |
| Middle School | 578 | 19.9% |
| High School | 499 | 17.2% |
| College / Undergraduate | 996 | 34.4% |
| Graduate / Professional | 110 | 3.8% |
| Total | 2,898 | 100.0% |
School Enrollment by Age by Funding Source in Okmulgee
Out of a total of 2,898 students who are enrolled in schools in Okmulgee, 380 (13.1%) attend a private institution, while the remaining 2,518 (86.9%) are enrolled in public schools. The age group of 15 to 17 year olds has the highest likelihood of being enrolled in private schools, with 105 (21.0% in the age bracket) enrolled. Conversely, the age group of 20 to 24 year olds has the lowest likelihood of being enrolled in a private school, with 253 (94.8% in the age bracket) attending a public institution.
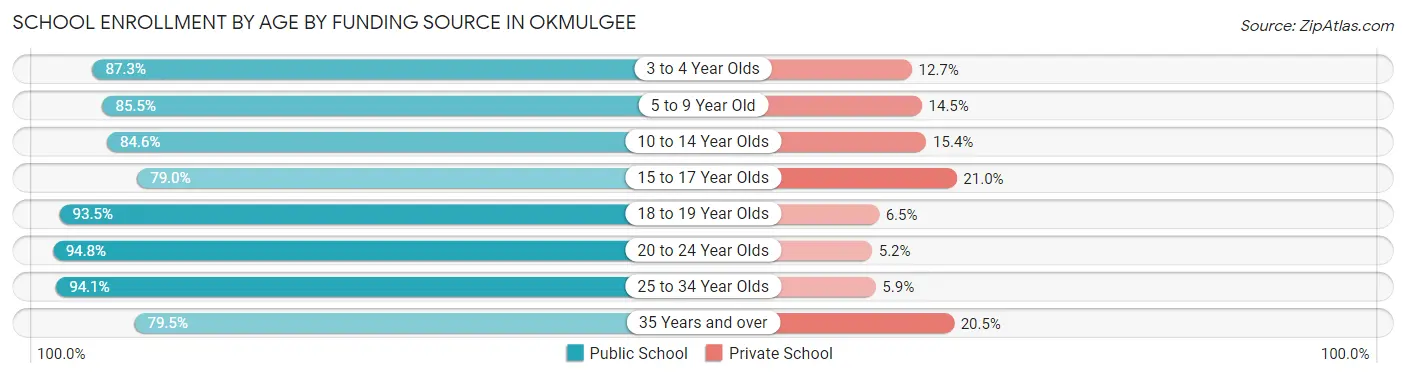
| Age Bracket | Public School | Private School |
| 3 to 4 Year Olds | 69 (87.3%) | 10 (12.7%) |
| 5 to 9 Year Old | 424 (85.5%) | 72 (14.5%) |
| 10 to 14 Year Olds | 584 (84.6%) | 106 (15.4%) |
| 15 to 17 Year Olds | 395 (79.0%) | 105 (21.0%) |
| 18 to 19 Year Olds | 458 (93.5%) | 32 (6.5%) |
| 20 to 24 Year Olds | 253 (94.8%) | 14 (5.2%) |
| 25 to 34 Year Olds | 239 (94.1%) | 15 (5.9%) |
| 35 Years and over | 97 (79.5%) | 25 (20.5%) |
| Total | 2,518 (86.9%) | 380 (13.1%) |
Educational Attainment by Field of Study in Okmulgee
Education (286 | 28.5%), business (191 | 19.1%), arts & humanities (108 | 10.8%), literature & languages (75 | 7.5%), and psychology (69 | 6.9%) are the most common fields of study among 1,002 individuals in Okmulgee who have obtained a bachelor's degree or higher.
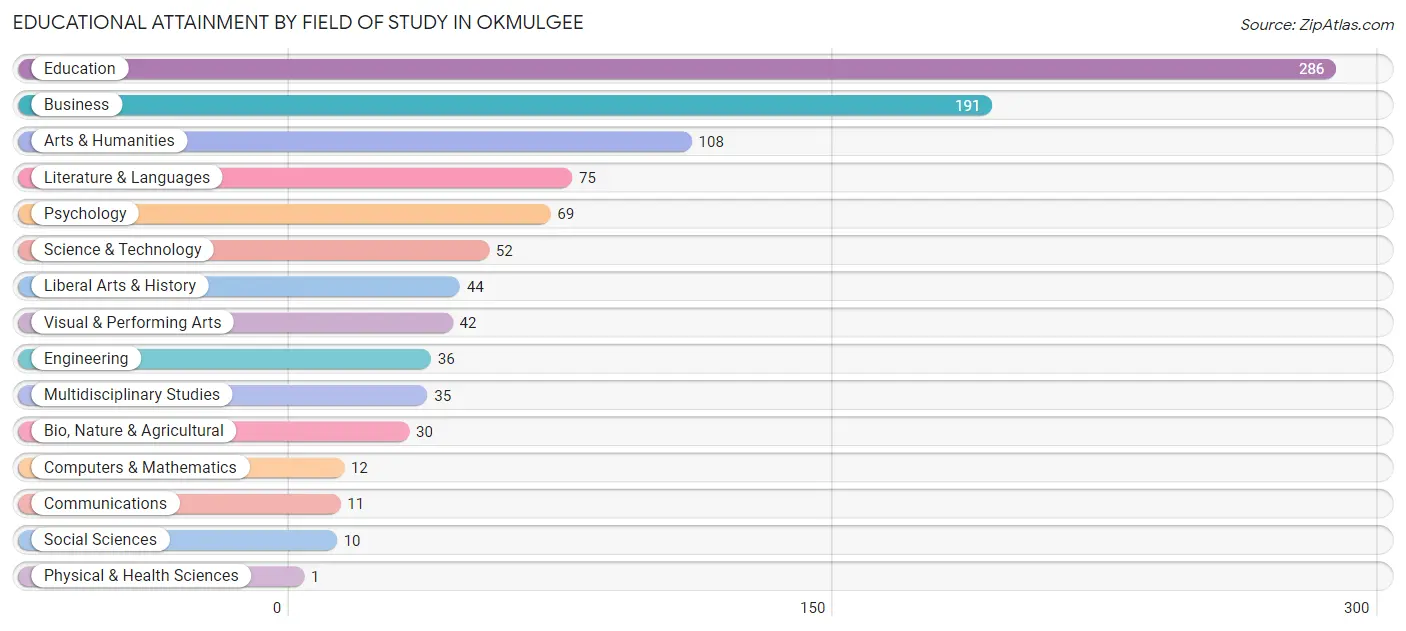
| Field of Study | # Graduates | % Graduates |
| Computers & Mathematics | 12 | 1.2% |
| Bio, Nature & Agricultural | 30 | 3.0% |
| Physical & Health Sciences | 1 | 0.1% |
| Psychology | 69 | 6.9% |
| Social Sciences | 10 | 1.0% |
| Engineering | 36 | 3.6% |
| Multidisciplinary Studies | 35 | 3.5% |
| Science & Technology | 52 | 5.2% |
| Business | 191 | 19.1% |
| Education | 286 | 28.5% |
| Literature & Languages | 75 | 7.5% |
| Liberal Arts & History | 44 | 4.4% |
| Visual & Performing Arts | 42 | 4.2% |
| Communications | 11 | 1.1% |
| Arts & Humanities | 108 | 10.8% |
| Total | 1,002 | 100.0% |
Transportation & Commute in Okmulgee
Vehicle Availability by Sex in Okmulgee
The most prevalent vehicle ownership categories in Okmulgee are males with 2 vehicles (690, accounting for 36.3%) and females with 2 vehicles (646, making up 32.8%).
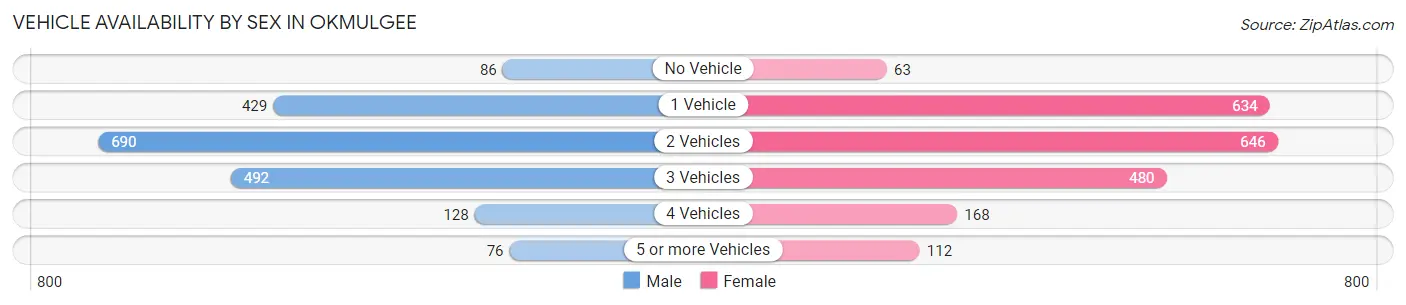
| Vehicles Available | Male | Female |
| No Vehicle | 86 (4.5%) | 63 (3.0%) |
| 1 Vehicle | 429 (22.6%) | 634 (30.1%) |
| 2 Vehicles | 690 (36.3%) | 646 (30.7%) |
| 3 Vehicles | 492 (25.9%) | 480 (22.8%) |
| 4 Vehicles | 128 (6.7%) | 168 (8.0%) |
| 5 or more Vehicles | 76 (4.0%) | 112 (5.3%) |
| Total | 1,901 (100.0%) | 2,103 (100.0%) |
Commute Time in Okmulgee
The most frequently occuring commute durations in Okmulgee are 5 to 9 minutes (1,241 commuters, 30.1%), 10 to 14 minutes (925 commuters, 22.5%), and 45 to 59 minutes (644 commuters, 15.7%).
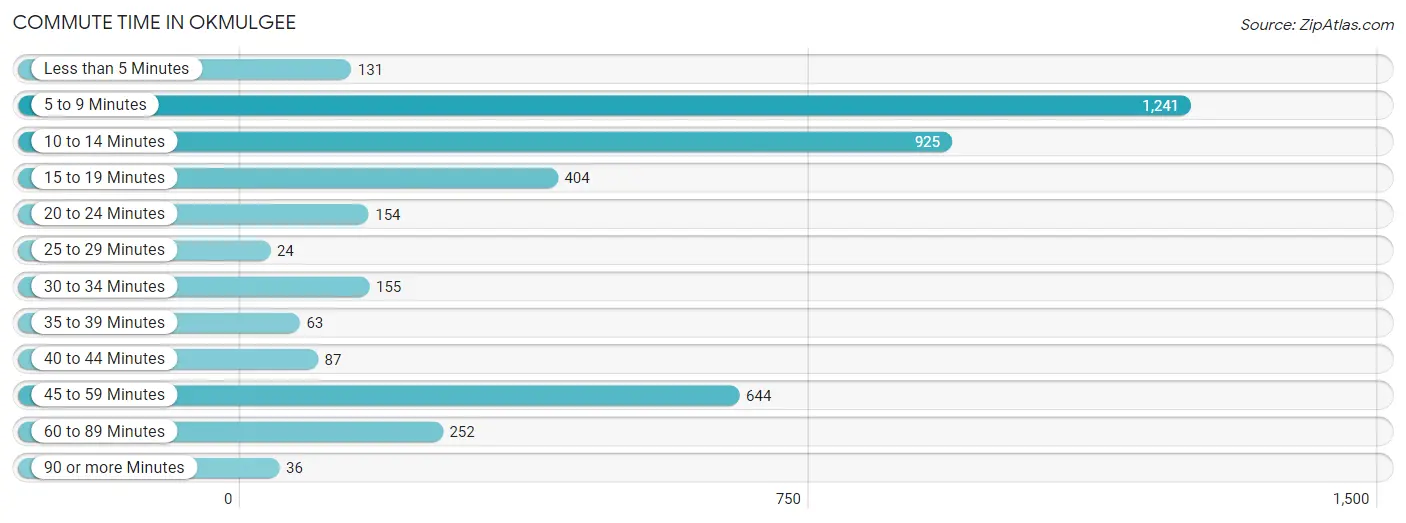
| Commute Time | # Commuters | % Commuters |
| Less than 5 Minutes | 131 | 3.2% |
| 5 to 9 Minutes | 1,241 | 30.1% |
| 10 to 14 Minutes | 925 | 22.5% |
| 15 to 19 Minutes | 404 | 9.8% |
| 20 to 24 Minutes | 154 | 3.7% |
| 25 to 29 Minutes | 24 | 0.6% |
| 30 to 34 Minutes | 155 | 3.8% |
| 35 to 39 Minutes | 63 | 1.5% |
| 40 to 44 Minutes | 87 | 2.1% |
| 45 to 59 Minutes | 644 | 15.7% |
| 60 to 89 Minutes | 252 | 6.1% |
| 90 or more Minutes | 36 | 0.9% |
Commute Time by Sex in Okmulgee
The most common commute times in Okmulgee are 5 to 9 minutes (542 commuters, 26.0%) for males and 5 to 9 minutes (699 commuters, 34.4%) for females.
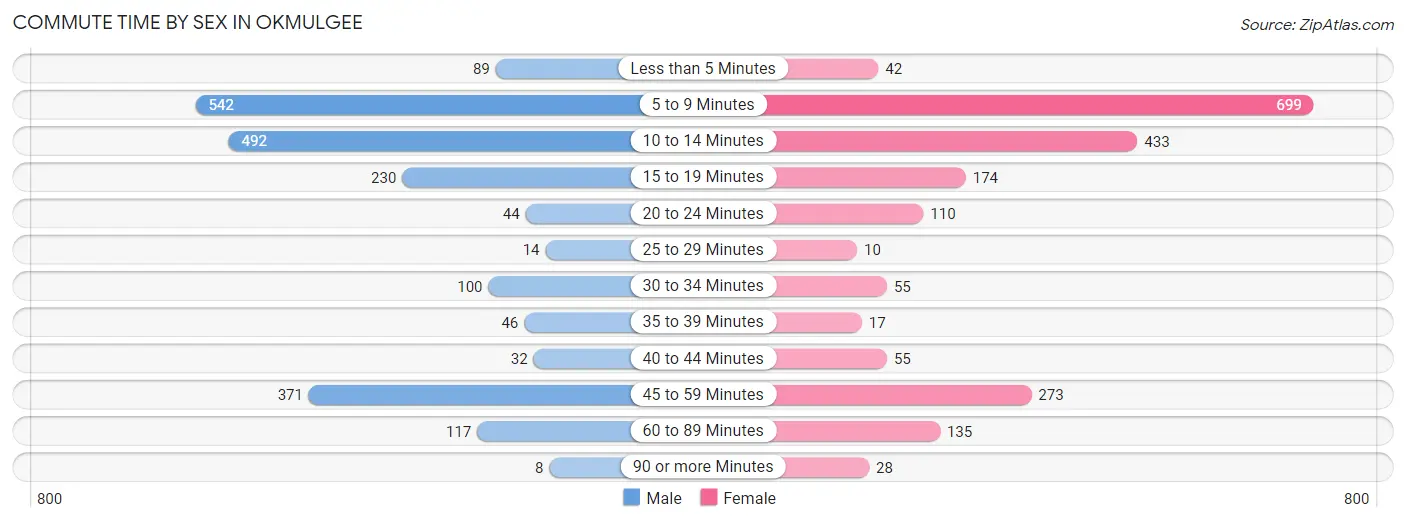
| Commute Time | Male | Female |
| Less than 5 Minutes | 89 (4.3%) | 42 (2.1%) |
| 5 to 9 Minutes | 542 (26.0%) | 699 (34.4%) |
| 10 to 14 Minutes | 492 (23.6%) | 433 (21.3%) |
| 15 to 19 Minutes | 230 (11.0%) | 174 (8.6%) |
| 20 to 24 Minutes | 44 (2.1%) | 110 (5.4%) |
| 25 to 29 Minutes | 14 (0.7%) | 10 (0.5%) |
| 30 to 34 Minutes | 100 (4.8%) | 55 (2.7%) |
| 35 to 39 Minutes | 46 (2.2%) | 17 (0.8%) |
| 40 to 44 Minutes | 32 (1.5%) | 55 (2.7%) |
| 45 to 59 Minutes | 371 (17.8%) | 273 (13.4%) |
| 60 to 89 Minutes | 117 (5.6%) | 135 (6.7%) |
| 90 or more Minutes | 8 (0.4%) | 28 (1.4%) |
Time of Departure to Work by Sex in Okmulgee
The most frequent times of departure to work in Okmulgee are 4:00 PM to 11:59 PM (253, 12.1%) for males and 7:30 AM to 7:59 AM (489, 24.1%) for females.
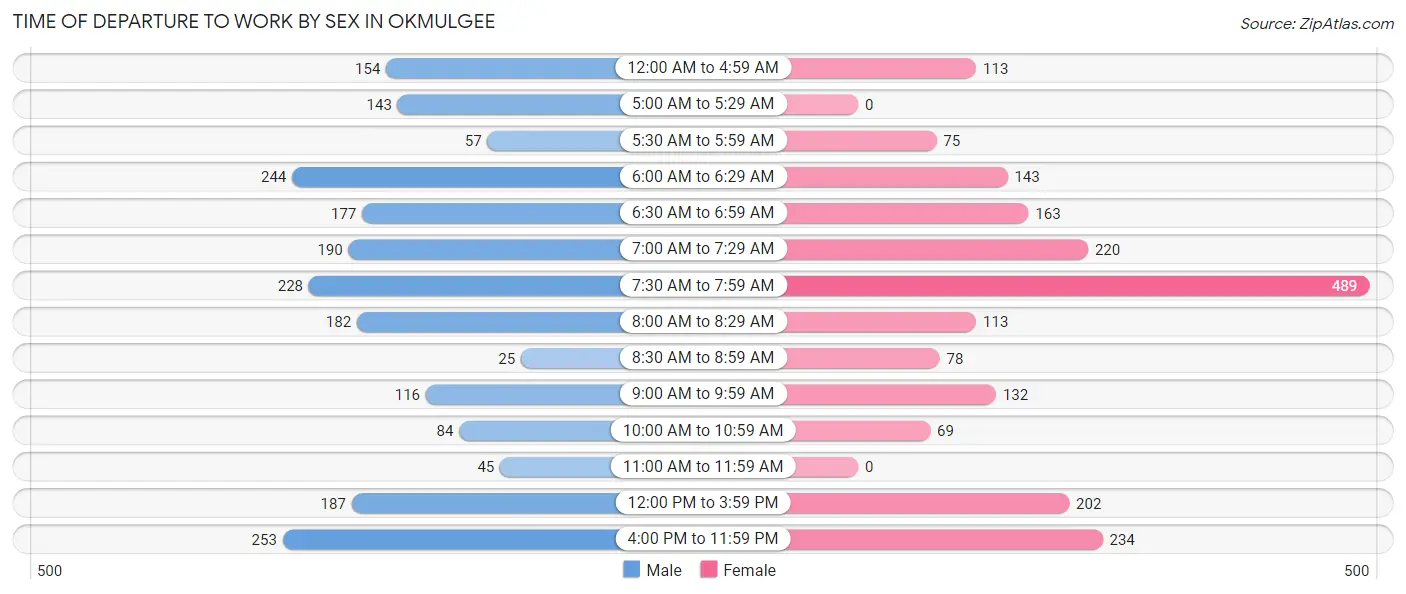
| Time of Departure | Male | Female |
| 12:00 AM to 4:59 AM | 154 (7.4%) | 113 (5.6%) |
| 5:00 AM to 5:29 AM | 143 (6.9%) | 0 (0.0%) |
| 5:30 AM to 5:59 AM | 57 (2.7%) | 75 (3.7%) |
| 6:00 AM to 6:29 AM | 244 (11.7%) | 143 (7.0%) |
| 6:30 AM to 6:59 AM | 177 (8.5%) | 163 (8.0%) |
| 7:00 AM to 7:29 AM | 190 (9.1%) | 220 (10.8%) |
| 7:30 AM to 7:59 AM | 228 (10.9%) | 489 (24.1%) |
| 8:00 AM to 8:29 AM | 182 (8.7%) | 113 (5.6%) |
| 8:30 AM to 8:59 AM | 25 (1.2%) | 78 (3.8%) |
| 9:00 AM to 9:59 AM | 116 (5.6%) | 132 (6.5%) |
| 10:00 AM to 10:59 AM | 84 (4.0%) | 69 (3.4%) |
| 11:00 AM to 11:59 AM | 45 (2.2%) | 0 (0.0%) |
| 12:00 PM to 3:59 PM | 187 (9.0%) | 202 (10.0%) |
| 4:00 PM to 11:59 PM | 253 (12.1%) | 234 (11.5%) |
| Total | 2,085 (100.0%) | 2,031 (100.0%) |
Housing Occupancy in Okmulgee
Occupancy by Ownership in Okmulgee
Of the total 4,267 dwellings in Okmulgee, owner-occupied units account for 2,191 (51.3%), while renter-occupied units make up 2,076 (48.6%).
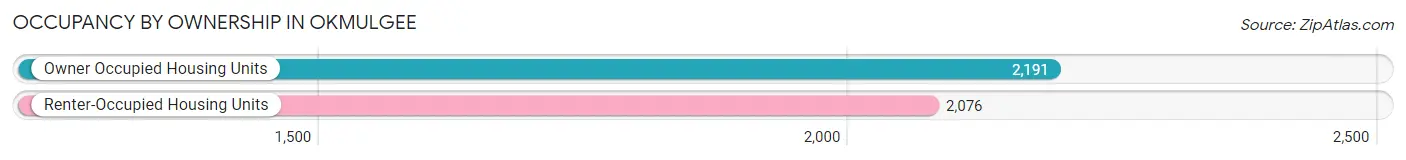
| Occupancy | # Housing Units | % Housing Units |
| Owner Occupied Housing Units | 2,191 | 51.3% |
| Renter-Occupied Housing Units | 2,076 | 48.6% |
| Total Occupied Housing Units | 4,267 | 100.0% |
Occupancy by Household Size in Okmulgee
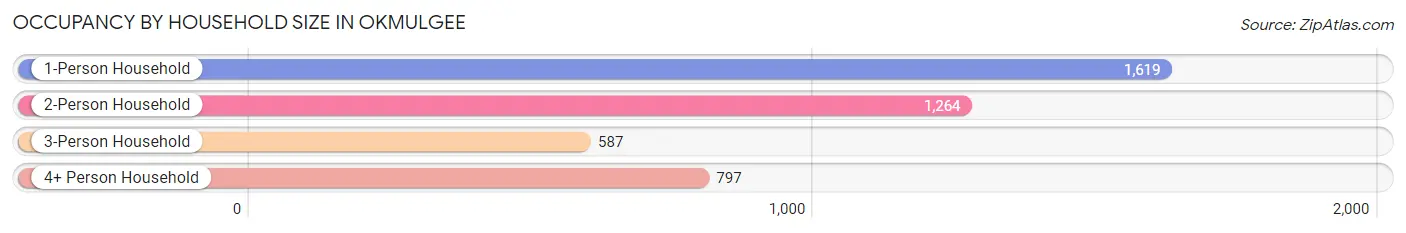
| Household Size | # Housing Units | % Housing Units |
| 1-Person Household | 1,619 | 37.9% |
| 2-Person Household | 1,264 | 29.6% |
| 3-Person Household | 587 | 13.8% |
| 4+ Person Household | 797 | 18.7% |
| Total Housing Units | 4,267 | 100.0% |
Occupancy by Ownership by Household Size in Okmulgee
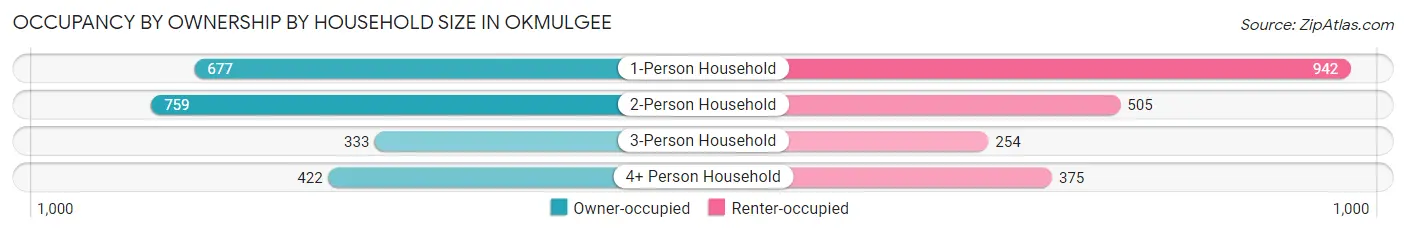
| Household Size | Owner-occupied | Renter-occupied |
| 1-Person Household | 677 (41.8%) | 942 (58.2%) |
| 2-Person Household | 759 (60.1%) | 505 (40.0%) |
| 3-Person Household | 333 (56.7%) | 254 (43.3%) |
| 4+ Person Household | 422 (52.9%) | 375 (47.0%) |
| Total Housing Units | 2,191 (51.3%) | 2,076 (48.6%) |
Occupancy by Educational Attainment in Okmulgee
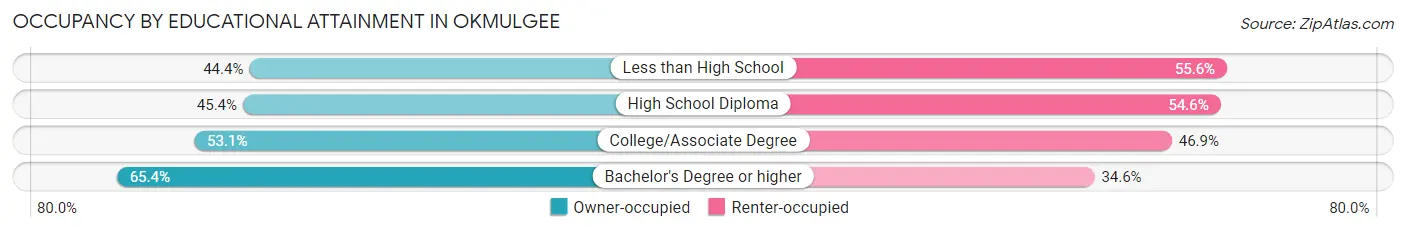
| Household Size | Owner-occupied | Renter-occupied |
| Less than High School | 252 (44.4%) | 316 (55.6%) |
| High School Diploma | 599 (45.4%) | 721 (54.6%) |
| College/Associate Degree | 932 (53.1%) | 823 (46.9%) |
| Bachelor's Degree or higher | 408 (65.4%) | 216 (34.6%) |
Occupancy by Age of Householder in Okmulgee
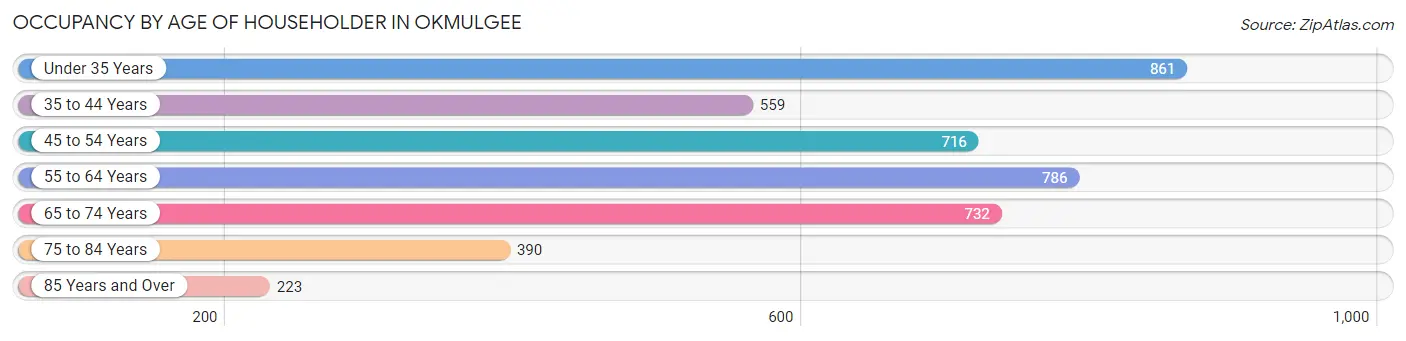
| Age Bracket | # Households | % Households |
| Under 35 Years | 861 | 20.2% |
| 35 to 44 Years | 559 | 13.1% |
| 45 to 54 Years | 716 | 16.8% |
| 55 to 64 Years | 786 | 18.4% |
| 65 to 74 Years | 732 | 17.2% |
| 75 to 84 Years | 390 | 9.1% |
| 85 Years and Over | 223 | 5.2% |
| Total | 4,267 | 100.0% |
Housing Finances in Okmulgee
Median Income by Occupancy in Okmulgee
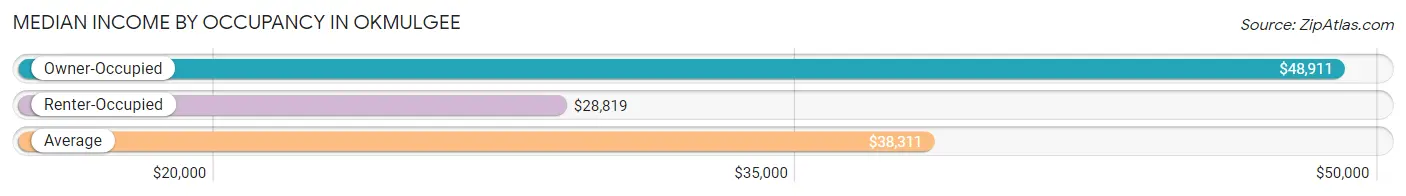
| Occupancy Type | # Households | Median Income |
| Owner-Occupied | 2,191 (51.3%) | $48,911 |
| Renter-Occupied | 2,076 (48.6%) | $28,819 |
| Average | 4,267 (100.0%) | $38,311 |
Occupancy by Householder Income Bracket in Okmulgee
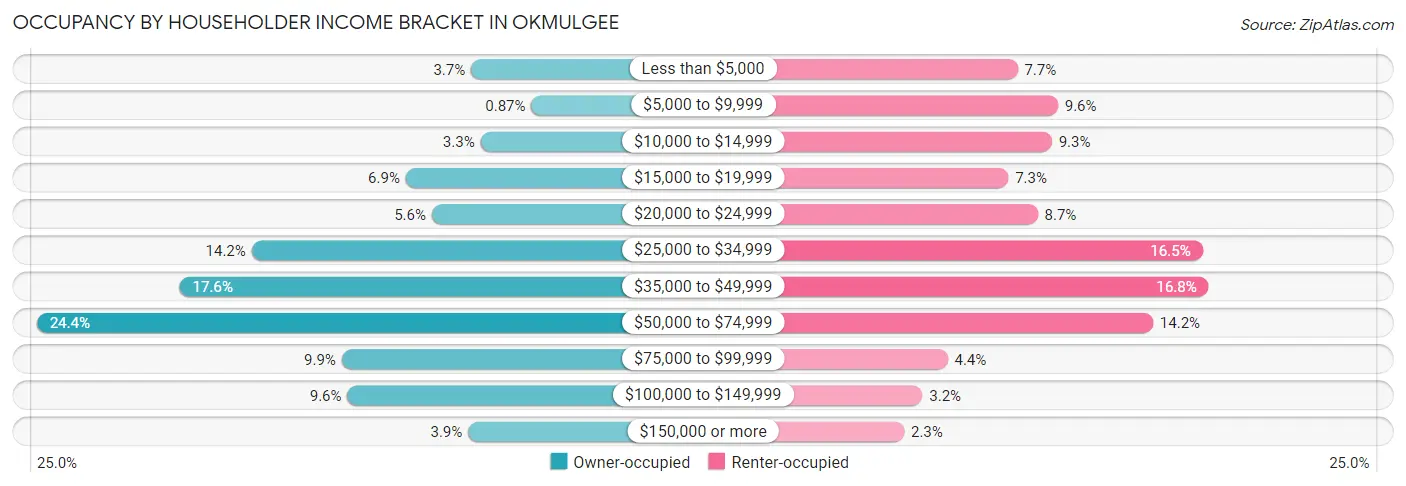
| Income Bracket | Owner-occupied | Renter-occupied |
| Less than $5,000 | 82 (3.7%) | 160 (7.7%) |
| $5,000 to $9,999 | 19 (0.9%) | 200 (9.6%) |
| $10,000 to $14,999 | 72 (3.3%) | 194 (9.3%) |
| $15,000 to $19,999 | 150 (6.9%) | 151 (7.3%) |
| $20,000 to $24,999 | 123 (5.6%) | 180 (8.7%) |
| $25,000 to $34,999 | 311 (14.2%) | 343 (16.5%) |
| $35,000 to $49,999 | 386 (17.6%) | 349 (16.8%) |
| $50,000 to $74,999 | 535 (24.4%) | 294 (14.2%) |
| $75,000 to $99,999 | 217 (9.9%) | 91 (4.4%) |
| $100,000 to $149,999 | 211 (9.6%) | 66 (3.2%) |
| $150,000 or more | 85 (3.9%) | 48 (2.3%) |
| Total | 2,191 (100.0%) | 2,076 (100.0%) |
Monthly Housing Cost Tiers in Okmulgee
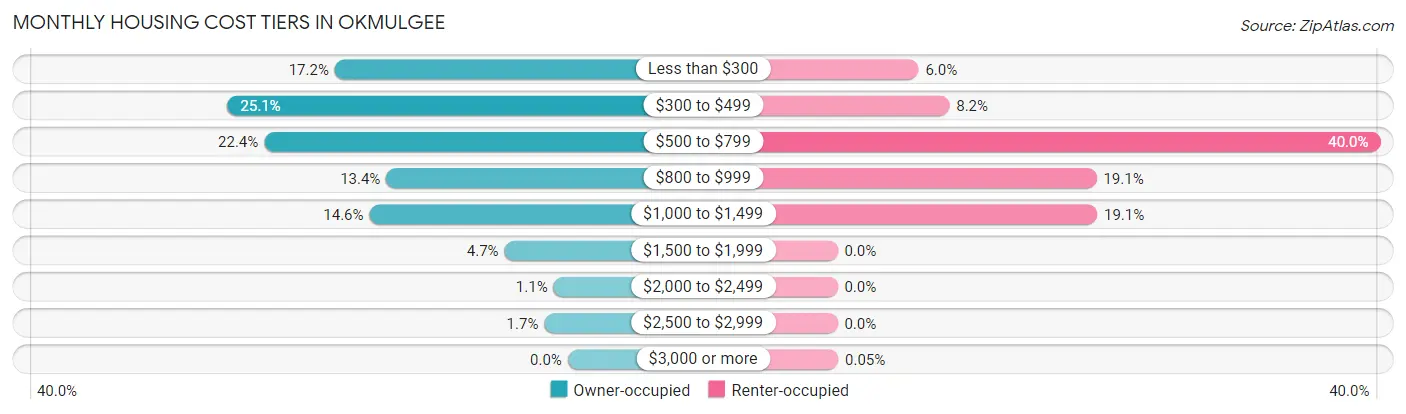
| Monthly Cost | Owner-occupied | Renter-occupied |
| Less than $300 | 376 (17.2%) | 124 (6.0%) |
| $300 to $499 | 549 (25.1%) | 171 (8.2%) |
| $500 to $799 | 490 (22.4%) | 830 (40.0%) |
| $800 to $999 | 293 (13.4%) | 396 (19.1%) |
| $1,000 to $1,499 | 320 (14.6%) | 397 (19.1%) |
| $1,500 to $1,999 | 102 (4.7%) | 0 (0.0%) |
| $2,000 to $2,499 | 23 (1.1%) | 0 (0.0%) |
| $2,500 to $2,999 | 38 (1.7%) | 0 (0.0%) |
| $3,000 or more | 0 (0.0%) | 1 (0.1%) |
| Total | 2,191 (100.0%) | 2,076 (100.0%) |
Physical Housing Characteristics in Okmulgee
Housing Structures in Okmulgee
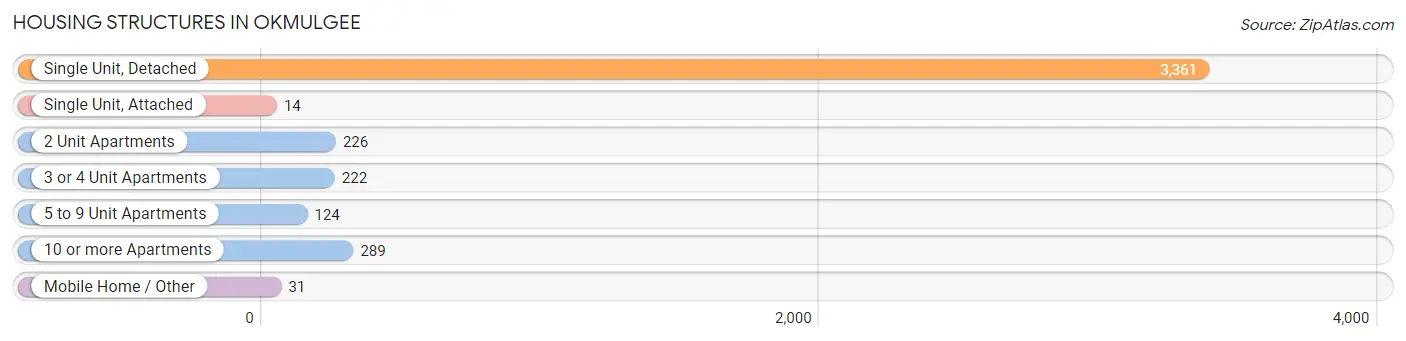
| Structure Type | # Housing Units | % Housing Units |
| Single Unit, Detached | 3,361 | 78.8% |
| Single Unit, Attached | 14 | 0.3% |
| 2 Unit Apartments | 226 | 5.3% |
| 3 or 4 Unit Apartments | 222 | 5.2% |
| 5 to 9 Unit Apartments | 124 | 2.9% |
| 10 or more Apartments | 289 | 6.8% |
| Mobile Home / Other | 31 | 0.7% |
| Total | 4,267 | 100.0% |
Housing Structures by Occupancy in Okmulgee
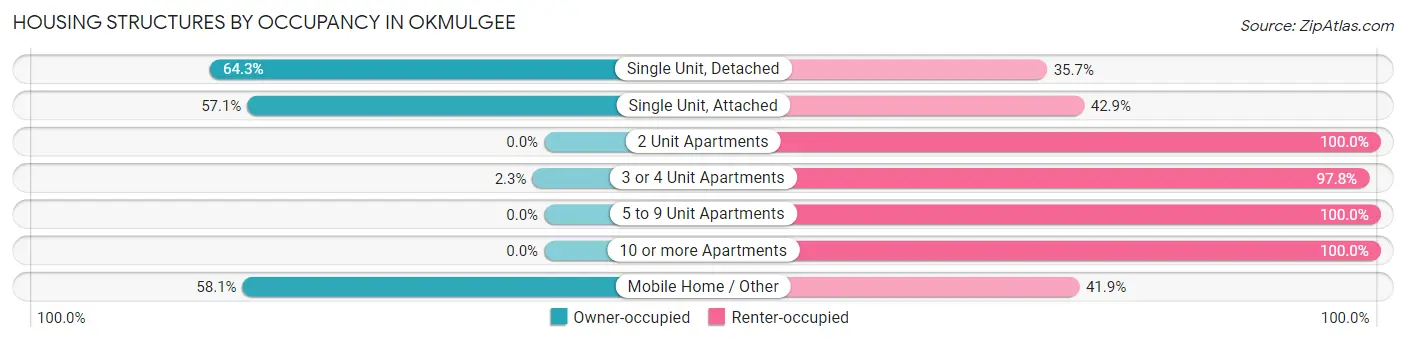
| Structure Type | Owner-occupied | Renter-occupied |
| Single Unit, Detached | 2,160 (64.3%) | 1,201 (35.7%) |
| Single Unit, Attached | 8 (57.1%) | 6 (42.9%) |
| 2 Unit Apartments | 0 (0.0%) | 226 (100.0%) |
| 3 or 4 Unit Apartments | 5 (2.2%) | 217 (97.8%) |
| 5 to 9 Unit Apartments | 0 (0.0%) | 124 (100.0%) |
| 10 or more Apartments | 0 (0.0%) | 289 (100.0%) |
| Mobile Home / Other | 18 (58.1%) | 13 (41.9%) |
| Total | 2,191 (51.3%) | 2,076 (48.6%) |
Housing Structures by Number of Rooms in Okmulgee
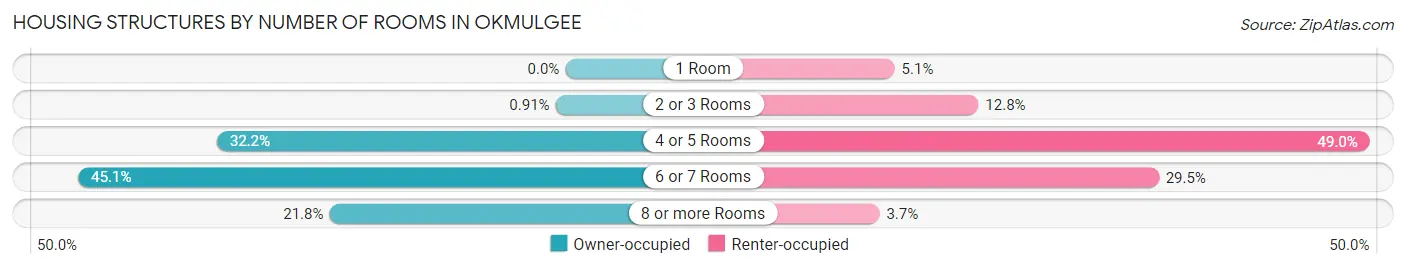
| Number of Rooms | Owner-occupied | Renter-occupied |
| 1 Room | 0 (0.0%) | 105 (5.1%) |
| 2 or 3 Rooms | 20 (0.9%) | 266 (12.8%) |
| 4 or 5 Rooms | 706 (32.2%) | 1,017 (49.0%) |
| 6 or 7 Rooms | 987 (45.1%) | 612 (29.5%) |
| 8 or more Rooms | 478 (21.8%) | 76 (3.7%) |
| Total | 2,191 (100.0%) | 2,076 (100.0%) |
Housing Structure by Heating Type in Okmulgee
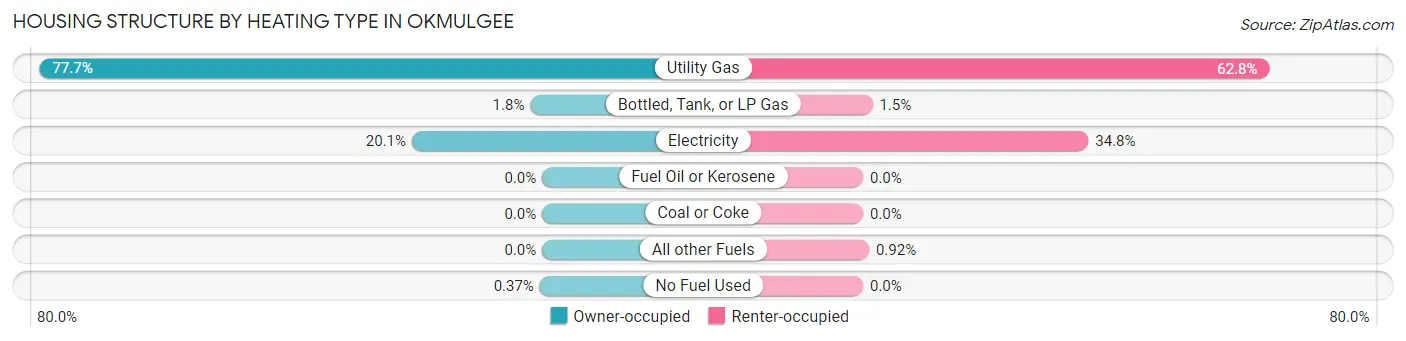
| Heating Type | Owner-occupied | Renter-occupied |
| Utility Gas | 1,702 (77.7%) | 1,304 (62.8%) |
| Bottled, Tank, or LP Gas | 40 (1.8%) | 30 (1.5%) |
| Electricity | 441 (20.1%) | 723 (34.8%) |
| Fuel Oil or Kerosene | 0 (0.0%) | 0 (0.0%) |
| Coal or Coke | 0 (0.0%) | 0 (0.0%) |
| All other Fuels | 0 (0.0%) | 19 (0.9%) |
| No Fuel Used | 8 (0.4%) | 0 (0.0%) |
| Total | 2,191 (100.0%) | 2,076 (100.0%) |
Household Vehicle Usage in Okmulgee
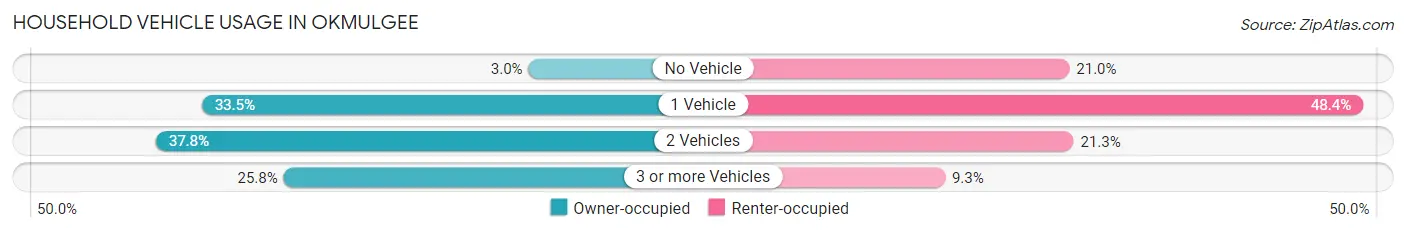
| Vehicles per Household | Owner-occupied | Renter-occupied |
| No Vehicle | 65 (3.0%) | 435 (20.9%) |
| 1 Vehicle | 733 (33.5%) | 1,004 (48.4%) |
| 2 Vehicles | 827 (37.8%) | 443 (21.3%) |
| 3 or more Vehicles | 566 (25.8%) | 194 (9.3%) |
| Total | 2,191 (100.0%) | 2,076 (100.0%) |
Real Estate & Mortgages in Okmulgee
Real Estate and Mortgage Overview in Okmulgee
| Characteristic | Without Mortgage | With Mortgage |
| Housing Units | 1,110 | 1,081 |
| Median Property Value | $78,400 | $99,400 |
| Median Household Income | $42,589 | $30 |
| Monthly Housing Costs | $358 | $0 |
| Real Estate Taxes | $471 | $109 |
Property Value by Mortgage Status in Okmulgee

| Property Value | Without Mortgage | With Mortgage |
| Less than $50,000 | 334 (30.1%) | 139 (12.9%) |
| $50,000 to $99,999 | 425 (38.3%) | 407 (37.7%) |
| $100,000 to $299,999 | 301 (27.1%) | 523 (48.4%) |
| $300,000 to $499,999 | 28 (2.5%) | 12 (1.1%) |
| $500,000 to $749,999 | 22 (2.0%) | 0 (0.0%) |
| $750,000 to $999,999 | 0 (0.0%) | 0 (0.0%) |
| $1,000,000 or more | 0 (0.0%) | 0 (0.0%) |
| Total | 1,110 (100.0%) | 1,081 (100.0%) |
Household Income by Mortgage Status in Okmulgee
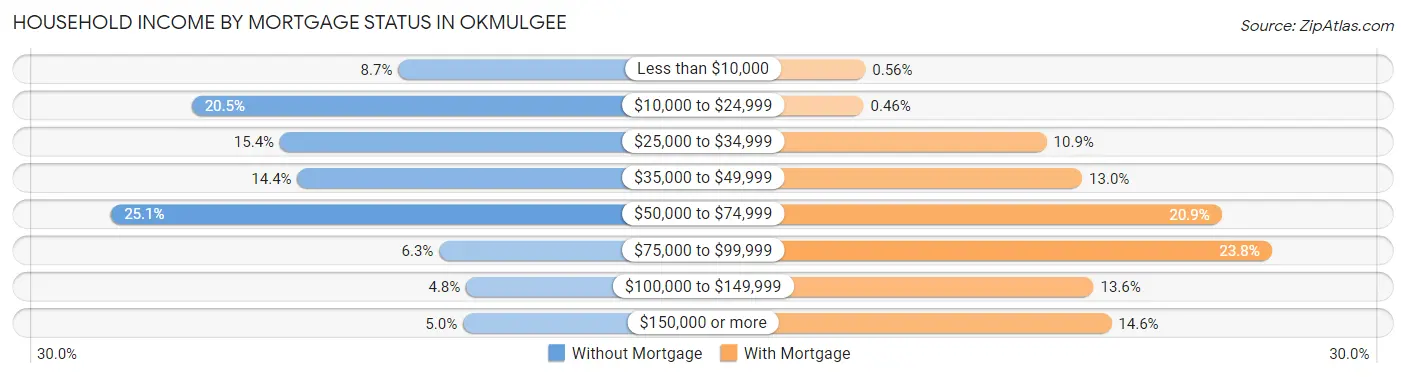
| Household Income | Without Mortgage | With Mortgage |
| Less than $10,000 | 96 (8.6%) | 6 (0.6%) |
| $10,000 to $24,999 | 227 (20.4%) | 5 (0.5%) |
| $25,000 to $34,999 | 171 (15.4%) | 118 (10.9%) |
| $35,000 to $49,999 | 160 (14.4%) | 140 (13.0%) |
| $50,000 to $74,999 | 278 (25.1%) | 226 (20.9%) |
| $75,000 to $99,999 | 70 (6.3%) | 257 (23.8%) |
| $100,000 to $149,999 | 53 (4.8%) | 147 (13.6%) |
| $150,000 or more | 55 (5.0%) | 158 (14.6%) |
| Total | 1,110 (100.0%) | 1,081 (100.0%) |
Property Value to Household Income Ratio in Okmulgee
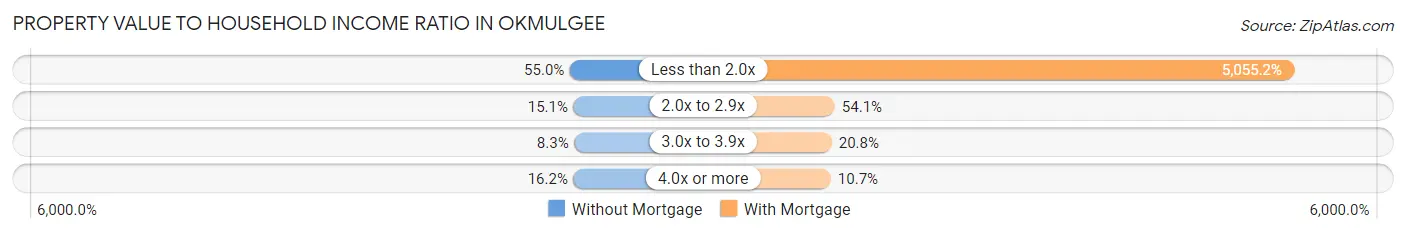
| Value-to-Income Ratio | Without Mortgage | With Mortgage |
| Less than 2.0x | 610 (54.9%) | 54,647 (5,055.2%) |
| 2.0x to 2.9x | 168 (15.1%) | 585 (54.1%) |
| 3.0x to 3.9x | 92 (8.3%) | 225 (20.8%) |
| 4.0x or more | 180 (16.2%) | 116 (10.7%) |
| Total | 1,110 (100.0%) | 1,081 (100.0%) |
Real Estate Taxes by Mortgage Status in Okmulgee
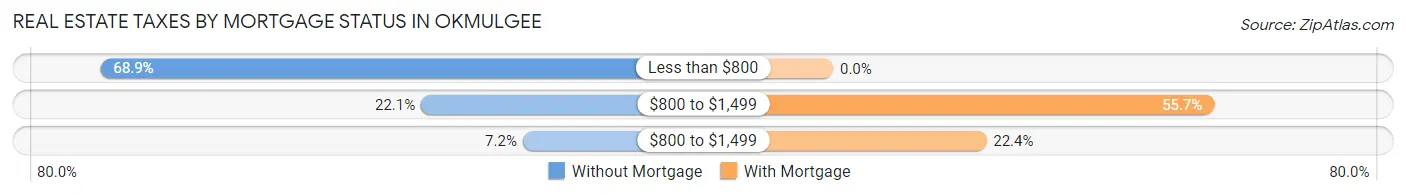
| Property Taxes | Without Mortgage | With Mortgage |
| Less than $800 | 765 (68.9%) | 0 (0.0%) |
| $800 to $1,499 | 245 (22.1%) | 602 (55.7%) |
| $800 to $1,499 | 80 (7.2%) | 242 (22.4%) |
| Total | 1,110 (100.0%) | 1,081 (100.0%) |
Health & Disability in Okmulgee
Health Insurance Coverage by Age in Okmulgee
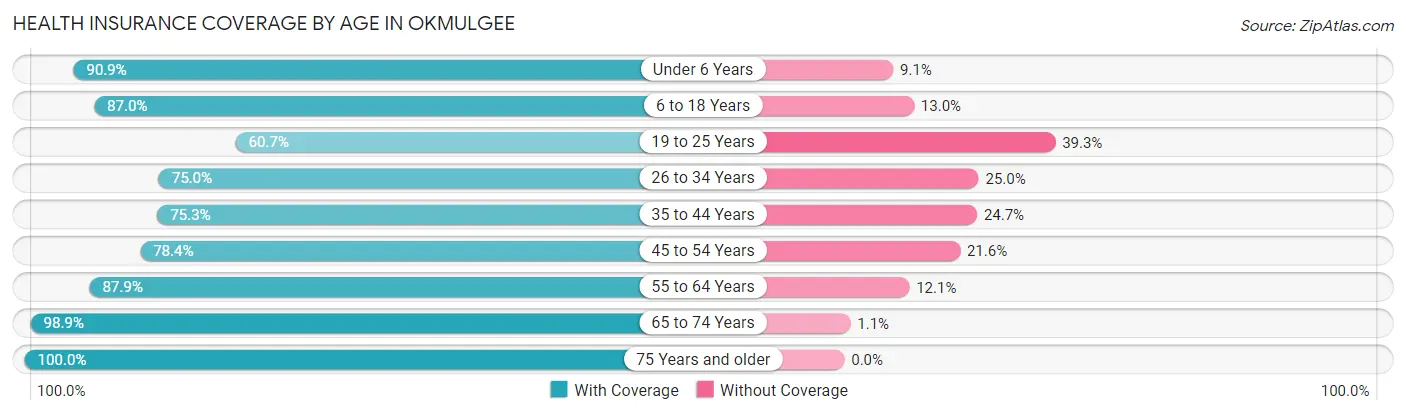
| Age Bracket | With Coverage | Without Coverage |
| Under 6 Years | 689 (90.9%) | 69 (9.1%) |
| 6 to 18 Years | 1,636 (87.0%) | 244 (13.0%) |
| 19 to 25 Years | 870 (60.7%) | 564 (39.3%) |
| 26 to 34 Years | 1,030 (75.0%) | 344 (25.0%) |
| 35 to 44 Years | 873 (75.3%) | 287 (24.7%) |
| 45 to 54 Years | 971 (78.4%) | 267 (21.6%) |
| 55 to 64 Years | 1,118 (87.9%) | 154 (12.1%) |
| 65 to 74 Years | 1,054 (98.9%) | 12 (1.1%) |
| 75 Years and older | 727 (100.0%) | 0 (0.0%) |
| Total | 8,968 (82.2%) | 1,941 (17.8%) |
Health Insurance Coverage by Citizenship Status in Okmulgee
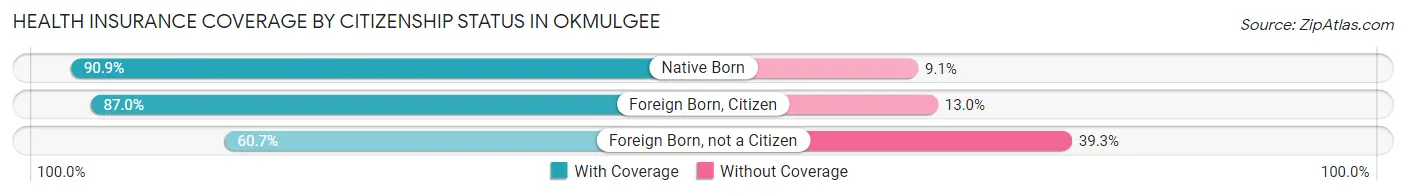
| Citizenship Status | With Coverage | Without Coverage |
| Native Born | 689 (90.9%) | 69 (9.1%) |
| Foreign Born, Citizen | 1,636 (87.0%) | 244 (13.0%) |
| Foreign Born, not a Citizen | 870 (60.7%) | 564 (39.3%) |
Health Insurance Coverage by Household Income in Okmulgee
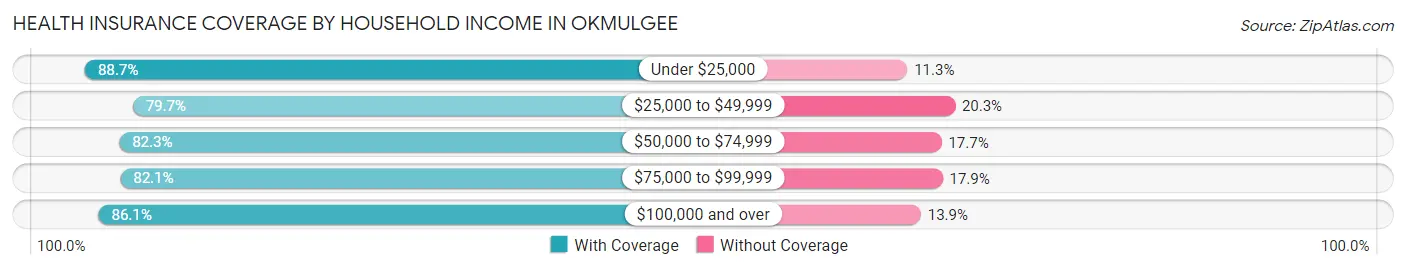
| Household Income | With Coverage | Without Coverage |
| Under $25,000 | 1,865 (88.7%) | 238 (11.3%) |
| $25,000 to $49,999 | 2,770 (79.7%) | 704 (20.3%) |
| $50,000 to $74,999 | 1,883 (82.3%) | 406 (17.7%) |
| $75,000 to $99,999 | 773 (82.1%) | 169 (17.9%) |
| $100,000 and over | 1,156 (86.1%) | 186 (13.9%) |
Public vs Private Health Insurance Coverage by Age in Okmulgee
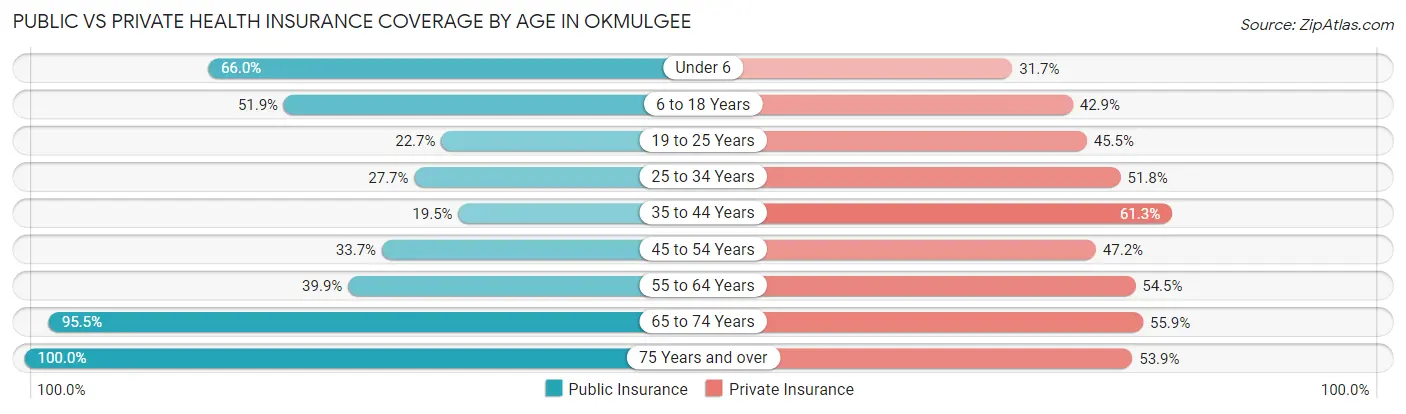
| Age Bracket | Public Insurance | Private Insurance |
| Under 6 | 500 (66.0%) | 240 (31.7%) |
| 6 to 18 Years | 975 (51.9%) | 806 (42.9%) |
| 19 to 25 Years | 325 (22.7%) | 652 (45.5%) |
| 25 to 34 Years | 380 (27.7%) | 711 (51.7%) |
| 35 to 44 Years | 226 (19.5%) | 711 (61.3%) |
| 45 to 54 Years | 417 (33.7%) | 584 (47.2%) |
| 55 to 64 Years | 508 (39.9%) | 693 (54.5%) |
| 65 to 74 Years | 1,018 (95.5%) | 596 (55.9%) |
| 75 Years and over | 727 (100.0%) | 392 (53.9%) |
| Total | 5,076 (46.5%) | 5,385 (49.4%) |
Disability Status by Sex by Age in Okmulgee
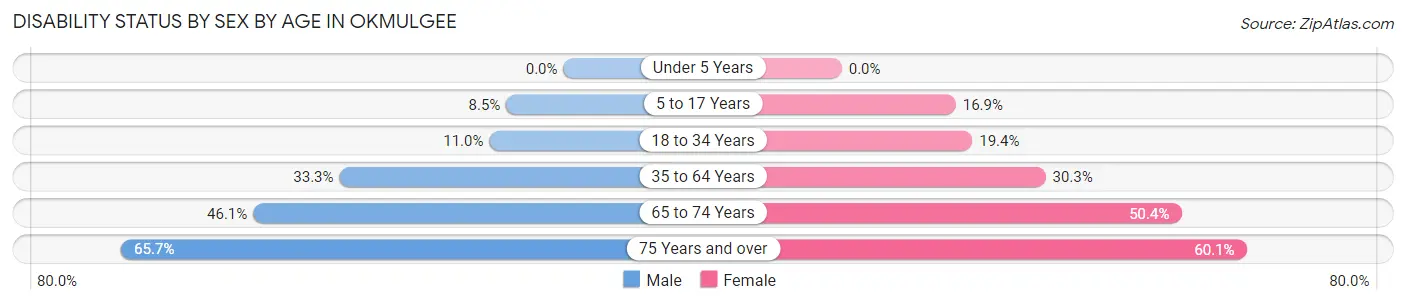
| Age Bracket | Male | Female |
| Under 5 Years | 0 (0.0%) | 0 (0.0%) |
| 5 to 17 Years | 77 (8.5%) | 148 (16.9%) |
| 18 to 34 Years | 181 (11.0%) | 268 (19.4%) |
| 35 to 64 Years | 574 (33.3%) | 588 (30.2%) |
| 65 to 74 Years | 205 (46.1%) | 313 (50.4%) |
| 75 Years and over | 132 (65.7%) | 316 (60.1%) |
Disability Class by Sex by Age in Okmulgee
Disability Class: Hearing Difficulty
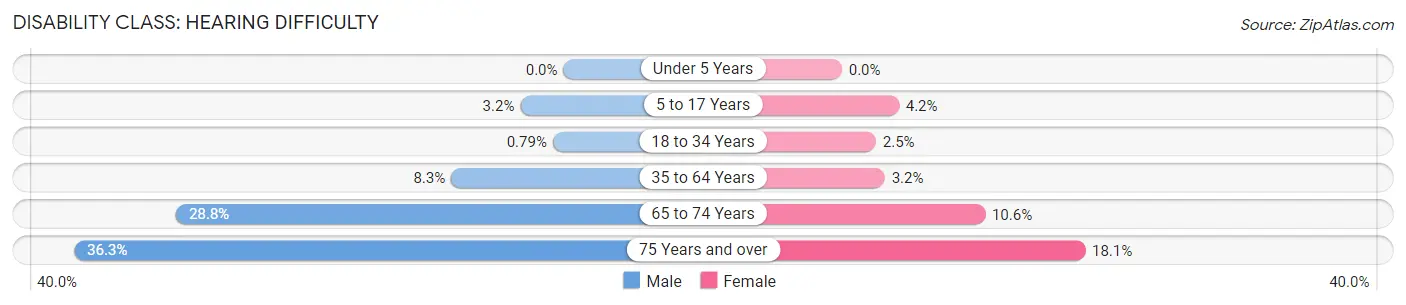
| Age Bracket | Male | Female |
| Under 5 Years | 0 (0.0%) | 0 (0.0%) |
| 5 to 17 Years | 29 (3.2%) | 37 (4.2%) |
| 18 to 34 Years | 13 (0.8%) | 35 (2.5%) |
| 35 to 64 Years | 144 (8.3%) | 62 (3.2%) |
| 65 to 74 Years | 128 (28.8%) | 66 (10.6%) |
| 75 Years and over | 73 (36.3%) | 95 (18.1%) |
Disability Class: Vision Difficulty
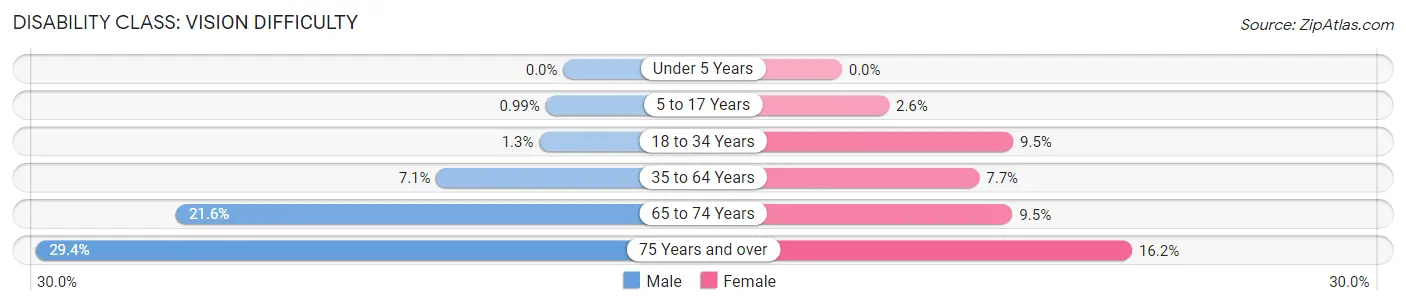
| Age Bracket | Male | Female |
| Under 5 Years | 0 (0.0%) | 0 (0.0%) |
| 5 to 17 Years | 9 (1.0%) | 23 (2.6%) |
| 18 to 34 Years | 22 (1.3%) | 132 (9.5%) |
| 35 to 64 Years | 122 (7.1%) | 149 (7.7%) |
| 65 to 74 Years | 96 (21.6%) | 59 (9.5%) |
| 75 Years and over | 59 (29.3%) | 85 (16.2%) |
Disability Class: Cognitive Difficulty
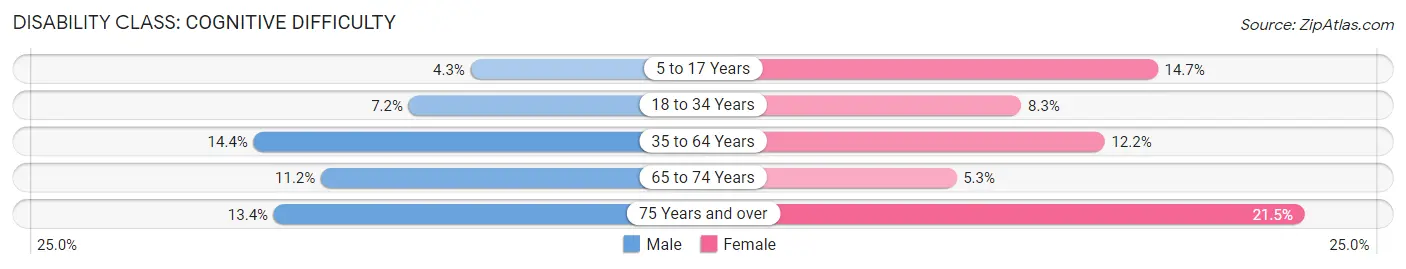
| Age Bracket | Male | Female |
| 5 to 17 Years | 39 (4.3%) | 128 (14.6%) |
| 18 to 34 Years | 118 (7.2%) | 115 (8.3%) |
| 35 to 64 Years | 248 (14.4%) | 237 (12.2%) |
| 65 to 74 Years | 50 (11.2%) | 33 (5.3%) |
| 75 Years and over | 27 (13.4%) | 113 (21.5%) |
Disability Class: Ambulatory Difficulty
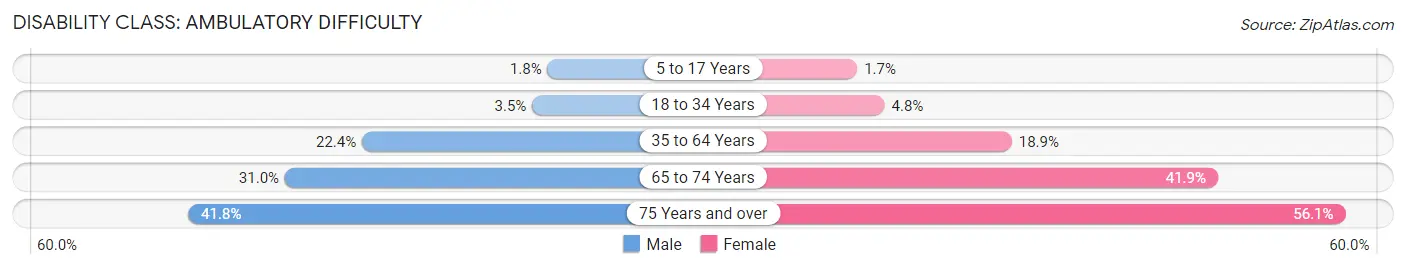
| Age Bracket | Male | Female |
| 5 to 17 Years | 16 (1.8%) | 15 (1.7%) |
| 18 to 34 Years | 57 (3.5%) | 66 (4.8%) |
| 35 to 64 Years | 387 (22.4%) | 368 (18.9%) |
| 65 to 74 Years | 138 (31.0%) | 260 (41.9%) |
| 75 Years and over | 84 (41.8%) | 295 (56.1%) |
Disability Class: Self-Care Difficulty
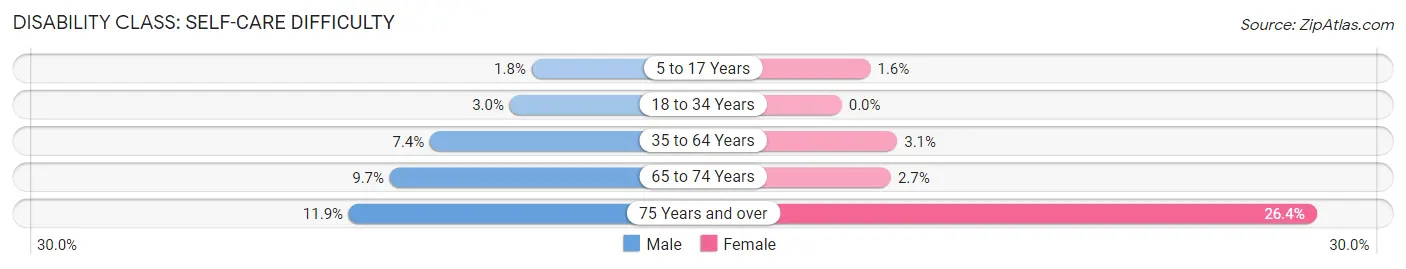
| Age Bracket | Male | Female |
| 5 to 17 Years | 16 (1.8%) | 14 (1.6%) |
| 18 to 34 Years | 49 (3.0%) | 0 (0.0%) |
| 35 to 64 Years | 128 (7.4%) | 60 (3.1%) |
| 65 to 74 Years | 43 (9.7%) | 17 (2.7%) |
| 75 Years and over | 24 (11.9%) | 139 (26.4%) |
Technology Access in Okmulgee
Computing Device Access in Okmulgee
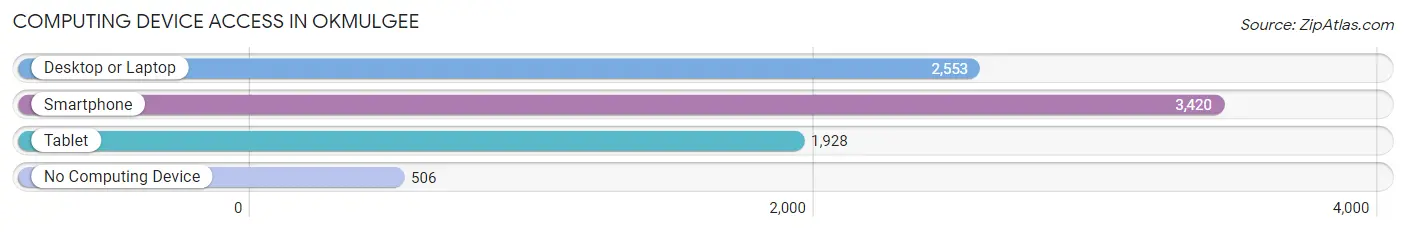
| Device Type | # Households | % Households |
| Desktop or Laptop | 2,553 | 59.8% |
| Smartphone | 3,420 | 80.1% |
| Tablet | 1,928 | 45.2% |
| No Computing Device | 506 | 11.9% |
| Total | 4,267 | 100.0% |
Internet Access in Okmulgee
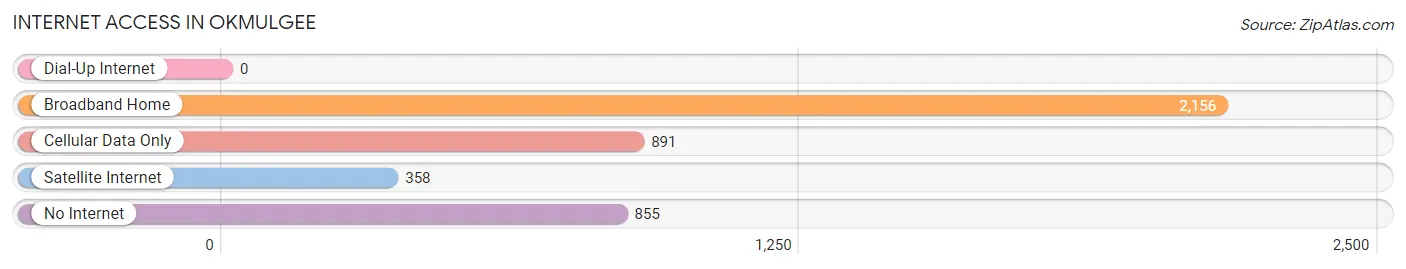
| Internet Type | # Households | % Households |
| Dial-Up Internet | 0 | 0.0% |
| Broadband Home | 2,156 | 50.5% |
| Cellular Data Only | 891 | 20.9% |
| Satellite Internet | 358 | 8.4% |
| No Internet | 855 | 20.0% |
| Total | 4,267 | 100.0% |
Okmulgee Summary
Okmulgee is a city located in Okmulgee County, Oklahoma, United States. It is the county seat of Okmulgee County and the principal city of the Okmulgee Micropolitan Statistical Area. As of the 2010 census, the city had a population of 12,321, making it the eleventh-largest city in the state.
History
The area around Okmulgee was inhabited by the Creek Indians for centuries before the arrival of European settlers. The Creek name for the area was Honka Hadjo, which translates to "boiling waters". The area was part of the Creek Nation until the Indian Removal Act of 1830, which forced the Creek to relocate to Indian Territory (present-day Oklahoma).
The first European settlers arrived in the area in the 1830s, and the town of Okmulgee was established in 1868. The town was named after the Creek word for "boiling waters". The town was incorporated in 1898 and was designated as the county seat of Okmulgee County in 1907.
Geography
Okmulgee is located in eastern Oklahoma, approximately 40 miles south of Tulsa. It is situated in the rolling hills of the Ozark Plateau, at an elevation of 745 feet. The city is located at the confluence of the Okmulgee and Deep Fork rivers.
The city has a total area of 11.3 square miles, of which 11.2 square miles is land and 0.1 square miles is water.
Economy
Okmulgee's economy is largely based on agriculture and manufacturing. The city is home to several large manufacturing plants, including a Tyson Foods poultry processing plant, a ConAgra Foods plant, and a Georgia-Pacific paper mill.
The city is also home to several large agricultural operations, including a large hog farm and a large dairy farm. The city is also home to several large retail stores, including Walmart, Lowe's, and Home Depot.
Demographics
As of the 2010 census, there were 12,321 people, 4,845 households, and 3,092 families residing in the city. The population density was 1,097.2 people per square mile. There were 5,541 housing units at an average density of 492.3 per square mile.
The racial makeup of the city was 68.2% White, 15.2% African American, 8.3% Native American, 0.7% Asian, 0.1% Pacific Islander, 2.2% from other races, and 5.3% from two or more races. Hispanic or Latino of any race were 5.3% of the population.
The median income for a household in the city was $30,945, and the median income for a family was $37,917. Males had a median income of $30,945 versus $22,917 for females. The per capita income for the city was $16,845. About 16.2% of families and 19.7% of the population were below the poverty line, including 28.2% of those under age 18 and 11.2% of those age 65 or over.
Common Questions
What is Per Capita Income in Okmulgee?
Per Capita income in Okmulgee is $23,834.
What is the Median Family Income in Okmulgee?
Median Family Income in Okmulgee is $46,054.
What is the Median Household income in Okmulgee?
Median Household Income in Okmulgee is $38,311.
What is Income or Wage Gap in Okmulgee?
Income or Wage Gap in Okmulgee is 13.1%.
Women in Okmulgee earn 86.9 cents for every dollar earned by a man.
What is Family Income Deficit in Okmulgee?
Family Income Deficit in Okmulgee is $7,980.
Families that are below poverty line in Okmulgee earn $7,980 less on average than the poverty threshold level.
What is Inequality or Gini Index in Okmulgee?
Inequality or Gini Index in Okmulgee is 0.53.
What is the Total Population of Okmulgee?
Total Population of Okmulgee is 11,366.
What is the Total Male Population of Okmulgee?
Total Male Population of Okmulgee is 5,525.
What is the Total Female Population of Okmulgee?
Total Female Population of Okmulgee is 5,841.
What is the Ratio of Males per 100 Females in Okmulgee?
There are 94.59 Males per 100 Females in Okmulgee.
What is the Ratio of Females per 100 Males in Okmulgee?
There are 105.72 Females per 100 Males in Okmulgee.
What is the Median Population Age in Okmulgee?
Median Population Age in Okmulgee is 35.5 Years.
What is the Average Family Size in Okmulgee
Average Family Size in Okmulgee is 3.1 People.
What is the Average Household Size in Okmulgee
Average Household Size in Okmulgee is 2.4 People.
How Large is the Labor Force in Okmulgee?
There are 4,758 People in the Labor Forcein in Okmulgee.
What is the Percentage of People in the Labor Force in Okmulgee?
51.3% of People are in the Labor Force in Okmulgee.
What is the Unemployment Rate in Okmulgee?
Unemployment Rate in Okmulgee is 9.2%.