Summit, OK Map & Demographics
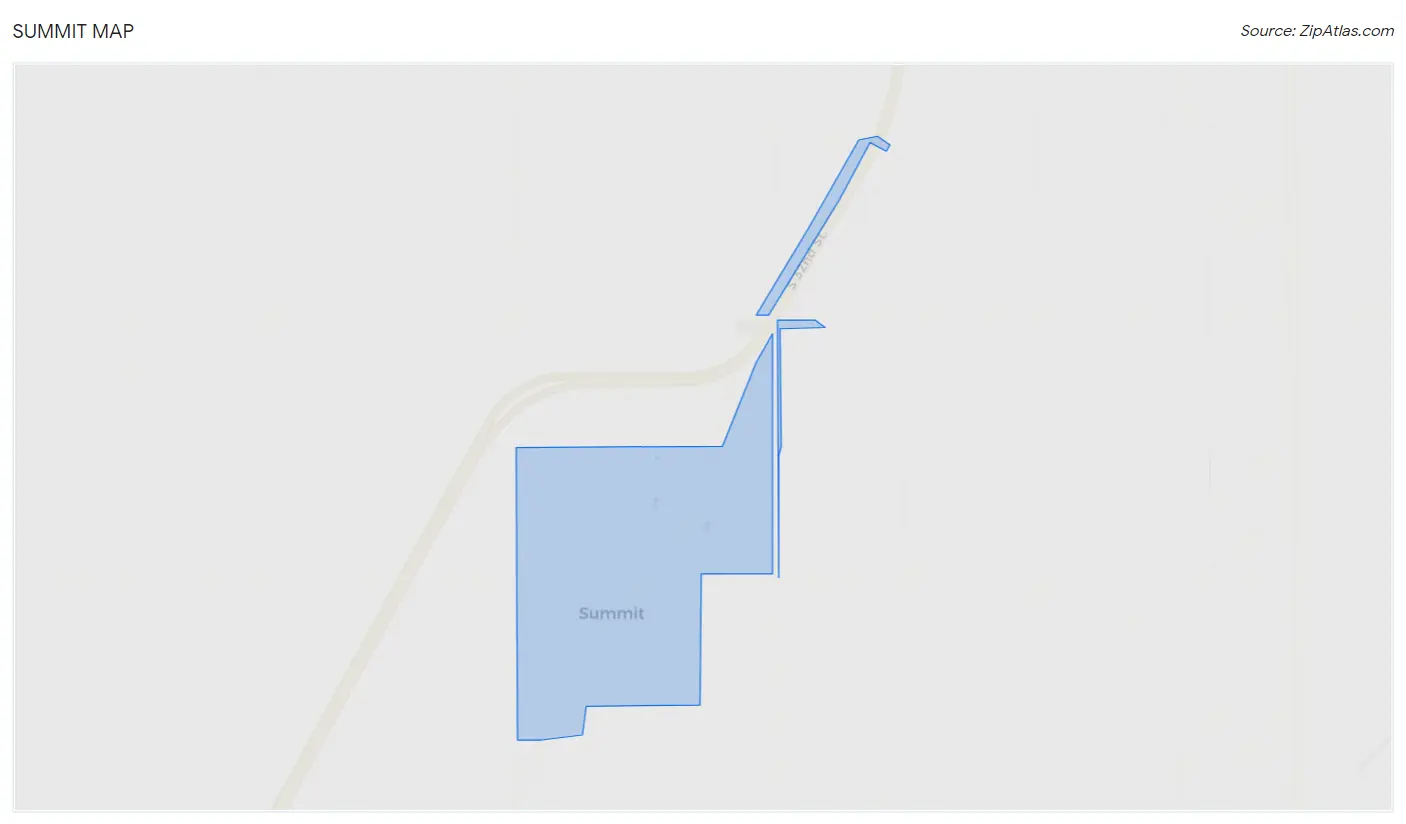
Summit Map
Summit Overview
$15,105
PER CAPITA INCOME
$38,750
AVG FAMILY INCOME
26.0%
WAGE / INCOME GAP [ % ]
74.0¢/ $1
WAGE / INCOME GAP [ $ ]
0.47
INEQUALITY / GINI INDEX
83
TOTAL POPULATION
32
MALE POPULATION
51
FEMALE POPULATION
62.75
MALES / 100 FEMALES
159.38
FEMALES / 100 MALES
60.8
MEDIAN AGE
3.2
AVG FAMILY SIZE
2.2
AVG HOUSEHOLD SIZE
16
LABOR FORCE [ PEOPLE ]
26.7%
PERCENT IN LABOR FORCE
6.3%
UNEMPLOYMENT RATE
Summit Area Codes
Income in Summit
Income Overview in Summit
| Characteristic | Number | Measure |
| Per Capita Income | 83 | $15,105 |
| Median Family Income | 20 | $38,750 |
| Mean Family Income | 20 | $48,060 |
| Median Household Income | 37 | $0 |
| Mean Household Income | 37 | $31,732 |
| Income Deficit | 20 | $0 |
| Wage / Income Gap (%) | 83 | 26.04% |
| Wage / Income Gap ($) | 83 | 73.96¢ per $1 |
| Gini / Inequality Index | 83 | 0.47 |
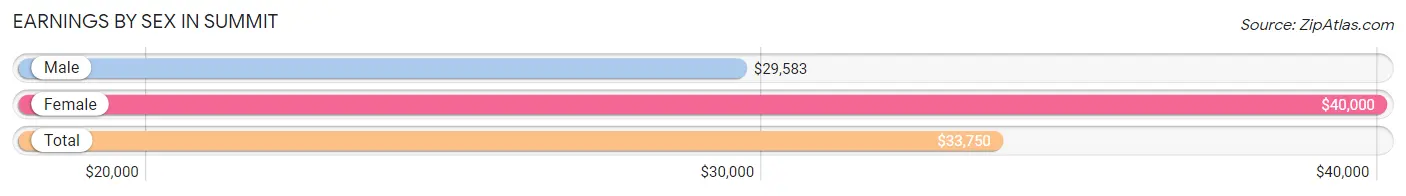
Earnings by Sex in Summit
Average Earnings in Summit are $33,750, $29,583 for men and $40,000 for women, a difference of 26.0%.
| Sex | Number | Average Earnings |
| Male | 9 (52.9%) | $29,583 |
| Female | 8 (47.1%) | $40,000 |
| Total | 17 (100.0%) | $33,750 |
Earnings by Sex by Income Bracket in Summit
The most common earnings brackets in Summit are $45,000 to $49,999 for men (4 | 44.4%) and $45,000 to $49,999 for women (3 | 37.5%).
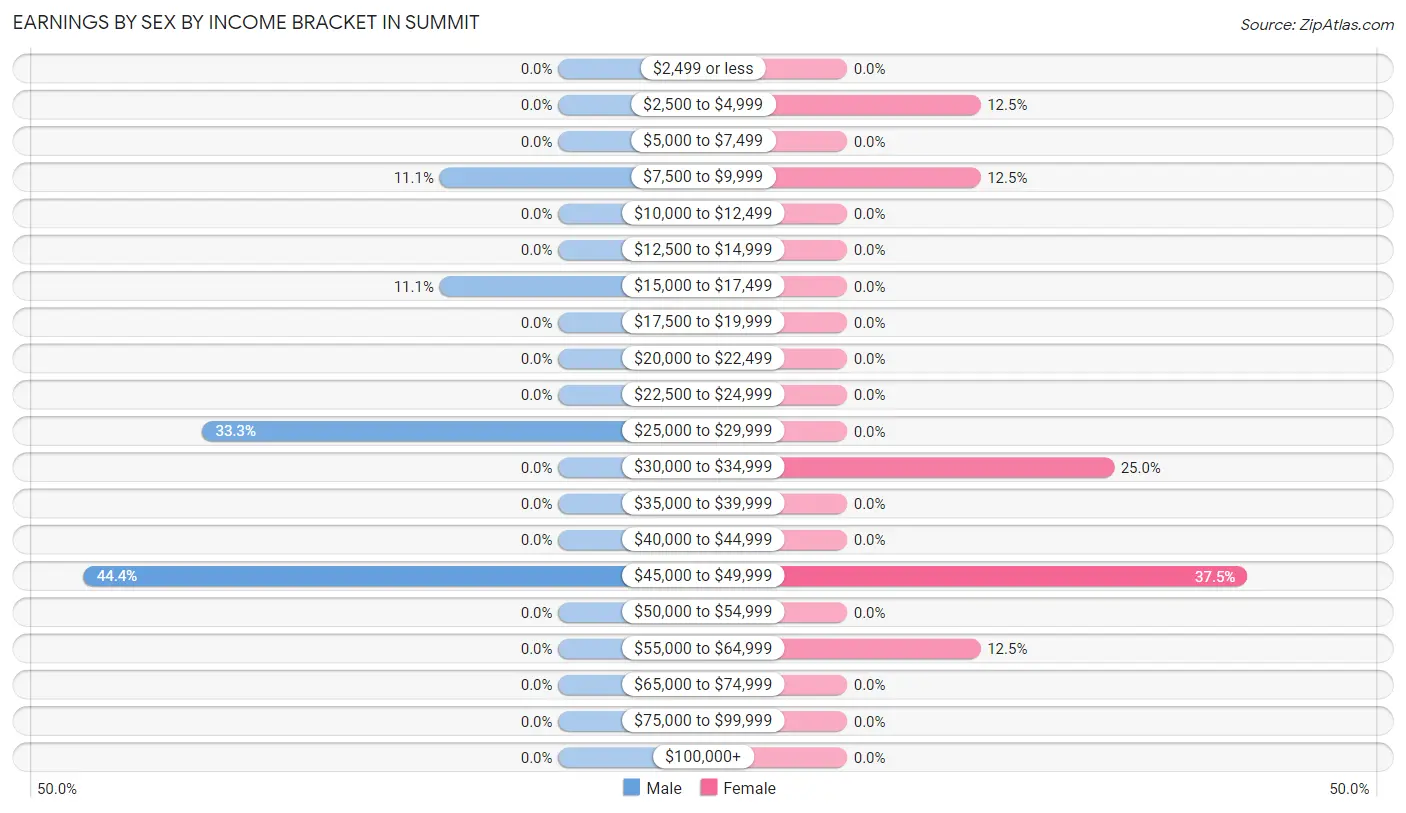
| Income | Male | Female |
| $2,499 or less | 0 (0.0%) | 0 (0.0%) |
| $2,500 to $4,999 | 0 (0.0%) | 1 (12.5%) |
| $5,000 to $7,499 | 0 (0.0%) | 0 (0.0%) |
| $7,500 to $9,999 | 1 (11.1%) | 1 (12.5%) |
| $10,000 to $12,499 | 0 (0.0%) | 0 (0.0%) |
| $12,500 to $14,999 | 0 (0.0%) | 0 (0.0%) |
| $15,000 to $17,499 | 1 (11.1%) | 0 (0.0%) |
| $17,500 to $19,999 | 0 (0.0%) | 0 (0.0%) |
| $20,000 to $22,499 | 0 (0.0%) | 0 (0.0%) |
| $22,500 to $24,999 | 0 (0.0%) | 0 (0.0%) |
| $25,000 to $29,999 | 3 (33.3%) | 0 (0.0%) |
| $30,000 to $34,999 | 0 (0.0%) | 2 (25.0%) |
| $35,000 to $39,999 | 0 (0.0%) | 0 (0.0%) |
| $40,000 to $44,999 | 0 (0.0%) | 0 (0.0%) |
| $45,000 to $49,999 | 4 (44.4%) | 3 (37.5%) |
| $50,000 to $54,999 | 0 (0.0%) | 0 (0.0%) |
| $55,000 to $64,999 | 0 (0.0%) | 1 (12.5%) |
| $65,000 to $74,999 | 0 (0.0%) | 0 (0.0%) |
| $75,000 to $99,999 | 0 (0.0%) | 0 (0.0%) |
| $100,000+ | 0 (0.0%) | 0 (0.0%) |
| Total | 9 (100.0%) | 8 (100.0%) |
Earnings by Sex by Educational Attainment in Summit
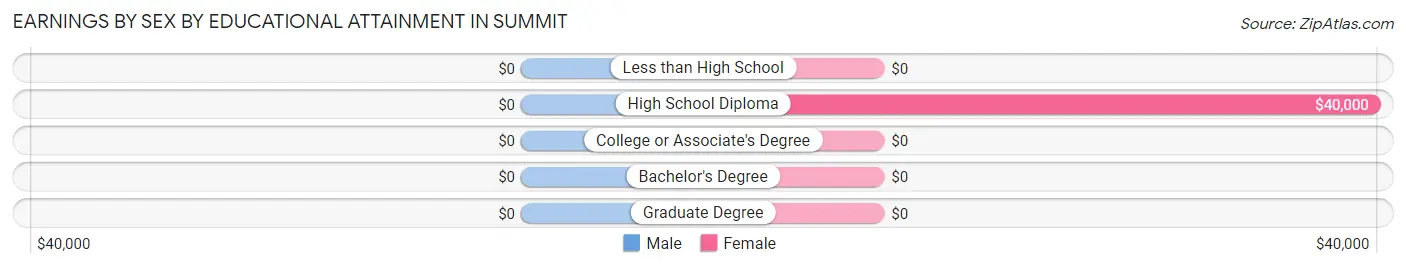
| Educational Attainment | Male Income | Female Income |
| Less than High School | - | - |
| High School Diploma | - | - |
| College or Associate's Degree | - | - |
| Bachelor's Degree | - | - |
| Graduate Degree | - | - |
| Total | $29,583 | $40,000 |
Family Income in Summit
Family Income Brackets in Summit
According to the Summit family income data, there are 6 families falling into the $35,000 to $49,999 income range, which is the most common income bracket and makes up 30.0% of all families.
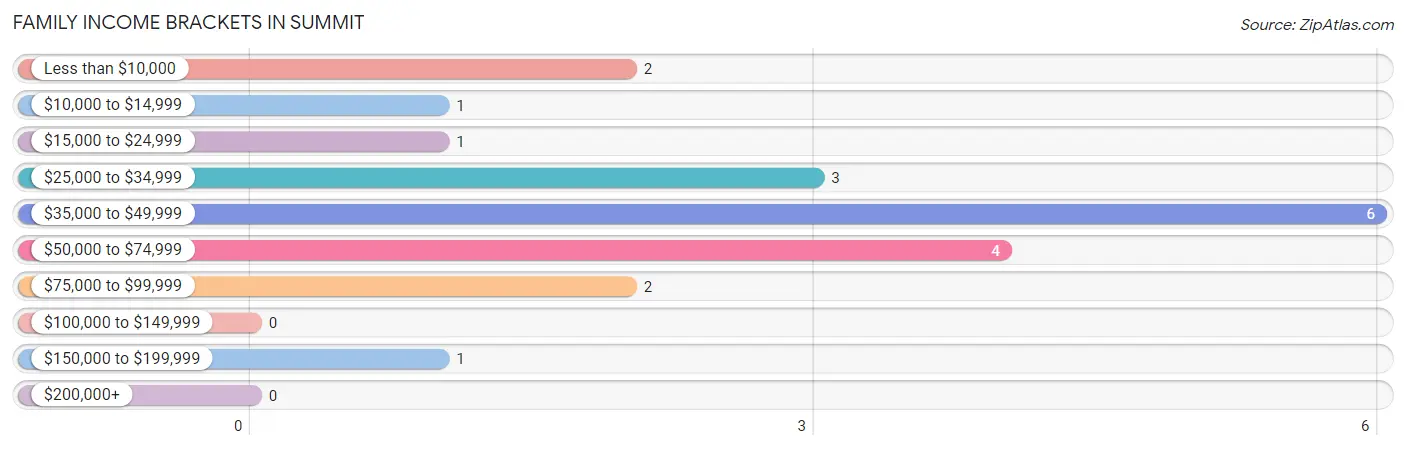
| Income Bracket | # Families | % Families |
| Less than $10,000 | 2 | 10.0% |
| $10,000 to $14,999 | 1 | 5.0% |
| $15,000 to $24,999 | 1 | 5.0% |
| $25,000 to $34,999 | 3 | 15.0% |
| $35,000 to $49,999 | 6 | 30.0% |
| $50,000 to $74,999 | 4 | 20.0% |
| $75,000 to $99,999 | 2 | 10.0% |
| $100,000 to $149,999 | 0 | 0.0% |
| $150,000 to $199,999 | 1 | 5.0% |
| $200,000+ | 0 | 0.0% |
Family Income by Famaliy Size in Summit
2-person families (11 | 55.0%) account for the highest median family income in Summit with $40,625 per family, while 2-person families (11 | 55.0%) have the highest median income of $20,312 per family member.
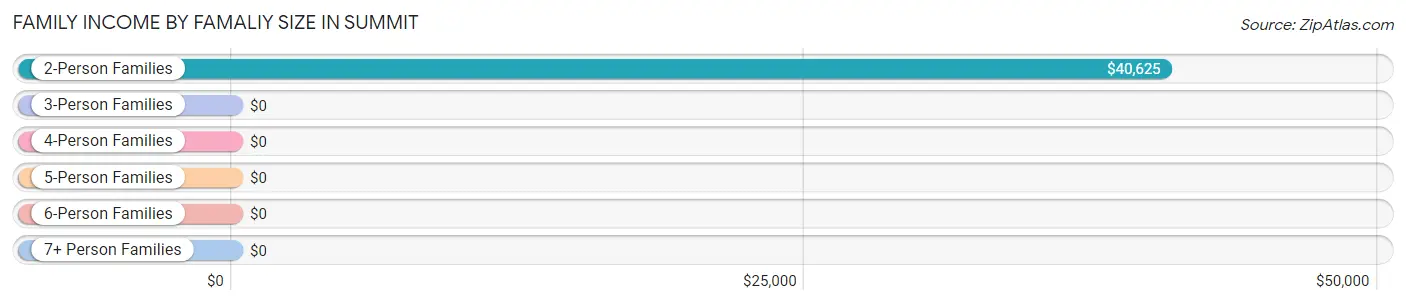
| Income Bracket | # Families | Median Income |
| 2-Person Families | 11 (55.0%) | $40,625 |
| 3-Person Families | 5 (25.0%) | $0 |
| 4-Person Families | 1 (5.0%) | $0 |
| 5-Person Families | 3 (15.0%) | $0 |
| 6-Person Families | 0 (0.0%) | $0 |
| 7+ Person Families | 0 (0.0%) | $0 |
| Total | 20 (100.0%) | $38,750 |
Family Income by Number of Earners in Summit
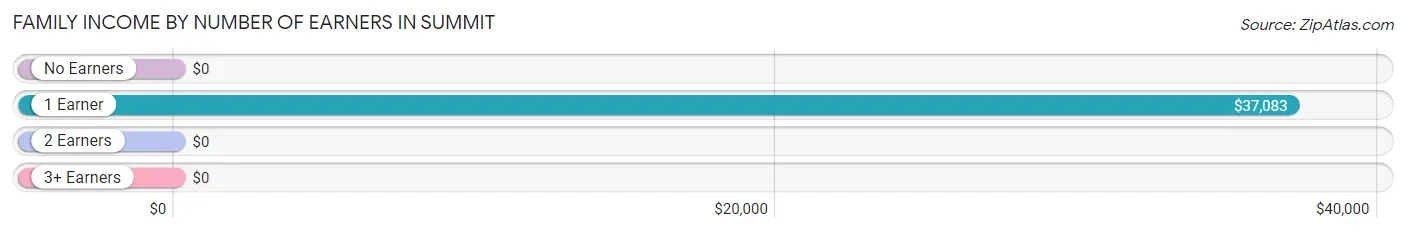
| Number of Earners | # Families | Median Income |
| No Earners | 8 (40.0%) | $0 |
| 1 Earner | 9 (45.0%) | $37,083 |
| 2 Earners | 3 (15.0%) | $0 |
| 3+ Earners | 0 (0.0%) | $0 |
| Total | 20 (100.0%) | $38,750 |
Household Income in Summit
Household Income Brackets in Summit
With 17 households falling in the category, the $10,000 to $14,999 income range is the most frequent in Summit, accounting for 46.0% of all households.
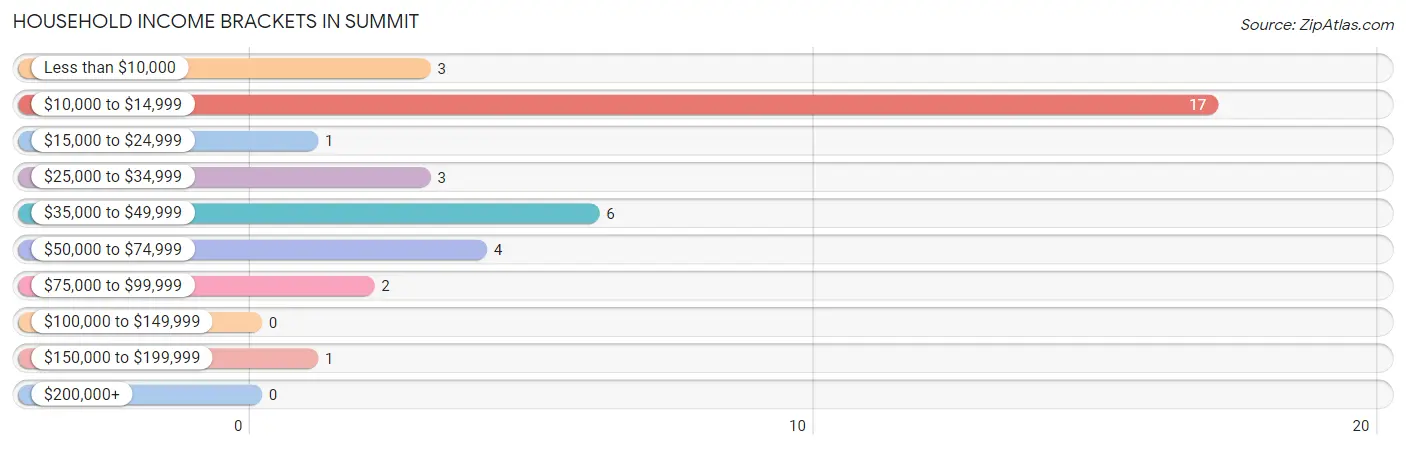
| Income Bracket | # Households | % Households |
| Less than $10,000 | 3 | 8.1% |
| $10,000 to $14,999 | 17 | 45.9% |
| $15,000 to $24,999 | 1 | 2.7% |
| $25,000 to $34,999 | 3 | 8.1% |
| $35,000 to $49,999 | 6 | 16.2% |
| $50,000 to $74,999 | 4 | 10.8% |
| $75,000 to $99,999 | 2 | 5.4% |
| $100,000 to $149,999 | 0 | 0.0% |
| $150,000 to $199,999 | 1 | 2.7% |
| $200,000+ | 0 | 0.0% |
Household Income by Householder Age in Summit
The median household income in Summit is $0, with the highest median household income of $14,141 found in the 65+ years age bracket for the primary householder. A total of 27 households (73.0%) fall into this category.
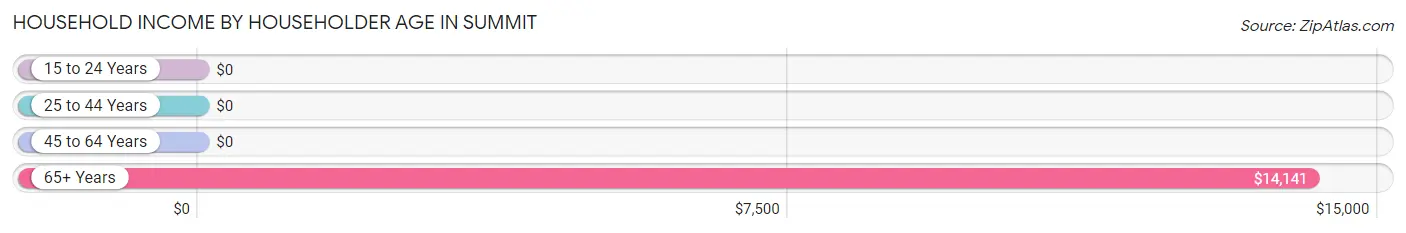
| Income Bracket | # Households | Median Income |
| 15 to 24 Years | 0 (0.0%) | $0 |
| 25 to 44 Years | 3 (8.1%) | $0 |
| 45 to 64 Years | 7 (18.9%) | $0 |
| 65+ Years | 27 (73.0%) | $14,141 |
| Total | 37 (100.0%) | $0 |
Poverty in Summit
Income Below Poverty by Sex and Age in Summit
With 15.6% poverty level for males and 51.0% for females among the residents of Summit, 75 year old and over males and 75 year old and over females are the most vulnerable to poverty, with 1 males (50.0%) and 14 females (87.5%) in their respective age groups living below the poverty level.
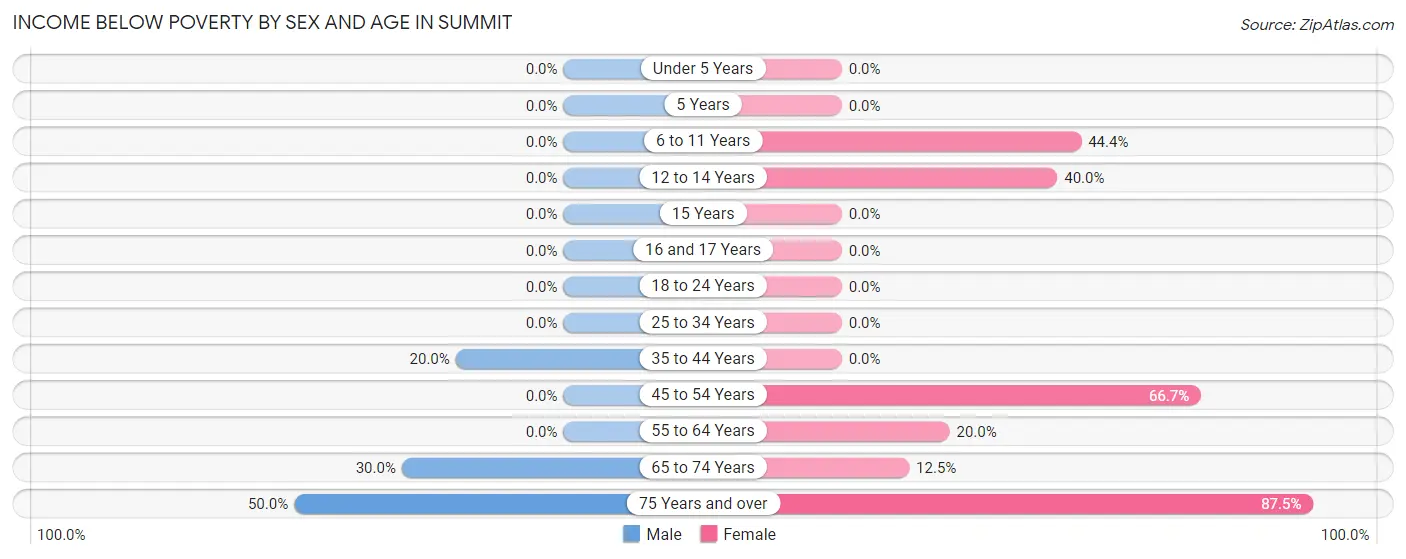
| Age Bracket | Male | Female |
| Under 5 Years | 0 (0.0%) | 0 (0.0%) |
| 5 Years | 0 (0.0%) | 0 (0.0%) |
| 6 to 11 Years | 0 (0.0%) | 4 (44.4%) |
| 12 to 14 Years | 0 (0.0%) | 2 (40.0%) |
| 15 Years | 0 (0.0%) | 0 (0.0%) |
| 16 and 17 Years | 0 (0.0%) | 0 (0.0%) |
| 18 to 24 Years | 0 (0.0%) | 0 (0.0%) |
| 25 to 34 Years | 0 (0.0%) | 0 (0.0%) |
| 35 to 44 Years | 1 (20.0%) | 0 (0.0%) |
| 45 to 54 Years | 0 (0.0%) | 4 (66.7%) |
| 55 to 64 Years | 0 (0.0%) | 1 (20.0%) |
| 65 to 74 Years | 3 (30.0%) | 1 (12.5%) |
| 75 Years and over | 1 (50.0%) | 14 (87.5%) |
| Total | 5 (15.6%) | 26 (51.0%) |
Income Above Poverty by Sex and Age in Summit
According to the poverty statistics in Summit, males aged under 5 years and females aged 35 to 44 years are the age groups that are most secure financially, with 100.0% of males and 100.0% of females in these age groups living above the poverty line.
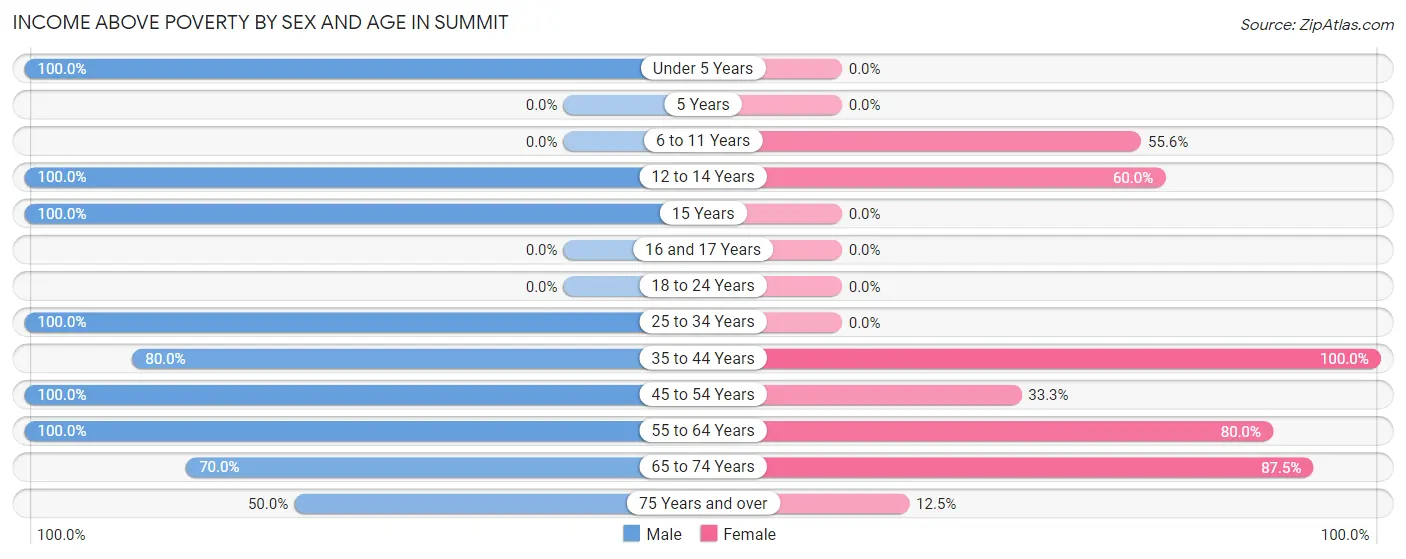
| Age Bracket | Male | Female |
| Under 5 Years | 1 (100.0%) | 0 (0.0%) |
| 5 Years | 0 (0.0%) | 0 (0.0%) |
| 6 to 11 Years | 0 (0.0%) | 5 (55.6%) |
| 12 to 14 Years | 2 (100.0%) | 3 (60.0%) |
| 15 Years | 6 (100.0%) | 0 (0.0%) |
| 16 and 17 Years | 0 (0.0%) | 0 (0.0%) |
| 18 to 24 Years | 0 (0.0%) | 0 (0.0%) |
| 25 to 34 Years | 1 (100.0%) | 0 (0.0%) |
| 35 to 44 Years | 4 (80.0%) | 2 (100.0%) |
| 45 to 54 Years | 1 (100.0%) | 2 (33.3%) |
| 55 to 64 Years | 4 (100.0%) | 4 (80.0%) |
| 65 to 74 Years | 7 (70.0%) | 7 (87.5%) |
| 75 Years and over | 1 (50.0%) | 2 (12.5%) |
| Total | 27 (84.4%) | 25 (49.0%) |
Income Below Poverty Among Married-Couple Families in Summit
The poverty statistics for married-couple families in Summit show that 18.8% or 3 of the total 16 families live below the poverty line. Families with 1 or 2 children have the highest poverty rate of 100.0%, comprising of 3 families. On the other hand, families with no children have the lowest poverty rate of 0.0%, which includes 0 families.
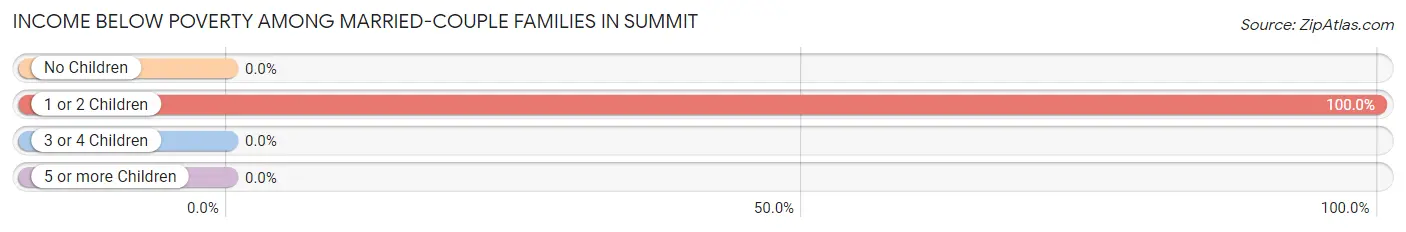
| Children | Above Poverty | Below Poverty |
| No Children | 11 (100.0%) | 0 (0.0%) |
| 1 or 2 Children | 0 (0.0%) | 3 (100.0%) |
| 3 or 4 Children | 2 (100.0%) | 0 (0.0%) |
| 5 or more Children | 0 (0.0%) | 0 (0.0%) |
| Total | 13 (81.2%) | 3 (18.8%) |
Income Below Poverty Among Single-Parent Households in Summit
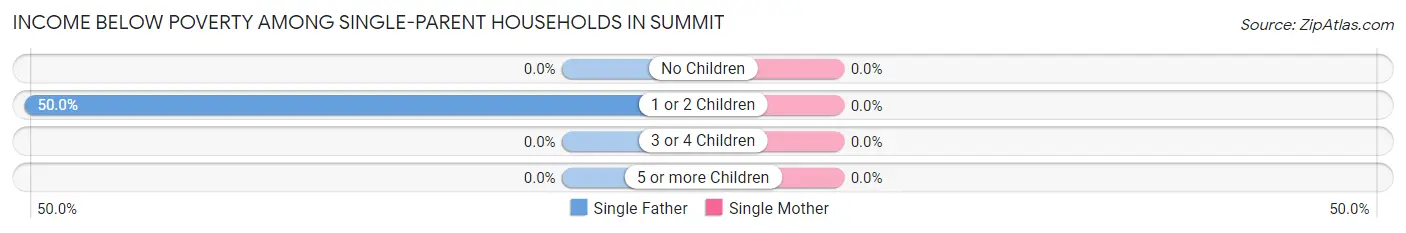
| Children | Single Father | Single Mother |
| No Children | 0 (0.0%) | 0 (0.0%) |
| 1 or 2 Children | 1 (50.0%) | 0 (0.0%) |
| 3 or 4 Children | 0 (0.0%) | 0 (0.0%) |
| 5 or more Children | 0 (0.0%) | 0 (0.0%) |
| Total | 1 (50.0%) | 0 (0.0%) |
Income Below Poverty Among Married-Couple vs Single-Parent Households in Summit
The poverty data for Summit shows that 3 of the married-couple family households (18.8%) and 1 of the single-parent households (25.0%) are living below the poverty level. Within the married-couple family households, those with 1 or 2 children have the highest poverty rate, with 3 households (100.0%) falling below the poverty line. Among the single-parent households, those with 1 or 2 children have the highest poverty rate, with 1 household (50.0%) living below poverty.
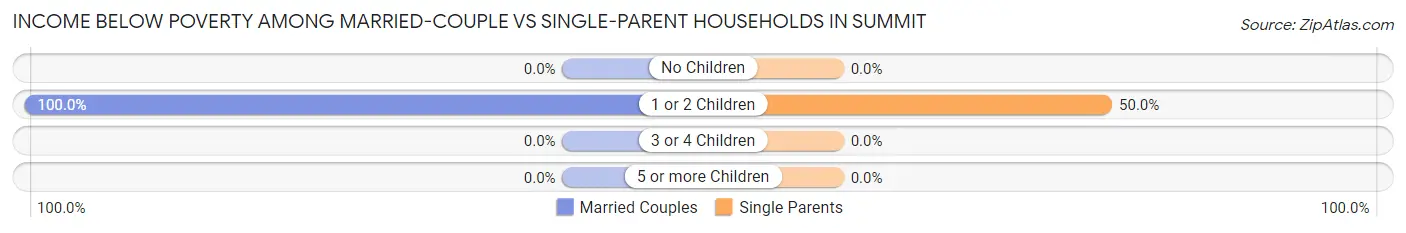
| Children | Married-Couple Families | Single-Parent Households |
| No Children | 0 (0.0%) | 0 (0.0%) |
| 1 or 2 Children | 3 (100.0%) | 1 (50.0%) |
| 3 or 4 Children | 0 (0.0%) | 0 (0.0%) |
| 5 or more Children | 0 (0.0%) | 0 (0.0%) |
| Total | 3 (18.8%) | 1 (25.0%) |
Race in Summit
The most populous races in Summit are Black / African American (54 | 65.1%), Two or more Races (18 | 21.7%), and White / Caucasian (9 | 10.8%).
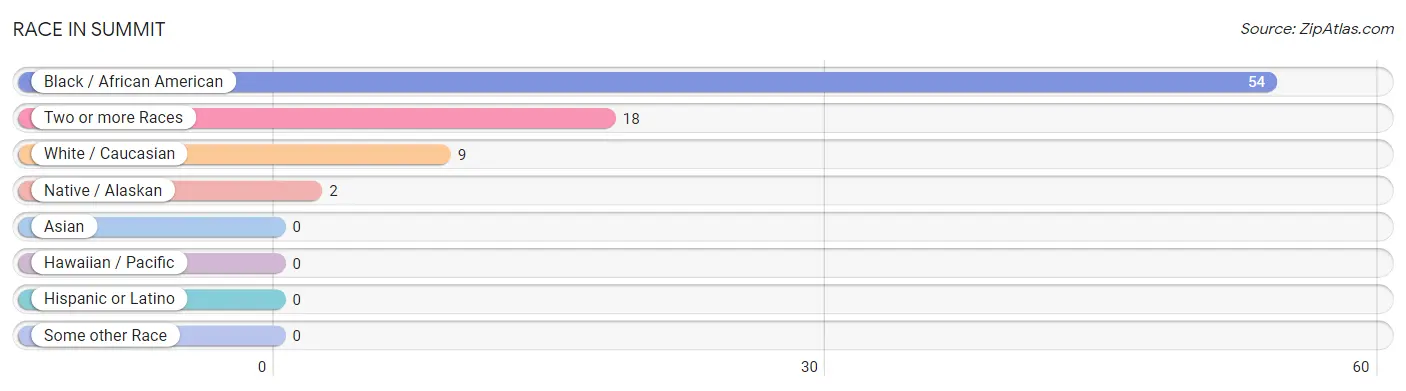
| Race | # Population | % Population |
| Asian | 0 | 0.0% |
| Black / African American | 54 | 65.1% |
| Hawaiian / Pacific | 0 | 0.0% |
| Hispanic or Latino | 0 | 0.0% |
| Native / Alaskan | 2 | 2.4% |
| White / Caucasian | 9 | 10.8% |
| Two or more Races | 18 | 21.7% |
| Some other Race | 0 | 0.0% |
| Total | 83 | 100.0% |
Ancestry in Summit
The most populous ancestries reported in Summit are American (20 | 24.1%), Creek (4 | 4.8%), German (2 | 2.4%), Irish (2 | 2.4%), and English (1 | 1.2%), together accounting for 34.9% of all Summit residents.
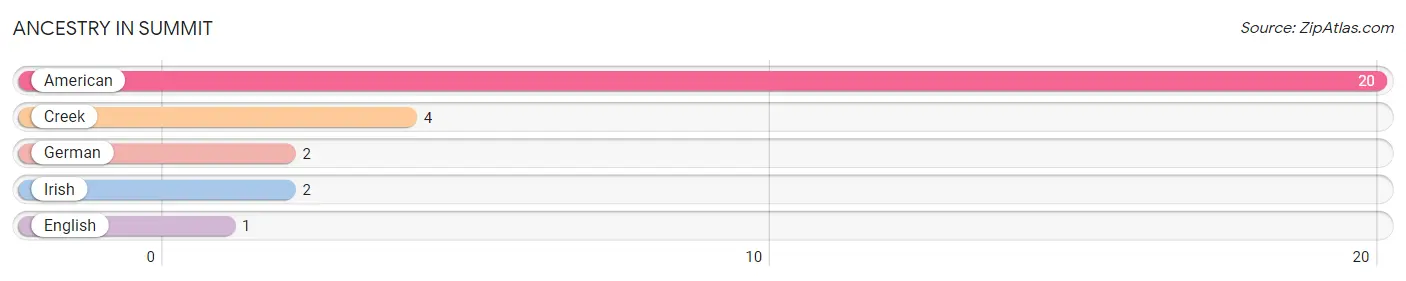
| Ancestry | # Population | % Population |
| American | 20 | 24.1% |
| Creek | 4 | 4.8% |
| English | 1 | 1.2% |
| German | 2 | 2.4% |
| Irish | 2 | 2.4% | View All 5 Rows |
Immigrants in Summit

| Immigration Origin | # Population | % Population | View All 0 Rows |
Sex and Age in Summit
Sex and Age in Summit
The most populous age groups in Summit are 65 to 69 Years (9 | 28.1%) for men and 75 to 79 Years (14 | 27.5%) for women.
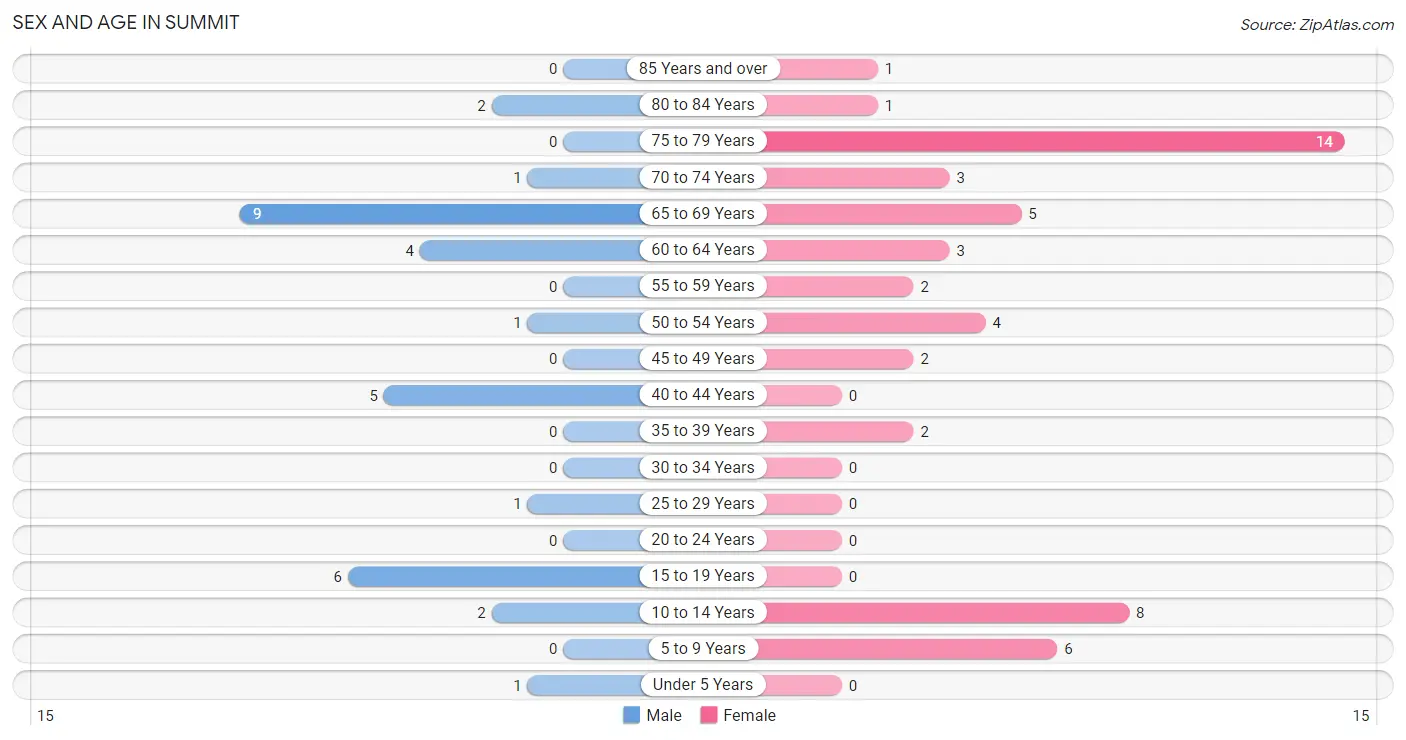
| Age Bracket | Male | Female |
| Under 5 Years | 1 (3.1%) | 0 (0.0%) |
| 5 to 9 Years | 0 (0.0%) | 6 (11.8%) |
| 10 to 14 Years | 2 (6.2%) | 8 (15.7%) |
| 15 to 19 Years | 6 (18.8%) | 0 (0.0%) |
| 20 to 24 Years | 0 (0.0%) | 0 (0.0%) |
| 25 to 29 Years | 1 (3.1%) | 0 (0.0%) |
| 30 to 34 Years | 0 (0.0%) | 0 (0.0%) |
| 35 to 39 Years | 0 (0.0%) | 2 (3.9%) |
| 40 to 44 Years | 5 (15.6%) | 0 (0.0%) |
| 45 to 49 Years | 0 (0.0%) | 2 (3.9%) |
| 50 to 54 Years | 1 (3.1%) | 4 (7.8%) |
| 55 to 59 Years | 0 (0.0%) | 2 (3.9%) |
| 60 to 64 Years | 4 (12.5%) | 3 (5.9%) |
| 65 to 69 Years | 9 (28.1%) | 5 (9.8%) |
| 70 to 74 Years | 1 (3.1%) | 3 (5.9%) |
| 75 to 79 Years | 0 (0.0%) | 14 (27.5%) |
| 80 to 84 Years | 2 (6.2%) | 1 (2.0%) |
| 85 Years and over | 0 (0.0%) | 1 (2.0%) |
| Total | 32 (100.0%) | 51 (100.0%) |
Families and Households in Summit
Median Family Size in Summit
The median family size in Summit is 3.25 persons per family, with single female/mother families (2 | 10.0%) accounting for the largest median family size of 5.5 persons per family. On the other hand, single male/father families (2 | 10.0%) represent the smallest median family size with 2.50 persons per family.
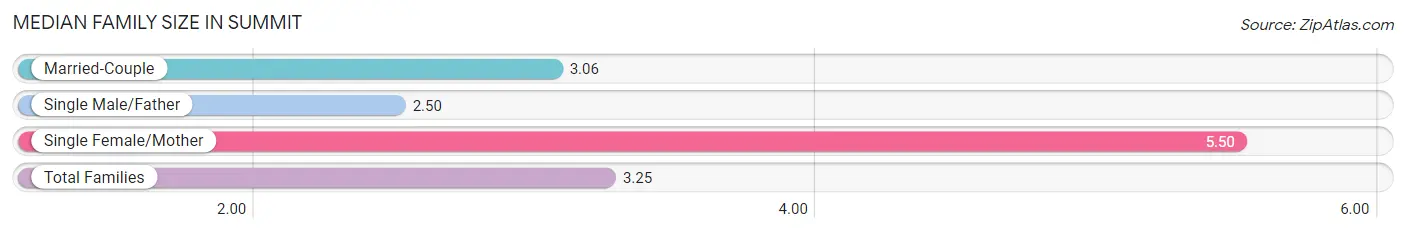
| Family Type | # Families | Family Size |
| Married-Couple | 16 (80.0%) | 3.06 |
| Single Male/Father | 2 (10.0%) | 2.50 |
| Single Female/Mother | 2 (10.0%) | 5.50 |
| Total Families | 20 (100.0%) | 3.25 |
Median Household Size in Summit
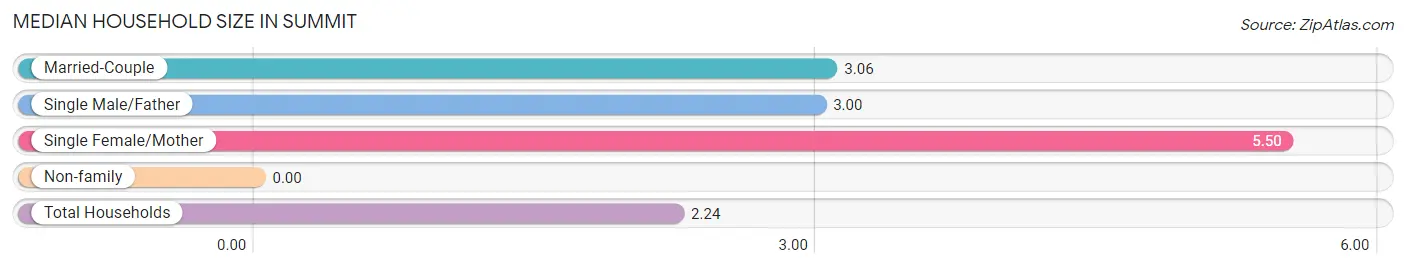
| Household Type | # Households | Household Size |
| Married-Couple | 16 (43.2%) | 3.06 |
| Single Male/Father | 2 (5.4%) | 3.00 |
| Single Female/Mother | 2 (5.4%) | 5.50 |
| Non-family | 17 (46.0%) | - |
| Total Households | 37 (100.0%) | 2.24 |
Household Size by Marriage Status in Summit
Out of a total of 37 households in Summit, 20 (54.0%) are family households, while 17 (46.0%) are nonfamily households. The most numerous type of family households are 2-person households, comprising 10, and the most common type of nonfamily households are 1-person households, comprising 17.
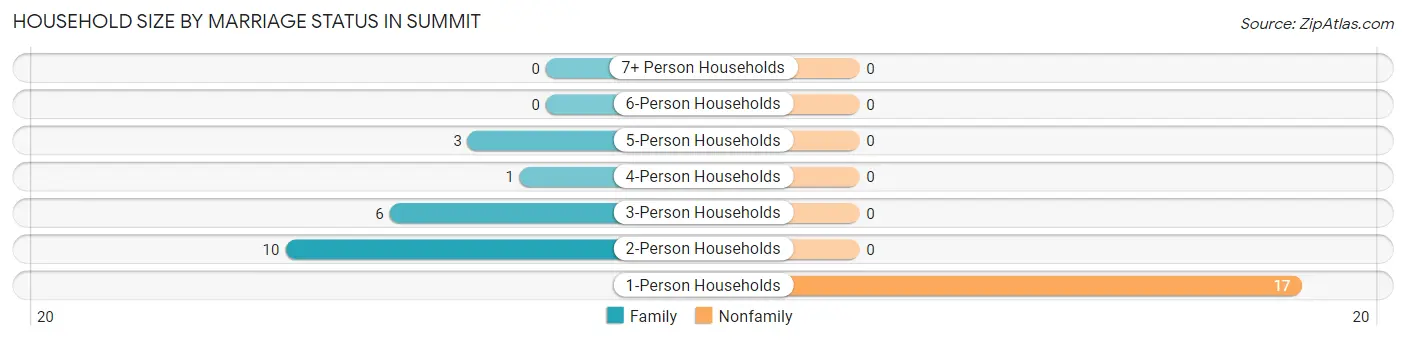
| Household Size | Family Households | Nonfamily Households |
| 1-Person Households | - | 17 (46.0%) |
| 2-Person Households | 10 (27.0%) | 0 (0.0%) |
| 3-Person Households | 6 (16.2%) | 0 (0.0%) |
| 4-Person Households | 1 (2.7%) | 0 (0.0%) |
| 5-Person Households | 3 (8.1%) | 0 (0.0%) |
| 6-Person Households | 0 (0.0%) | 0 (0.0%) |
| 7+ Person Households | 0 (0.0%) | 0 (0.0%) |
| Total | 20 (54.0%) | 17 (46.0%) |
Female Fertility in Summit
Fertility by Age in Summit
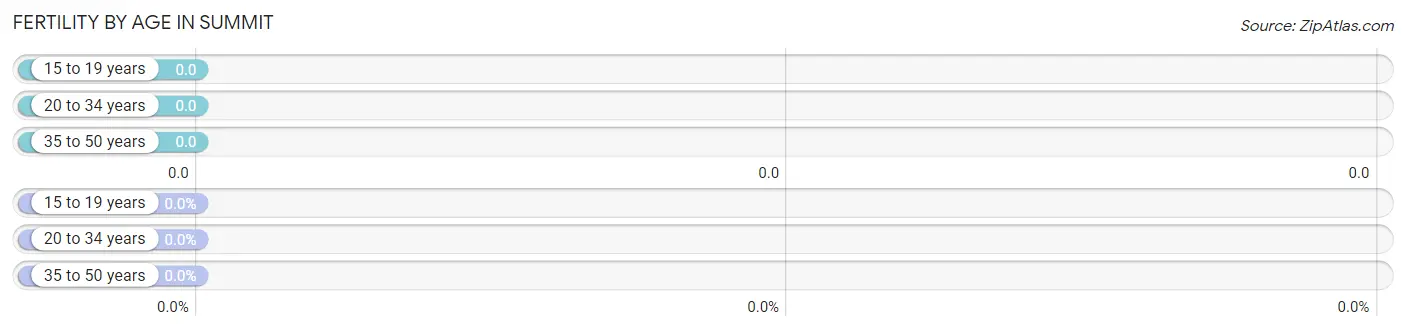
| Age Bracket | Women with Births | Births / 1,000 Women |
| 15 to 19 years | 0 (0.0%) | 0.0 |
| 20 to 34 years | 0 (0.0%) | 0.0 |
| 35 to 50 years | 0 (0.0%) | 0.0 |
| Total | 0 (0.0%) | 0.0 |
Fertility by Age by Marriage Status in Summit
| Age Bracket | Married | Unmarried |
| 15 to 19 years | 0 (0.0%) | 0 (0.0%) |
| 20 to 34 years | 0 (0.0%) | 0 (0.0%) |
| 35 to 50 years | 0 (0.0%) | 0 (0.0%) |
| Total | 0 (0.0%) | 0 (0.0%) |
Fertility by Education in Summit
| Educational Attainment | Women with Births | Births / 1,000 Women |
| Less than High School | 0 (0.0%) | 0.0 |
| High School Diploma | 0 (0.0%) | 0.0 |
| College or Associate's Degree | 0 (0.0%) | 0.0 |
| Bachelor's Degree | 0 (0.0%) | 0.0 |
| Graduate Degree | 0 (0.0%) | 0.0 |
| Total | 0 (0.0%) | 0.0 |
Fertility by Education by Marriage Status in Summit
| Educational Attainment | Married | Unmarried |
| Less than High School | 0 (0.0%) | 0 (0.0%) |
| High School Diploma | 0 (0.0%) | 0 (0.0%) |
| College or Associate's Degree | 0 (0.0%) | 0 (0.0%) |
| Bachelor's Degree | 0 (0.0%) | 0 (0.0%) |
| Graduate Degree | 0 (0.0%) | 0 (0.0%) |
| Total | 0 (0.0%) | 0 (0.0%) |
Employment Characteristics in Summit
Employment by Class of Employer in Summit
Among the 15 employed individuals in Summit, private company employees (8 | 53.3%), self-employed (incorporated) (3 | 20.0%), and self-employed (not incorporated) (2 | 13.3%) make up the most common classes of employment.
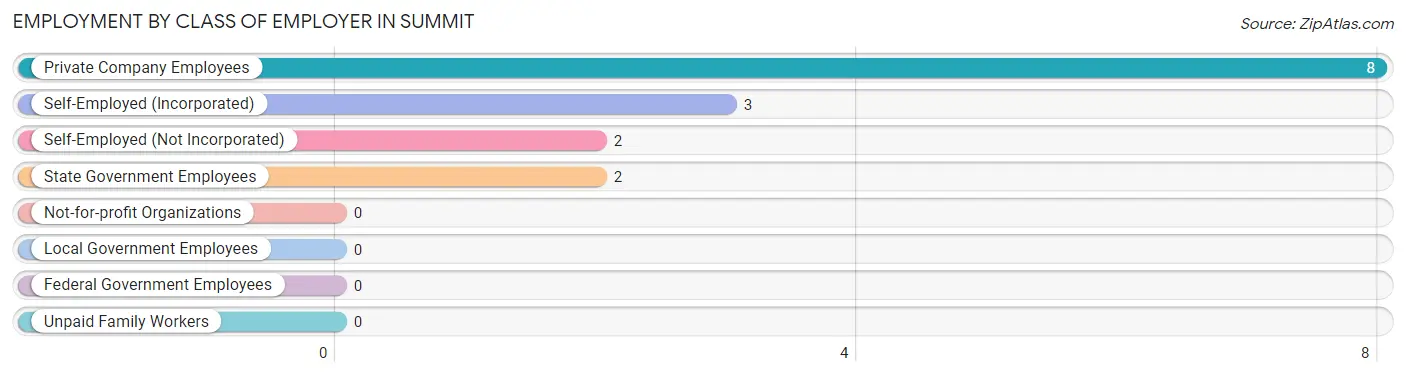
| Employer Class | # Employees | % Employees |
| Private Company Employees | 8 | 53.3% |
| Self-Employed (Incorporated) | 3 | 20.0% |
| Self-Employed (Not Incorporated) | 2 | 13.3% |
| Not-for-profit Organizations | 0 | 0.0% |
| Local Government Employees | 0 | 0.0% |
| State Government Employees | 2 | 13.3% |
| Federal Government Employees | 0 | 0.0% |
| Unpaid Family Workers | 0 | 0.0% |
| Total | 15 | 100.0% |
Employment Status by Age in Summit
According to the labor force statistics for Summit, out of the total population over 16 years of age (60), 26.7% or 16 individuals are in the labor force, with 6.3% or 1 of them unemployed. The age group with the highest labor force participation rate is 35 to 44 years, with 100.0% or 7 individuals in the labor force. Within the labor force, the 45 to 54 years age range has the highest percentage of unemployed individuals, with 25.0% or 1 of them being unemployed.
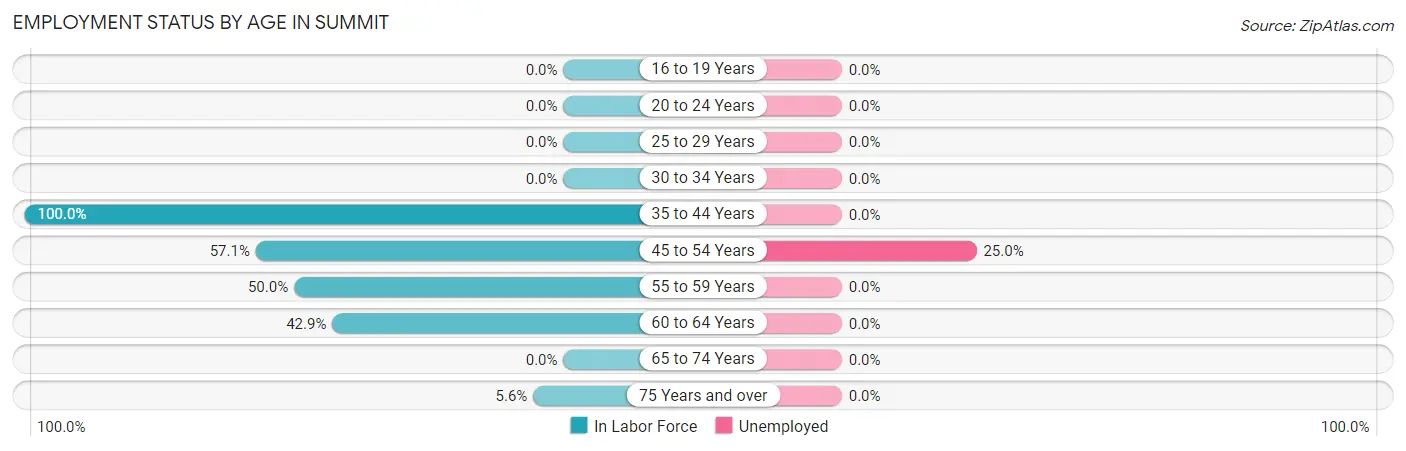
| Age Bracket | In Labor Force | Unemployed |
| 16 to 19 Years | 0 (0.0%) | 0 (0.0%) |
| 20 to 24 Years | 0 (0.0%) | 0 (0.0%) |
| 25 to 29 Years | 0 (0.0%) | 0 (0.0%) |
| 30 to 34 Years | 0 (0.0%) | 0 (0.0%) |
| 35 to 44 Years | 7 (100.0%) | 0 (0.0%) |
| 45 to 54 Years | 4 (57.1%) | 1 (25.0%) |
| 55 to 59 Years | 1 (50.0%) | 0 (0.0%) |
| 60 to 64 Years | 3 (42.9%) | 0 (0.0%) |
| 65 to 74 Years | 0 (0.0%) | 0 (0.0%) |
| 75 Years and over | 1 (5.6%) | 0 (0.0%) |
| Total | 16 (26.7%) | 1 (6.3%) |
Employment Status by Educational Attainment in Summit
According to labor force statistics for Summit, 62.5% of individuals (15) out of the total population between 25 and 64 years of age (24) are in the labor force, with 6.7% or 1 of them being unemployed. The group with the highest labor force participation rate are those with the educational attainment of high school diploma, with 83.3% or 10 individuals in the labor force. Within the labor force, individuals with college / associate degree education have the highest percentage of unemployment, with 50.0% or 1 of them being unemployed.
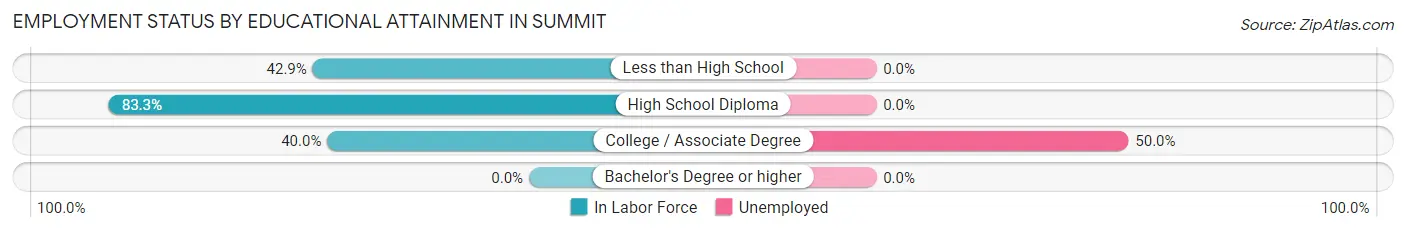
| Educational Attainment | In Labor Force | Unemployed |
| Less than High School | 3 (42.9%) | 0 (0.0%) |
| High School Diploma | 10 (83.3%) | 0 (0.0%) |
| College / Associate Degree | 2 (40.0%) | 2 (50.0%) |
| Bachelor's Degree or higher | 0 (0.0%) | 0 (0.0%) |
| Total | 15 (62.5%) | 2 (6.7%) |
Employment Occupations by Sex in Summit
Management, Business, Science and Arts Occupations
The most common Management, Business, Science and Arts occupations in Summit are Community & Social Service (3 | 20.0%), Education, Arts & Media (3 | 20.0%), and Management (1 | 6.7%).
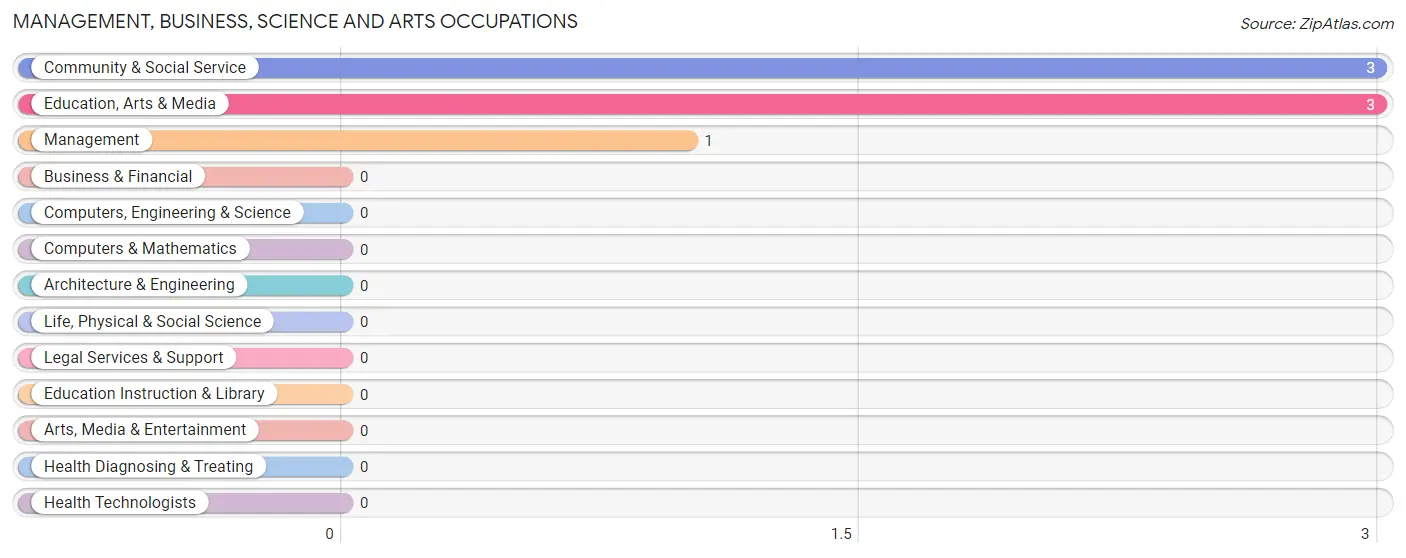
Management, Business, Science and Arts Occupations by Sex
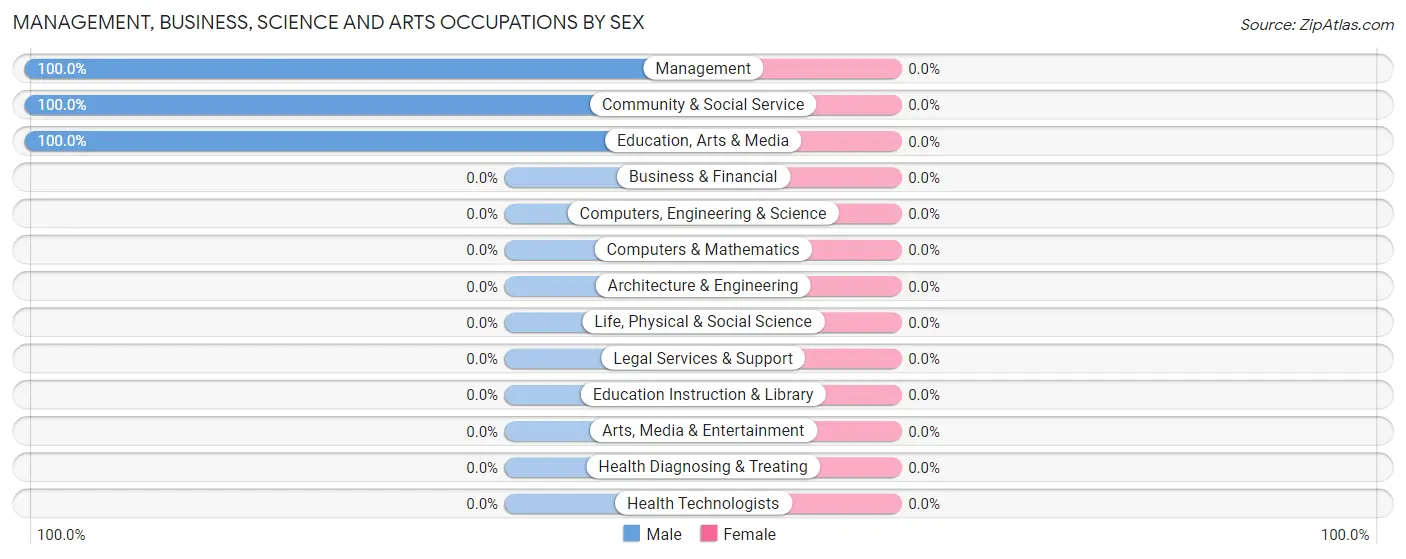
| Occupation | Male | Female |
| Management | 1 (100.0%) | 0 (0.0%) |
| Business & Financial | 0 (0.0%) | 0 (0.0%) |
| Computers, Engineering & Science | 0 (0.0%) | 0 (0.0%) |
| Computers & Mathematics | 0 (0.0%) | 0 (0.0%) |
| Architecture & Engineering | 0 (0.0%) | 0 (0.0%) |
| Life, Physical & Social Science | 0 (0.0%) | 0 (0.0%) |
| Community & Social Service | 3 (100.0%) | 0 (0.0%) |
| Education, Arts & Media | 3 (100.0%) | 0 (0.0%) |
| Legal Services & Support | 0 (0.0%) | 0 (0.0%) |
| Education Instruction & Library | 0 (0.0%) | 0 (0.0%) |
| Arts, Media & Entertainment | 0 (0.0%) | 0 (0.0%) |
| Health Diagnosing & Treating | 0 (0.0%) | 0 (0.0%) |
| Health Technologists | 0 (0.0%) | 0 (0.0%) |
| Total (Category) | 4 (100.0%) | 0 (0.0%) |
| Total (Overall) | 9 (60.0%) | 6 (40.0%) |
Services Occupations
The most common Services occupations in Summit are , and Healthcare Support (1 | 6.7%).
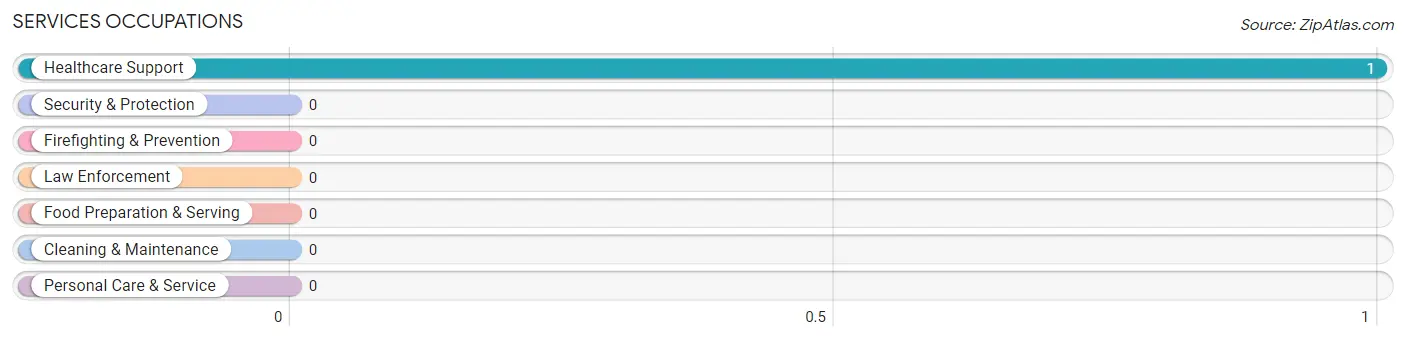
Services Occupations by Sex
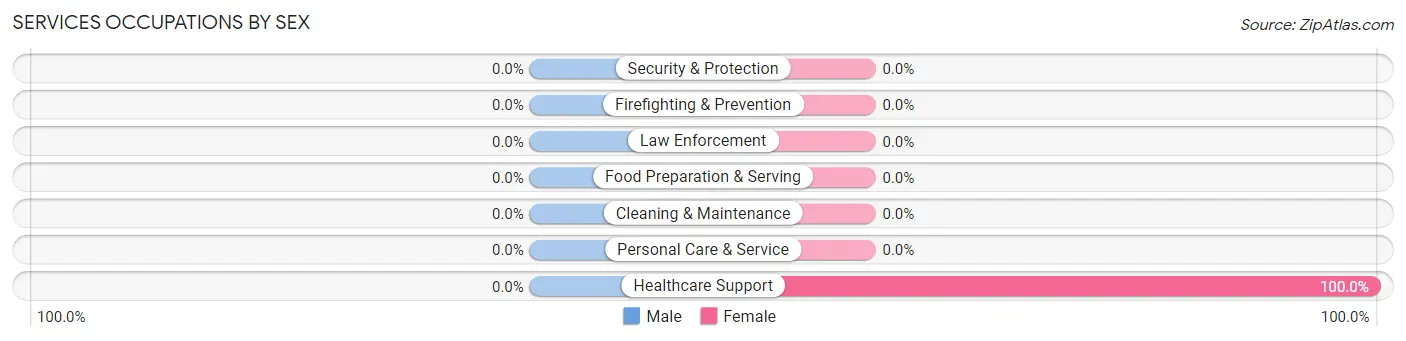
| Occupation | Male | Female |
| Healthcare Support | 0 (0.0%) | 1 (100.0%) |
| Security & Protection | 0 (0.0%) | 0 (0.0%) |
| Firefighting & Prevention | 0 (0.0%) | 0 (0.0%) |
| Law Enforcement | 0 (0.0%) | 0 (0.0%) |
| Food Preparation & Serving | 0 (0.0%) | 0 (0.0%) |
| Cleaning & Maintenance | 0 (0.0%) | 0 (0.0%) |
| Personal Care & Service | 0 (0.0%) | 0 (0.0%) |
| Total (Category) | 0 (0.0%) | 1 (100.0%) |
| Total (Overall) | 9 (60.0%) | 6 (40.0%) |
Sales and Office Occupations
The most common Sales and Office occupations in Summit are , and Office & Administration (2 | 13.3%).
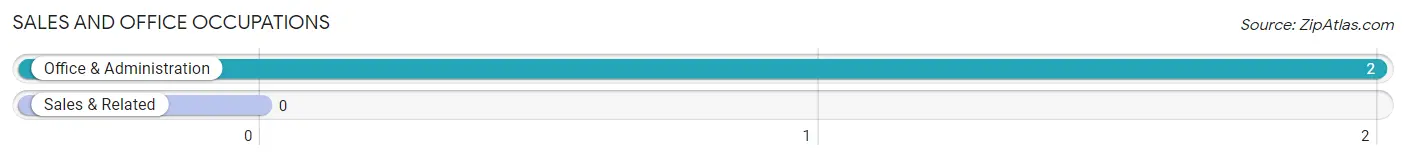
Sales and Office Occupations by Sex
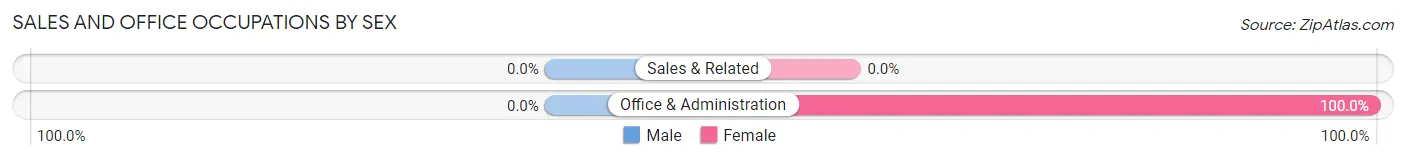
| Occupation | Male | Female |
| Sales & Related | 0 (0.0%) | 0 (0.0%) |
| Office & Administration | 0 (0.0%) | 2 (100.0%) |
| Total (Category) | 0 (0.0%) | 2 (100.0%) |
| Total (Overall) | 9 (60.0%) | 6 (40.0%) |
Natural Resources, Construction and Maintenance Occupations
The most common Natural Resources, Construction and Maintenance occupations in Summit are , and Construction & Extraction (1 | 6.7%).
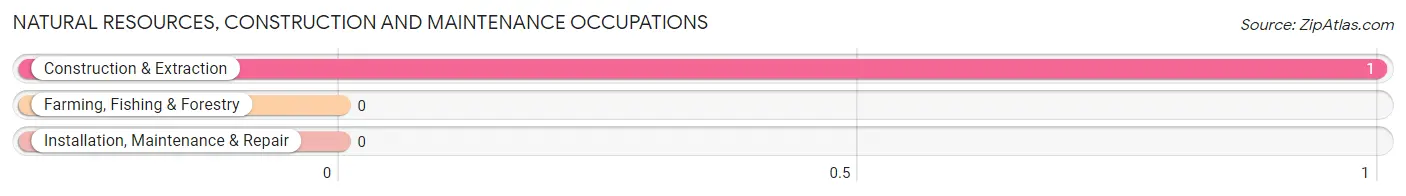
Natural Resources, Construction and Maintenance Occupations by Sex
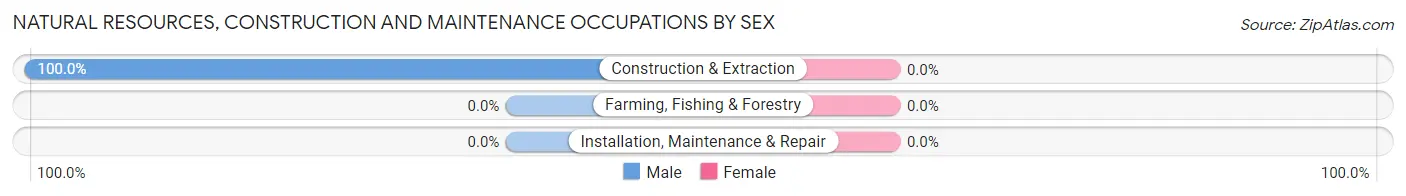
| Occupation | Male | Female |
| Farming, Fishing & Forestry | 0 (0.0%) | 0 (0.0%) |
| Construction & Extraction | 1 (100.0%) | 0 (0.0%) |
| Installation, Maintenance & Repair | 0 (0.0%) | 0 (0.0%) |
| Total (Category) | 1 (100.0%) | 0 (0.0%) |
| Total (Overall) | 9 (60.0%) | 6 (40.0%) |
Production, Transportation and Moving Occupations
The most common Production, Transportation and Moving occupations in Summit are Material Moving (6 | 40.0%), and Transportation (1 | 6.7%).
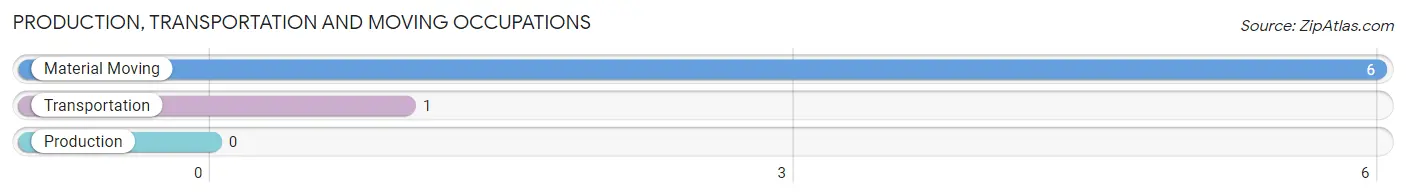
Production, Transportation and Moving Occupations by Sex
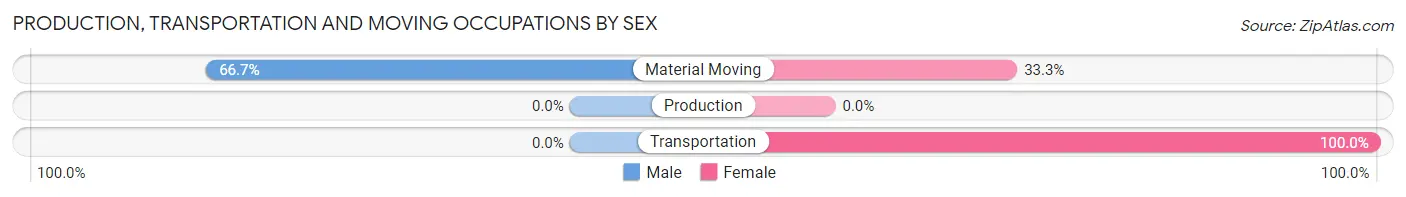
| Occupation | Male | Female |
| Production | 0 (0.0%) | 0 (0.0%) |
| Transportation | 0 (0.0%) | 1 (100.0%) |
| Material Moving | 4 (66.7%) | 2 (33.3%) |
| Total (Category) | 4 (57.1%) | 3 (42.9%) |
| Total (Overall) | 9 (60.0%) | 6 (40.0%) |
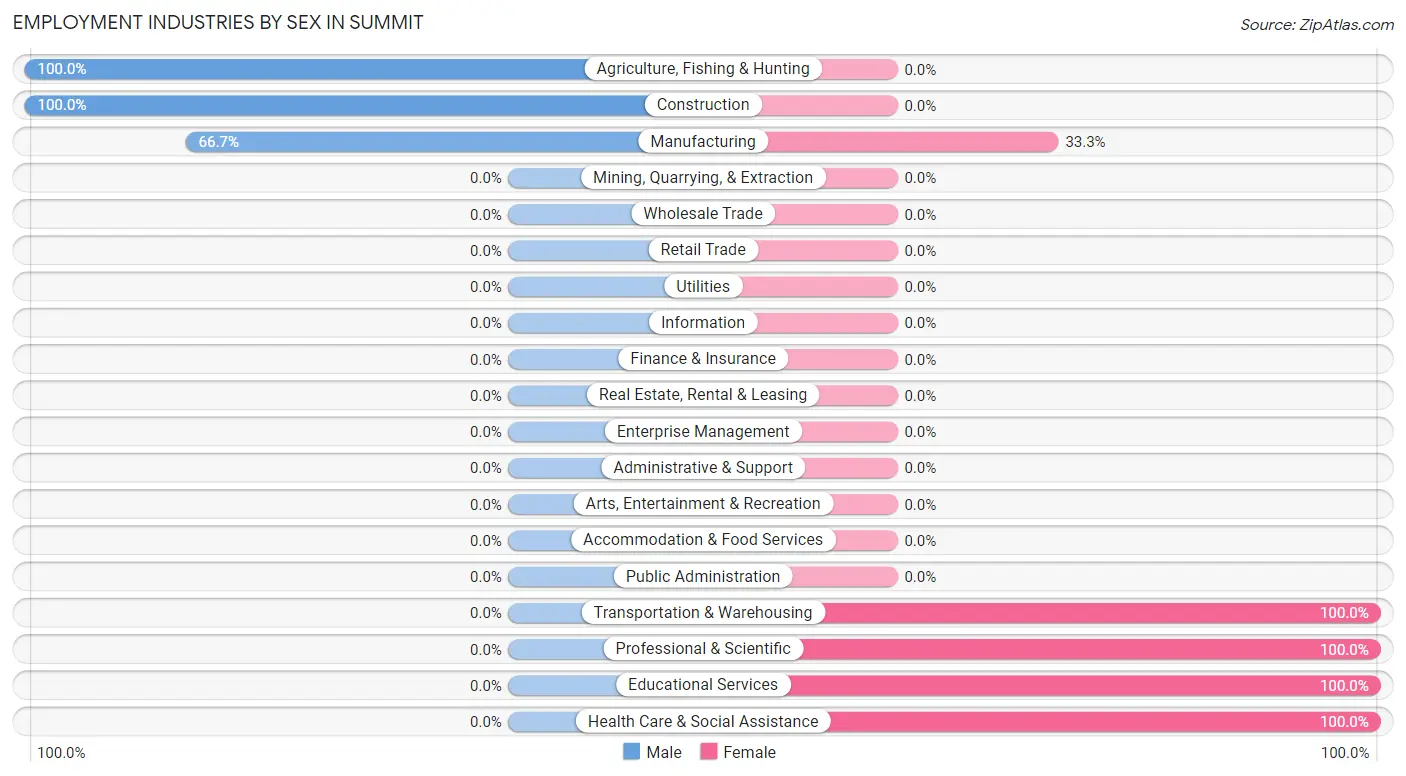
Employment Industries by Sex in Summit
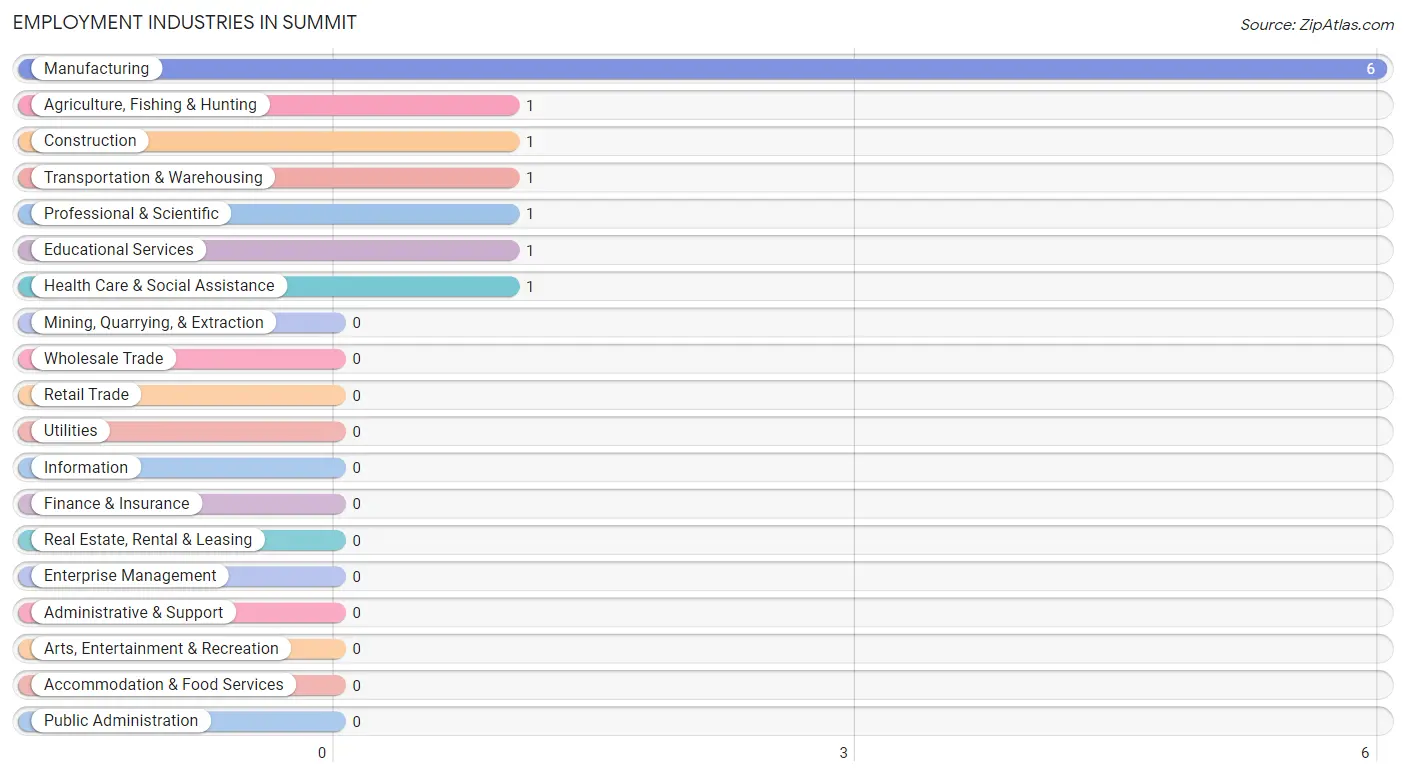
Employment Industries in Summit
The major employment industries in Summit include Manufacturing (6 | 40.0%), Agriculture, Fishing & Hunting (1 | 6.7%), Construction (1 | 6.7%), Transportation & Warehousing (1 | 6.7%), and Professional & Scientific (1 | 6.7%).
Employment Industries by Sex in Summit
The Summit industries that see more men than women are Agriculture, Fishing & Hunting (100.0%), Construction (100.0%), and Manufacturing (66.7%), whereas the industries that tend to have a higher number of women are Transportation & Warehousing (100.0%), Professional & Scientific (100.0%), and Educational Services (100.0%).
| Industry | Male | Female |
| Agriculture, Fishing & Hunting | 1 (100.0%) | 0 (0.0%) |
| Mining, Quarrying, & Extraction | 0 (0.0%) | 0 (0.0%) |
| Construction | 1 (100.0%) | 0 (0.0%) |
| Manufacturing | 4 (66.7%) | 2 (33.3%) |
| Wholesale Trade | 0 (0.0%) | 0 (0.0%) |
| Retail Trade | 0 (0.0%) | 0 (0.0%) |
| Transportation & Warehousing | 0 (0.0%) | 1 (100.0%) |
| Utilities | 0 (0.0%) | 0 (0.0%) |
| Information | 0 (0.0%) | 0 (0.0%) |
| Finance & Insurance | 0 (0.0%) | 0 (0.0%) |
| Real Estate, Rental & Leasing | 0 (0.0%) | 0 (0.0%) |
| Professional & Scientific | 0 (0.0%) | 1 (100.0%) |
| Enterprise Management | 0 (0.0%) | 0 (0.0%) |
| Administrative & Support | 0 (0.0%) | 0 (0.0%) |
| Educational Services | 0 (0.0%) | 1 (100.0%) |
| Health Care & Social Assistance | 0 (0.0%) | 1 (100.0%) |
| Arts, Entertainment & Recreation | 0 (0.0%) | 0 (0.0%) |
| Accommodation & Food Services | 0 (0.0%) | 0 (0.0%) |
| Public Administration | 0 (0.0%) | 0 (0.0%) |
| Total | 9 (60.0%) | 6 (40.0%) |
Education in Summit
School Enrollment in Summit
The most common levels of schooling among the 21 students in Summit are middle school (11 | 52.4%), elementary school (6 | 28.6%), and high school (3 | 14.3%).
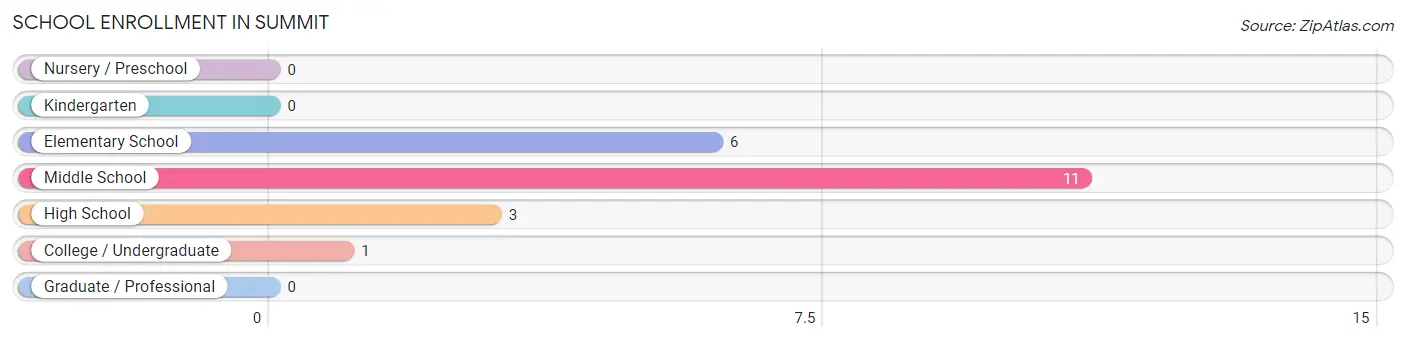
| School Level | # Students | % Students |
| Nursery / Preschool | 0 | 0.0% |
| Kindergarten | 0 | 0.0% |
| Elementary School | 6 | 28.6% |
| Middle School | 11 | 52.4% |
| High School | 3 | 14.3% |
| College / Undergraduate | 1 | 4.8% |
| Graduate / Professional | 0 | 0.0% |
| Total | 21 | 100.0% |
School Enrollment by Age by Funding Source in Summit
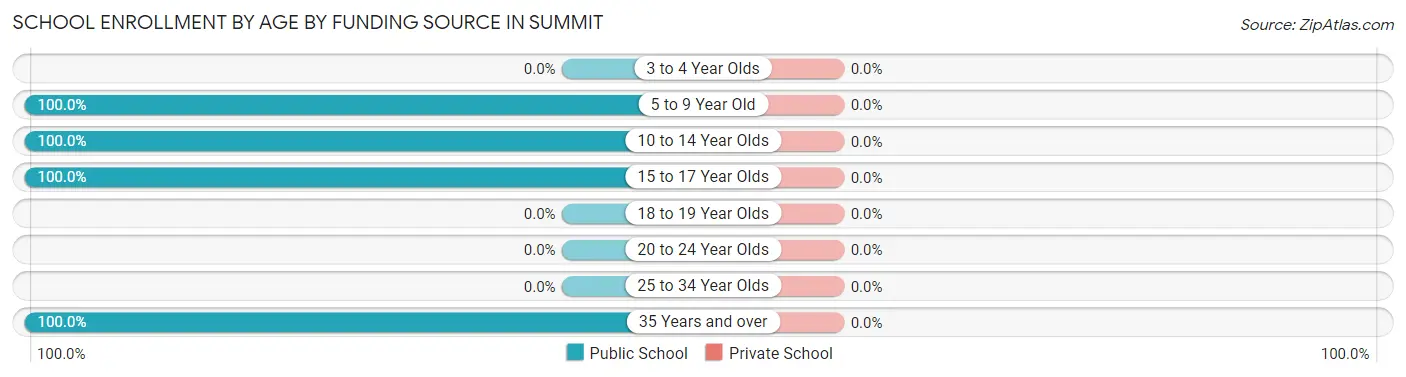
| Age Bracket | Public School | Private School |
| 3 to 4 Year Olds | 0 (0.0%) | 0 (0.0%) |
| 5 to 9 Year Old | 6 (100.0%) | 0 (0.0%) |
| 10 to 14 Year Olds | 8 (100.0%) | 0 (0.0%) |
| 15 to 17 Year Olds | 6 (100.0%) | 0 (0.0%) |
| 18 to 19 Year Olds | 0 (0.0%) | 0 (0.0%) |
| 20 to 24 Year Olds | 0 (0.0%) | 0 (0.0%) |
| 25 to 34 Year Olds | 0 (0.0%) | 0 (0.0%) |
| 35 Years and over | 1 (100.0%) | 0 (0.0%) |
| Total | 21 (100.0%) | 0 (0.0%) |
Educational Attainment by Field of Study in Summit
Bio, nature & agricultural (1 | 50.0%), and social sciences (1 | 50.0%) are the most common fields of study among 2 individuals in Summit who have obtained a bachelor's degree or higher.
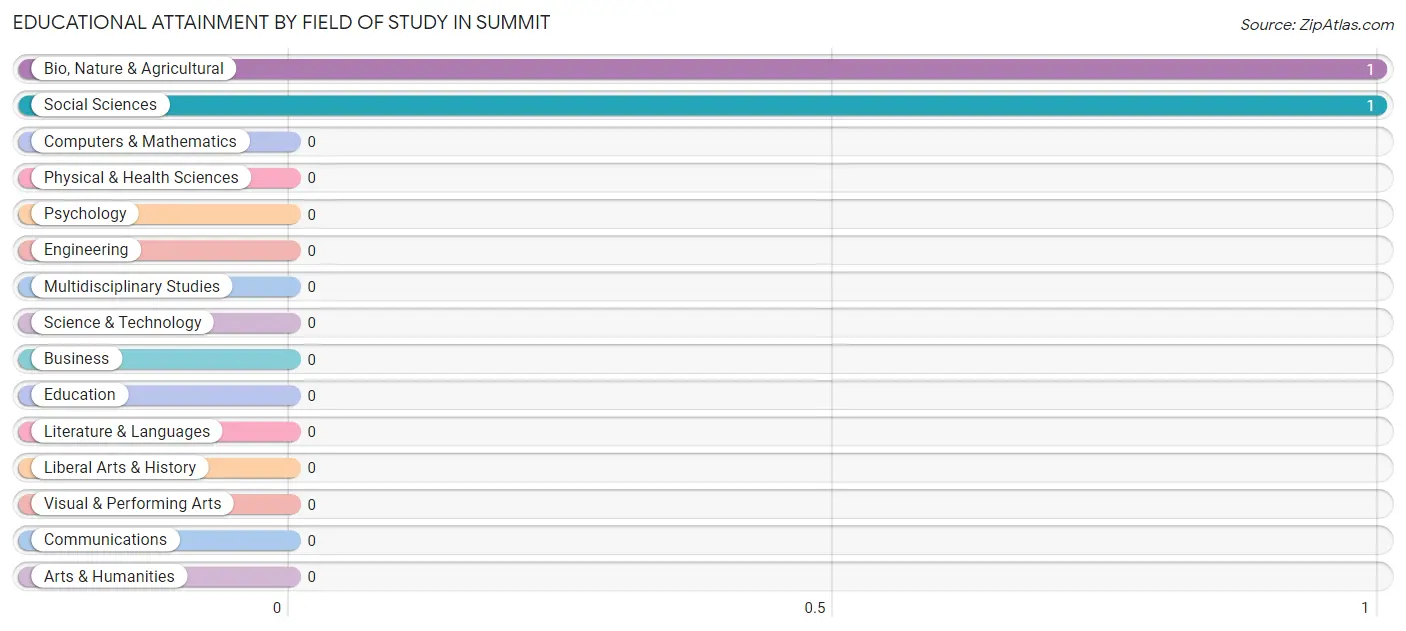
| Field of Study | # Graduates | % Graduates |
| Computers & Mathematics | 0 | 0.0% |
| Bio, Nature & Agricultural | 1 | 50.0% |
| Physical & Health Sciences | 0 | 0.0% |
| Psychology | 0 | 0.0% |
| Social Sciences | 1 | 50.0% |
| Engineering | 0 | 0.0% |
| Multidisciplinary Studies | 0 | 0.0% |
| Science & Technology | 0 | 0.0% |
| Business | 0 | 0.0% |
| Education | 0 | 0.0% |
| Literature & Languages | 0 | 0.0% |
| Liberal Arts & History | 0 | 0.0% |
| Visual & Performing Arts | 0 | 0.0% |
| Communications | 0 | 0.0% |
| Arts & Humanities | 0 | 0.0% |
| Total | 2 | 100.0% |
Transportation & Commute in Summit
Vehicle Availability by Sex in Summit
The most prevalent vehicle ownership categories in Summit are males with 2 vehicles (8, accounting for 88.9%) and females with 2 vehicles (5, making up 133.3%).
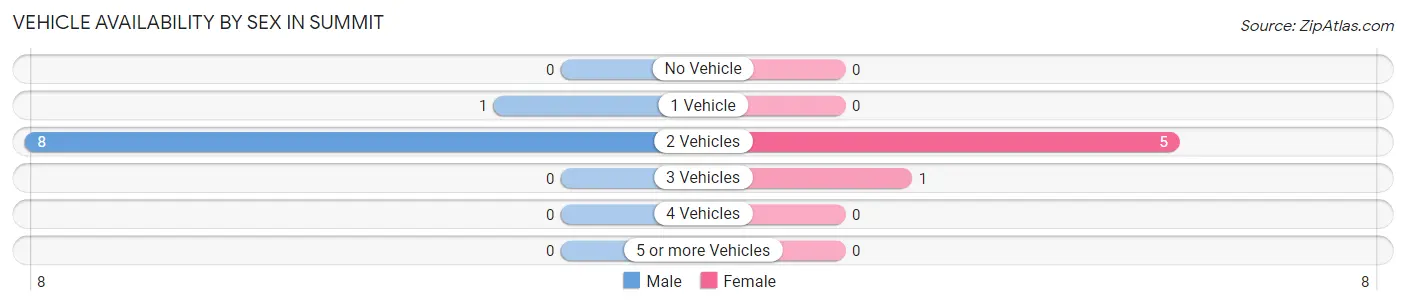
| Vehicles Available | Male | Female |
| No Vehicle | 0 (0.0%) | 0 (0.0%) |
| 1 Vehicle | 1 (11.1%) | 0 (0.0%) |
| 2 Vehicles | 8 (88.9%) | 5 (83.3%) |
| 3 Vehicles | 0 (0.0%) | 1 (16.7%) |
| 4 Vehicles | 0 (0.0%) | 0 (0.0%) |
| 5 or more Vehicles | 0 (0.0%) | 0 (0.0%) |
| Total | 9 (100.0%) | 6 (100.0%) |
Commute Time in Summit
The most frequently occuring commute durations in Summit are 90 or more minutes (5 commuters, 35.7%), 15 to 19 minutes (4 commuters, 28.6%), and 45 to 59 minutes (3 commuters, 21.4%).
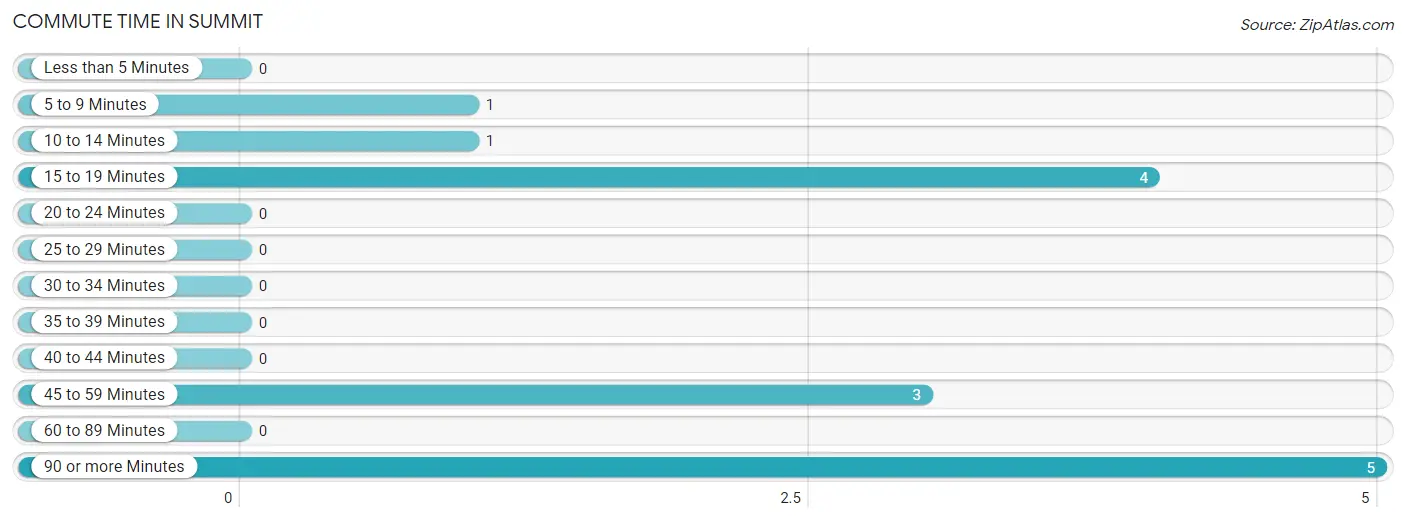
| Commute Time | # Commuters | % Commuters |
| Less than 5 Minutes | 0 | 0.0% |
| 5 to 9 Minutes | 1 | 7.1% |
| 10 to 14 Minutes | 1 | 7.1% |
| 15 to 19 Minutes | 4 | 28.6% |
| 20 to 24 Minutes | 0 | 0.0% |
| 25 to 29 Minutes | 0 | 0.0% |
| 30 to 34 Minutes | 0 | 0.0% |
| 35 to 39 Minutes | 0 | 0.0% |
| 40 to 44 Minutes | 0 | 0.0% |
| 45 to 59 Minutes | 3 | 21.4% |
| 60 to 89 Minutes | 0 | 0.0% |
| 90 or more Minutes | 5 | 35.7% |
Commute Time by Sex in Summit
The most common commute times in Summit are 90 or more minutes (5 commuters, 62.5%) for males and 45 to 59 minutes (3 commuters, 50.0%) for females.
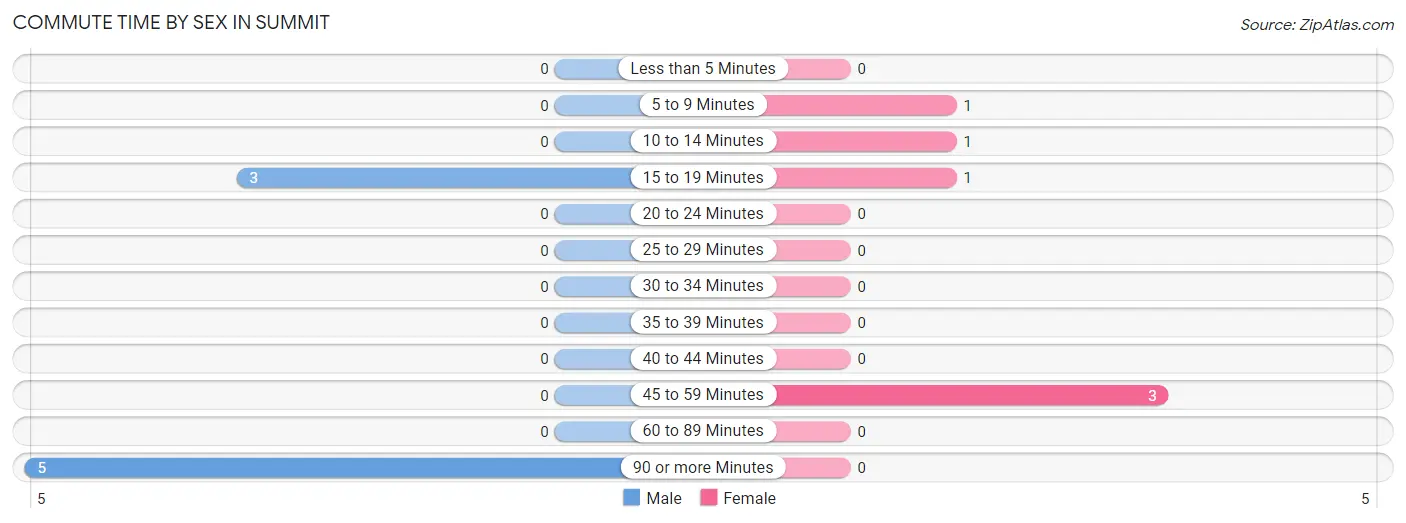
| Commute Time | Male | Female |
| Less than 5 Minutes | 0 (0.0%) | 0 (0.0%) |
| 5 to 9 Minutes | 0 (0.0%) | 1 (16.7%) |
| 10 to 14 Minutes | 0 (0.0%) | 1 (16.7%) |
| 15 to 19 Minutes | 3 (37.5%) | 1 (16.7%) |
| 20 to 24 Minutes | 0 (0.0%) | 0 (0.0%) |
| 25 to 29 Minutes | 0 (0.0%) | 0 (0.0%) |
| 30 to 34 Minutes | 0 (0.0%) | 0 (0.0%) |
| 35 to 39 Minutes | 0 (0.0%) | 0 (0.0%) |
| 40 to 44 Minutes | 0 (0.0%) | 0 (0.0%) |
| 45 to 59 Minutes | 0 (0.0%) | 3 (50.0%) |
| 60 to 89 Minutes | 0 (0.0%) | 0 (0.0%) |
| 90 or more Minutes | 5 (62.5%) | 0 (0.0%) |
Time of Departure to Work by Sex in Summit
The most frequent times of departure to work in Summit are 12:00 AM to 4:59 AM (4, 50.0%) for males and 6:30 AM to 6:59 AM (3, 50.0%) for females.
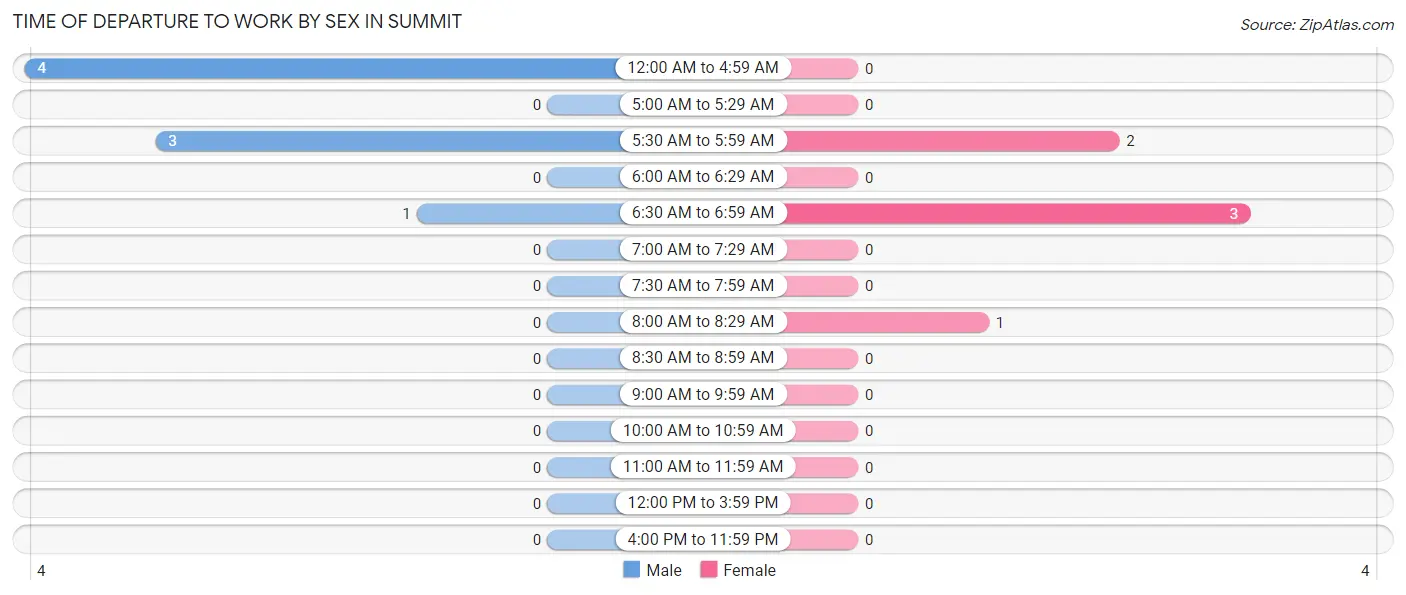
| Time of Departure | Male | Female |
| 12:00 AM to 4:59 AM | 4 (50.0%) | 0 (0.0%) |
| 5:00 AM to 5:29 AM | 0 (0.0%) | 0 (0.0%) |
| 5:30 AM to 5:59 AM | 3 (37.5%) | 2 (33.3%) |
| 6:00 AM to 6:29 AM | 0 (0.0%) | 0 (0.0%) |
| 6:30 AM to 6:59 AM | 1 (12.5%) | 3 (50.0%) |
| 7:00 AM to 7:29 AM | 0 (0.0%) | 0 (0.0%) |
| 7:30 AM to 7:59 AM | 0 (0.0%) | 0 (0.0%) |
| 8:00 AM to 8:29 AM | 0 (0.0%) | 1 (16.7%) |
| 8:30 AM to 8:59 AM | 0 (0.0%) | 0 (0.0%) |
| 9:00 AM to 9:59 AM | 0 (0.0%) | 0 (0.0%) |
| 10:00 AM to 10:59 AM | 0 (0.0%) | 0 (0.0%) |
| 11:00 AM to 11:59 AM | 0 (0.0%) | 0 (0.0%) |
| 12:00 PM to 3:59 PM | 0 (0.0%) | 0 (0.0%) |
| 4:00 PM to 11:59 PM | 0 (0.0%) | 0 (0.0%) |
| Total | 8 (100.0%) | 6 (100.0%) |
Housing Occupancy in Summit
Occupancy by Ownership in Summit
Of the total 37 dwellings in Summit, owner-occupied units account for 34 (91.9%), while renter-occupied units make up 3 (8.1%).
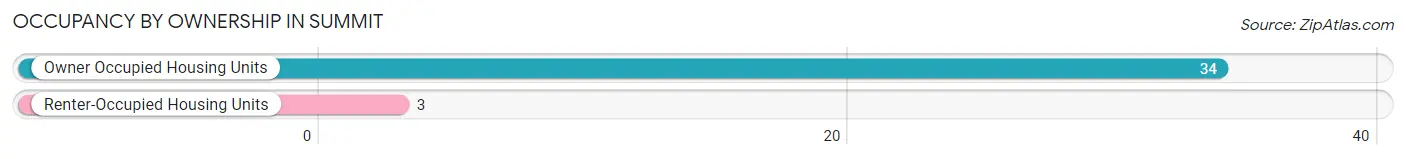
| Occupancy | # Housing Units | % Housing Units |
| Owner Occupied Housing Units | 34 | 91.9% |
| Renter-Occupied Housing Units | 3 | 8.1% |
| Total Occupied Housing Units | 37 | 100.0% |
Occupancy by Household Size in Summit
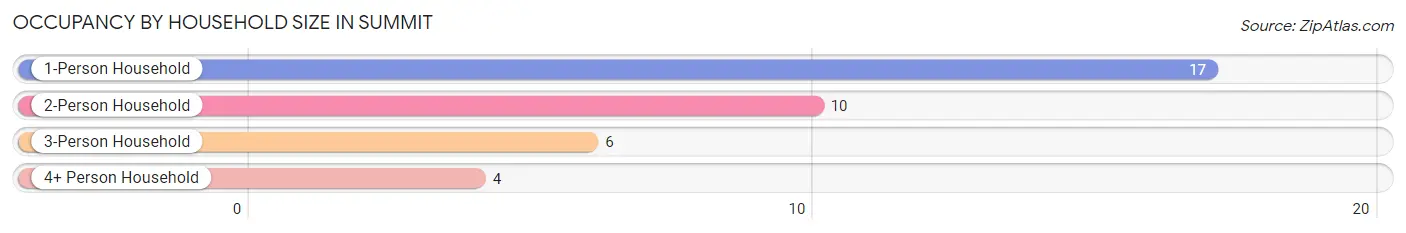
| Household Size | # Housing Units | % Housing Units |
| 1-Person Household | 17 | 46.0% |
| 2-Person Household | 10 | 27.0% |
| 3-Person Household | 6 | 16.2% |
| 4+ Person Household | 4 | 10.8% |
| Total Housing Units | 37 | 100.0% |
Occupancy by Ownership by Household Size in Summit
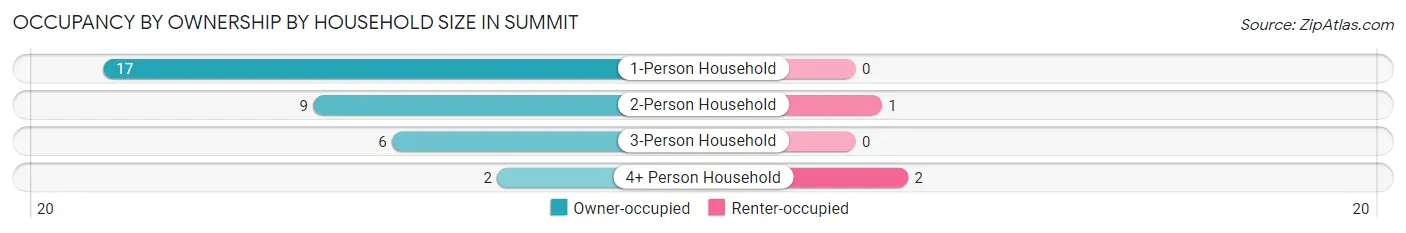
| Household Size | Owner-occupied | Renter-occupied |
| 1-Person Household | 17 (100.0%) | 0 (0.0%) |
| 2-Person Household | 9 (90.0%) | 1 (10.0%) |
| 3-Person Household | 6 (100.0%) | 0 (0.0%) |
| 4+ Person Household | 2 (50.0%) | 2 (50.0%) |
| Total Housing Units | 34 (91.9%) | 3 (8.1%) |
Occupancy by Educational Attainment in Summit
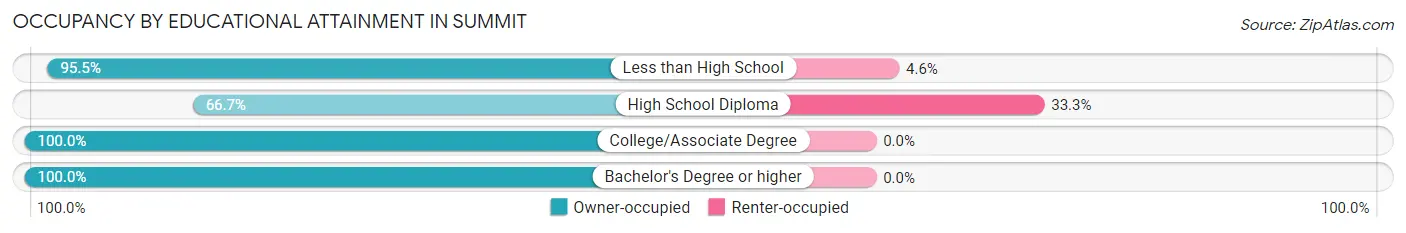
| Household Size | Owner-occupied | Renter-occupied |
| Less than High School | 21 (95.5%) | 1 (4.5%) |
| High School Diploma | 4 (66.7%) | 2 (33.3%) |
| College/Associate Degree | 7 (100.0%) | 0 (0.0%) |
| Bachelor's Degree or higher | 2 (100.0%) | 0 (0.0%) |
Occupancy by Age of Householder in Summit
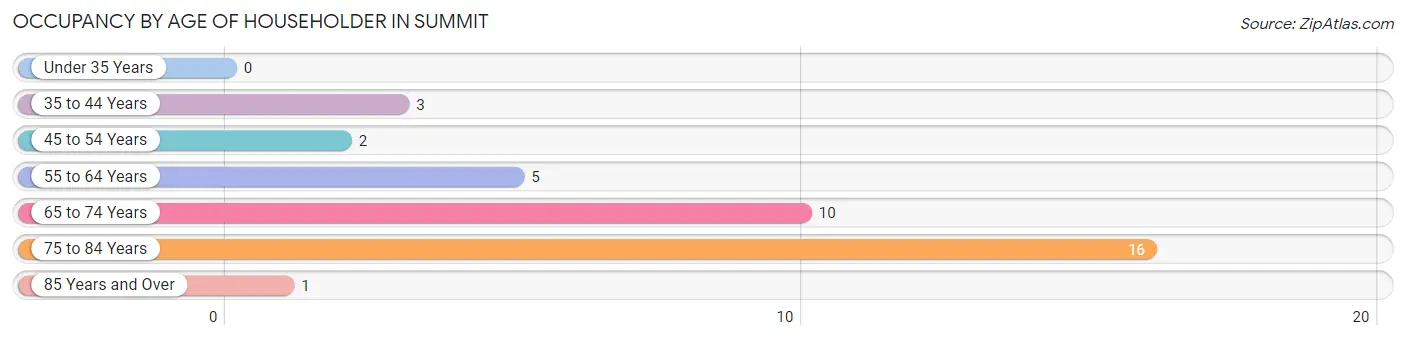
| Age Bracket | # Households | % Households |
| Under 35 Years | 0 | 0.0% |
| 35 to 44 Years | 3 | 8.1% |
| 45 to 54 Years | 2 | 5.4% |
| 55 to 64 Years | 5 | 13.5% |
| 65 to 74 Years | 10 | 27.0% |
| 75 to 84 Years | 16 | 43.2% |
| 85 Years and Over | 1 | 2.7% |
| Total | 37 | 100.0% |
Housing Finances in Summit
Median Income by Occupancy in Summit
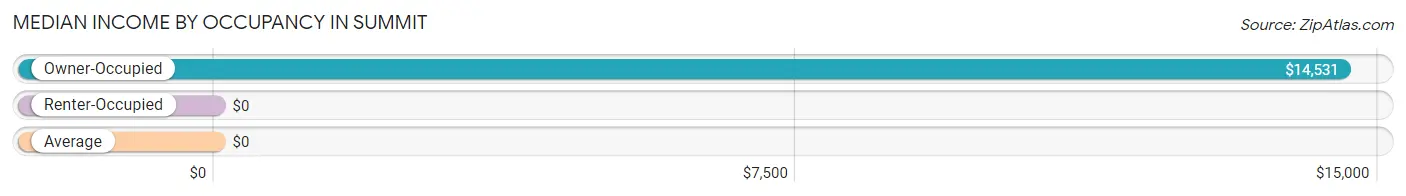
| Occupancy Type | # Households | Median Income |
| Owner-Occupied | 34 (91.9%) | $14,531 |
| Renter-Occupied | 3 (8.1%) | $0 |
| Average | 37 (100.0%) | $0 |
Occupancy by Householder Income Bracket in Summit
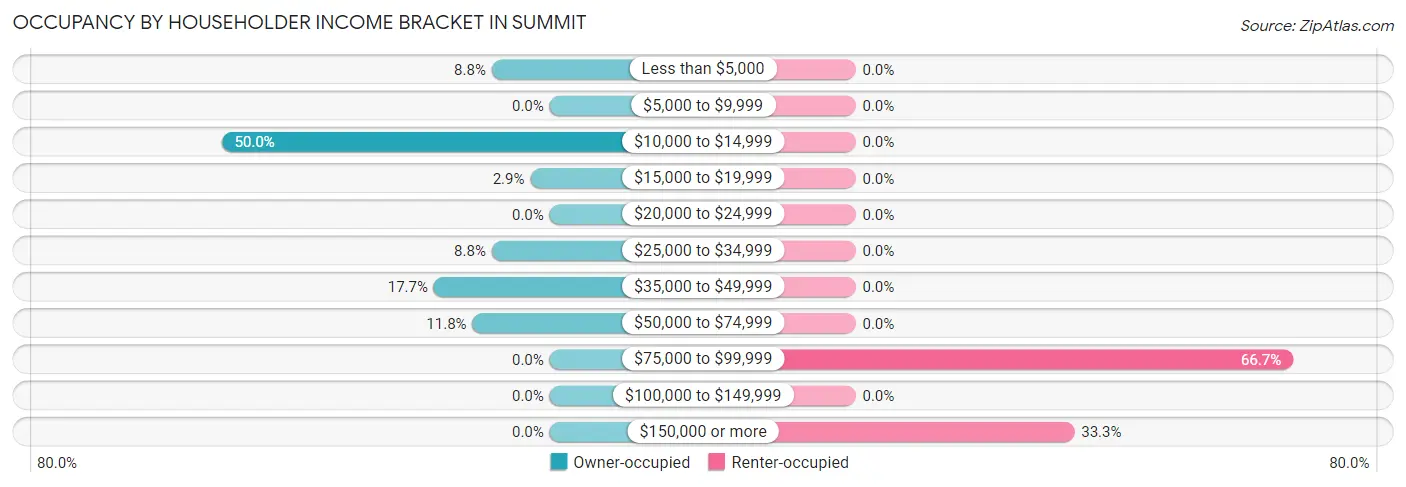
| Income Bracket | Owner-occupied | Renter-occupied |
| Less than $5,000 | 3 (8.8%) | 0 (0.0%) |
| $5,000 to $9,999 | 0 (0.0%) | 0 (0.0%) |
| $10,000 to $14,999 | 17 (50.0%) | 0 (0.0%) |
| $15,000 to $19,999 | 1 (2.9%) | 0 (0.0%) |
| $20,000 to $24,999 | 0 (0.0%) | 0 (0.0%) |
| $25,000 to $34,999 | 3 (8.8%) | 0 (0.0%) |
| $35,000 to $49,999 | 6 (17.6%) | 0 (0.0%) |
| $50,000 to $74,999 | 4 (11.8%) | 0 (0.0%) |
| $75,000 to $99,999 | 0 (0.0%) | 2 (66.7%) |
| $100,000 to $149,999 | 0 (0.0%) | 0 (0.0%) |
| $150,000 or more | 0 (0.0%) | 1 (33.3%) |
| Total | 34 (100.0%) | 3 (100.0%) |
Monthly Housing Cost Tiers in Summit
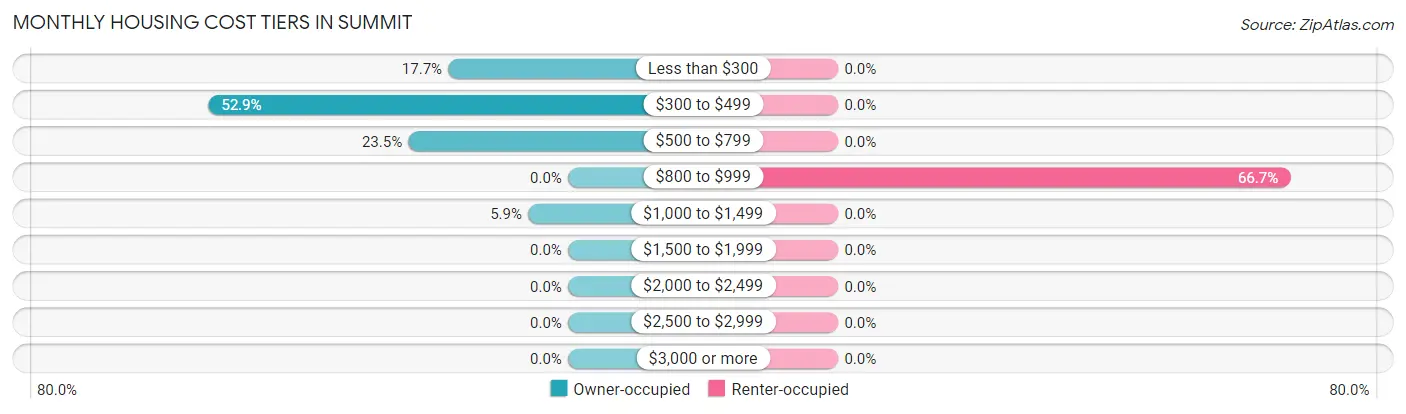
| Monthly Cost | Owner-occupied | Renter-occupied |
| Less than $300 | 6 (17.6%) | 0 (0.0%) |
| $300 to $499 | 18 (52.9%) | 0 (0.0%) |
| $500 to $799 | 8 (23.5%) | 0 (0.0%) |
| $800 to $999 | 0 (0.0%) | 2 (66.7%) |
| $1,000 to $1,499 | 2 (5.9%) | 0 (0.0%) |
| $1,500 to $1,999 | 0 (0.0%) | 0 (0.0%) |
| $2,000 to $2,499 | 0 (0.0%) | 0 (0.0%) |
| $2,500 to $2,999 | 0 (0.0%) | 0 (0.0%) |
| $3,000 or more | 0 (0.0%) | 0 (0.0%) |
| Total | 34 (100.0%) | 3 (100.0%) |
Physical Housing Characteristics in Summit
Housing Structures in Summit
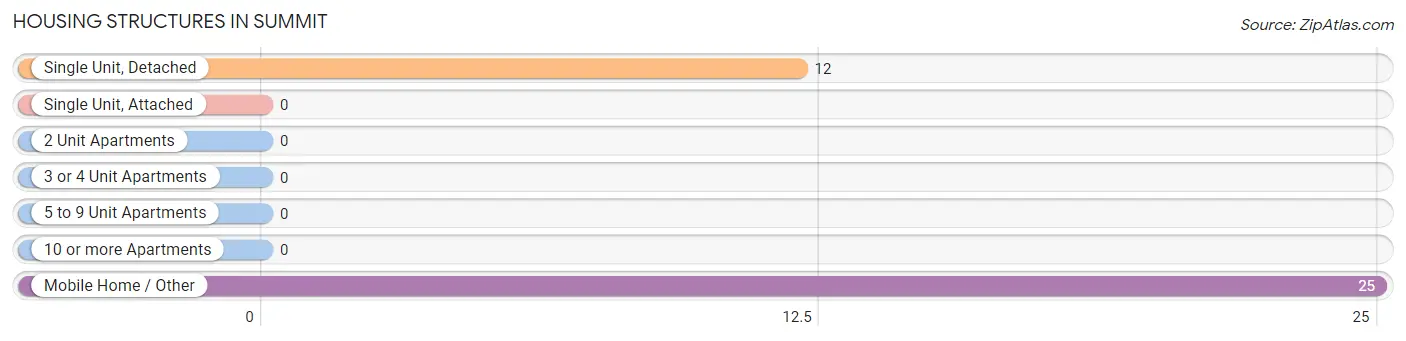
| Structure Type | # Housing Units | % Housing Units |
| Single Unit, Detached | 12 | 32.4% |
| Single Unit, Attached | 0 | 0.0% |
| 2 Unit Apartments | 0 | 0.0% |
| 3 or 4 Unit Apartments | 0 | 0.0% |
| 5 to 9 Unit Apartments | 0 | 0.0% |
| 10 or more Apartments | 0 | 0.0% |
| Mobile Home / Other | 25 | 67.6% |
| Total | 37 | 100.0% |
Housing Structures by Occupancy in Summit
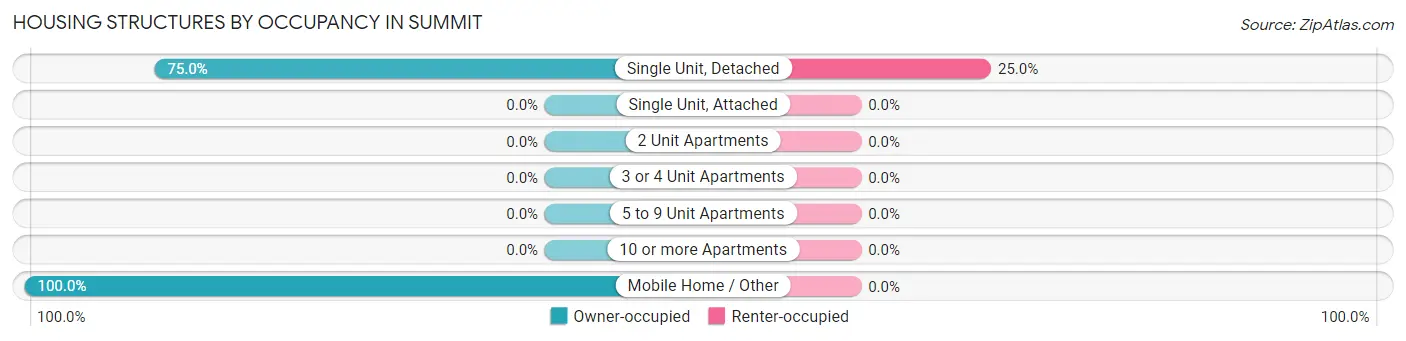
| Structure Type | Owner-occupied | Renter-occupied |
| Single Unit, Detached | 9 (75.0%) | 3 (25.0%) |
| Single Unit, Attached | 0 (0.0%) | 0 (0.0%) |
| 2 Unit Apartments | 0 (0.0%) | 0 (0.0%) |
| 3 or 4 Unit Apartments | 0 (0.0%) | 0 (0.0%) |
| 5 to 9 Unit Apartments | 0 (0.0%) | 0 (0.0%) |
| 10 or more Apartments | 0 (0.0%) | 0 (0.0%) |
| Mobile Home / Other | 25 (100.0%) | 0 (0.0%) |
| Total | 34 (91.9%) | 3 (8.1%) |
Housing Structures by Number of Rooms in Summit
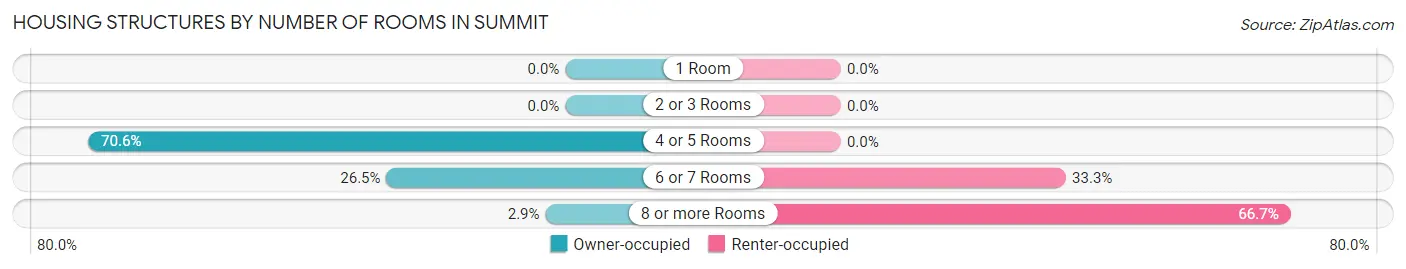
| Number of Rooms | Owner-occupied | Renter-occupied |
| 1 Room | 0 (0.0%) | 0 (0.0%) |
| 2 or 3 Rooms | 0 (0.0%) | 0 (0.0%) |
| 4 or 5 Rooms | 24 (70.6%) | 0 (0.0%) |
| 6 or 7 Rooms | 9 (26.5%) | 1 (33.3%) |
| 8 or more Rooms | 1 (2.9%) | 2 (66.7%) |
| Total | 34 (100.0%) | 3 (100.0%) |
Housing Structure by Heating Type in Summit
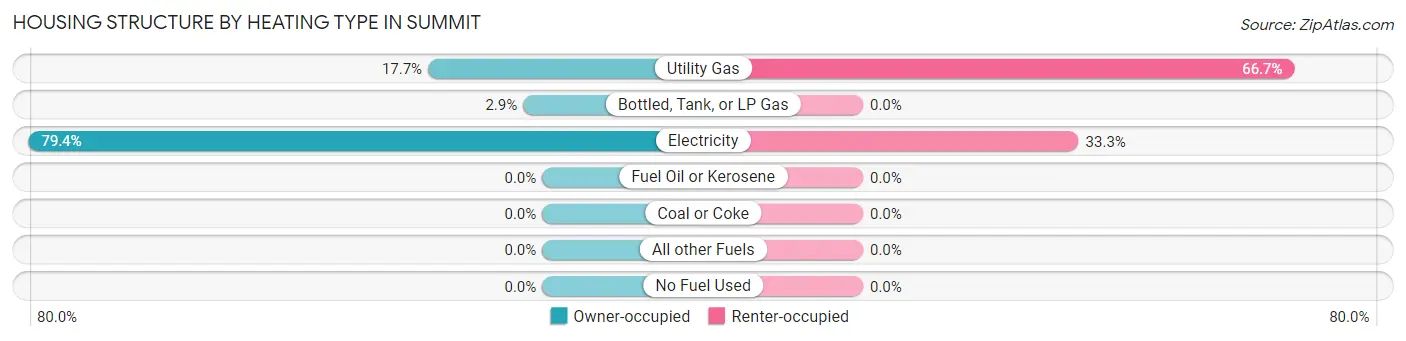
| Heating Type | Owner-occupied | Renter-occupied |
| Utility Gas | 6 (17.6%) | 2 (66.7%) |
| Bottled, Tank, or LP Gas | 1 (2.9%) | 0 (0.0%) |
| Electricity | 27 (79.4%) | 1 (33.3%) |
| Fuel Oil or Kerosene | 0 (0.0%) | 0 (0.0%) |
| Coal or Coke | 0 (0.0%) | 0 (0.0%) |
| All other Fuels | 0 (0.0%) | 0 (0.0%) |
| No Fuel Used | 0 (0.0%) | 0 (0.0%) |
| Total | 34 (100.0%) | 3 (100.0%) |
Household Vehicle Usage in Summit
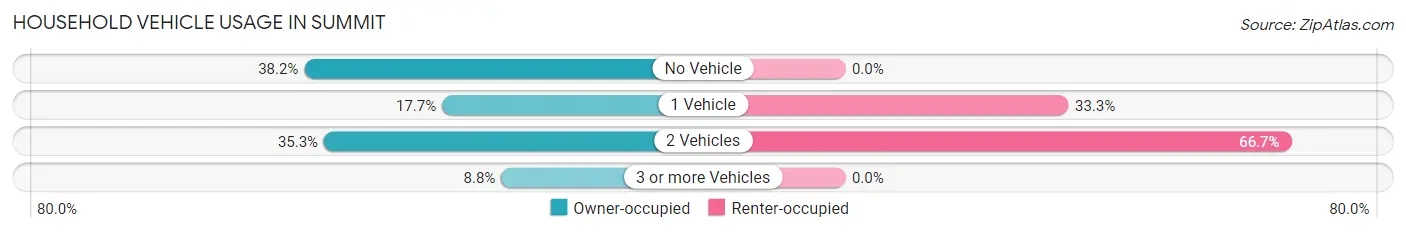
| Vehicles per Household | Owner-occupied | Renter-occupied |
| No Vehicle | 13 (38.2%) | 0 (0.0%) |
| 1 Vehicle | 6 (17.6%) | 1 (33.3%) |
| 2 Vehicles | 12 (35.3%) | 2 (66.7%) |
| 3 or more Vehicles | 3 (8.8%) | 0 (0.0%) |
| Total | 34 (100.0%) | 3 (100.0%) |
Real Estate & Mortgages in Summit
Real Estate and Mortgage Overview in Summit
| Characteristic | Without Mortgage | With Mortgage |
| Housing Units | 28 | 6 |
| Median Property Value | $9,999 | $0 |
| Median Household Income | $14,167 | $0 |
| Monthly Housing Costs | $373 | $0 |
| Real Estate Taxes | $199 | $0 |
Property Value by Mortgage Status in Summit
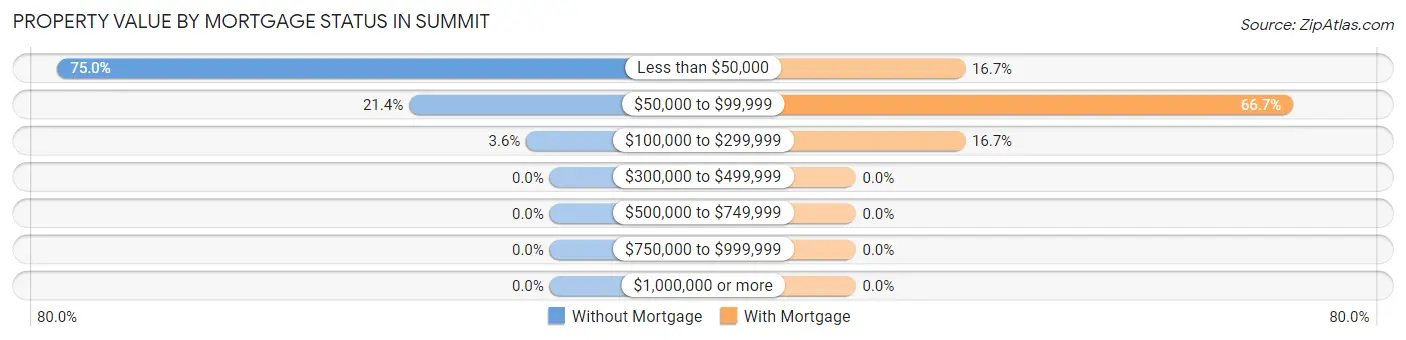
| Property Value | Without Mortgage | With Mortgage |
| Less than $50,000 | 21 (75.0%) | 1 (16.7%) |
| $50,000 to $99,999 | 6 (21.4%) | 4 (66.7%) |
| $100,000 to $299,999 | 1 (3.6%) | 1 (16.7%) |
| $300,000 to $499,999 | 0 (0.0%) | 0 (0.0%) |
| $500,000 to $749,999 | 0 (0.0%) | 0 (0.0%) |
| $750,000 to $999,999 | 0 (0.0%) | 0 (0.0%) |
| $1,000,000 or more | 0 (0.0%) | 0 (0.0%) |
| Total | 28 (100.0%) | 6 (100.0%) |
Household Income by Mortgage Status in Summit
| Household Income | Without Mortgage | With Mortgage |
| Less than $10,000 | 3 (10.7%) | 0 (0.0%) |
| $10,000 to $24,999 | 17 (60.7%) | 0 (0.0%) |
| $25,000 to $34,999 | 1 (3.6%) | 1 (16.7%) |
| $35,000 to $49,999 | 6 (21.4%) | 2 (33.3%) |
| $50,000 to $74,999 | 1 (3.6%) | 0 (0.0%) |
| $75,000 to $99,999 | 0 (0.0%) | 3 (50.0%) |
| $100,000 to $149,999 | 0 (0.0%) | 0 (0.0%) |
| $150,000 or more | 0 (0.0%) | 0 (0.0%) |
| Total | 28 (100.0%) | 6 (100.0%) |
Property Value to Household Income Ratio in Summit
| Value-to-Income Ratio | Without Mortgage | With Mortgage |
| Less than 2.0x | 22 (78.6%) | 0 (0.0%) |
| 2.0x to 2.9x | 4 (14.3%) | 2 (33.3%) |
| 3.0x to 3.9x | 0 (0.0%) | 3 (50.0%) |
| 4.0x or more | 2 (7.1%) | 0 (0.0%) |
| Total | 28 (100.0%) | 6 (100.0%) |
Real Estate Taxes by Mortgage Status in Summit
| Property Taxes | Without Mortgage | With Mortgage |
| Less than $800 | 26 (92.9%) | 0 (0.0%) |
| $800 to $1,499 | 1 (3.6%) | 6 (100.0%) |
| $800 to $1,499 | 0 (0.0%) | 0 (0.0%) |
| Total | 28 (100.0%) | 6 (100.0%) |
Health & Disability in Summit
Health Insurance Coverage by Age in Summit
| Age Bracket | With Coverage | Without Coverage |
| Under 6 Years | 0 (0.0%) | 1 (100.0%) |
| 6 to 18 Years | 22 (100.0%) | 0 (0.0%) |
| 19 to 25 Years | 1 (100.0%) | 0 (0.0%) |
| 26 to 34 Years | 0 (0.0%) | 0 (0.0%) |
| 35 to 44 Years | 6 (85.7%) | 1 (14.3%) |
| 45 to 54 Years | 4 (57.1%) | 3 (42.9%) |
| 55 to 64 Years | 8 (88.9%) | 1 (11.1%) |
| 65 to 74 Years | 18 (100.0%) | 0 (0.0%) |
| 75 Years and older | 18 (100.0%) | 0 (0.0%) |
| Total | 77 (92.8%) | 6 (7.2%) |
Health Insurance Coverage by Citizenship Status in Summit
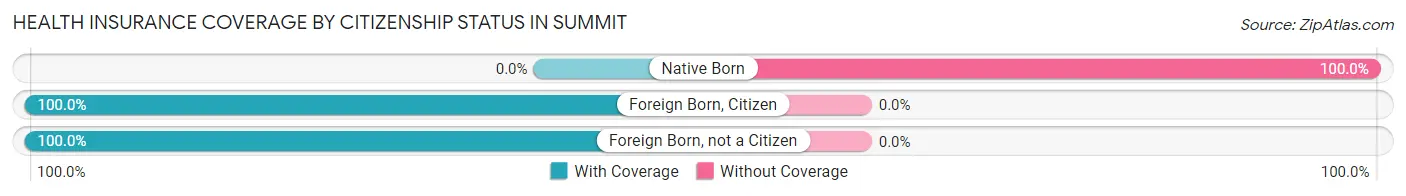
| Citizenship Status | With Coverage | Without Coverage |
| Native Born | 0 (0.0%) | 1 (100.0%) |
| Foreign Born, Citizen | 22 (100.0%) | 0 (0.0%) |
| Foreign Born, not a Citizen | 1 (100.0%) | 0 (0.0%) |
Health Insurance Coverage by Household Income in Summit
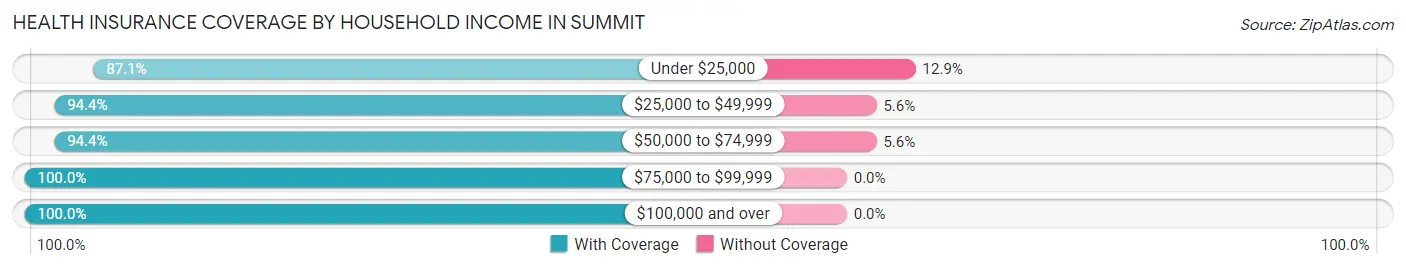
| Household Income | With Coverage | Without Coverage |
| Under $25,000 | 27 (87.1%) | 4 (12.9%) |
| $25,000 to $49,999 | 17 (94.4%) | 1 (5.6%) |
| $50,000 to $74,999 | 17 (94.4%) | 1 (5.6%) |
| $75,000 to $99,999 | 14 (100.0%) | 0 (0.0%) |
| $100,000 and over | 2 (100.0%) | 0 (0.0%) |
Public vs Private Health Insurance Coverage by Age in Summit
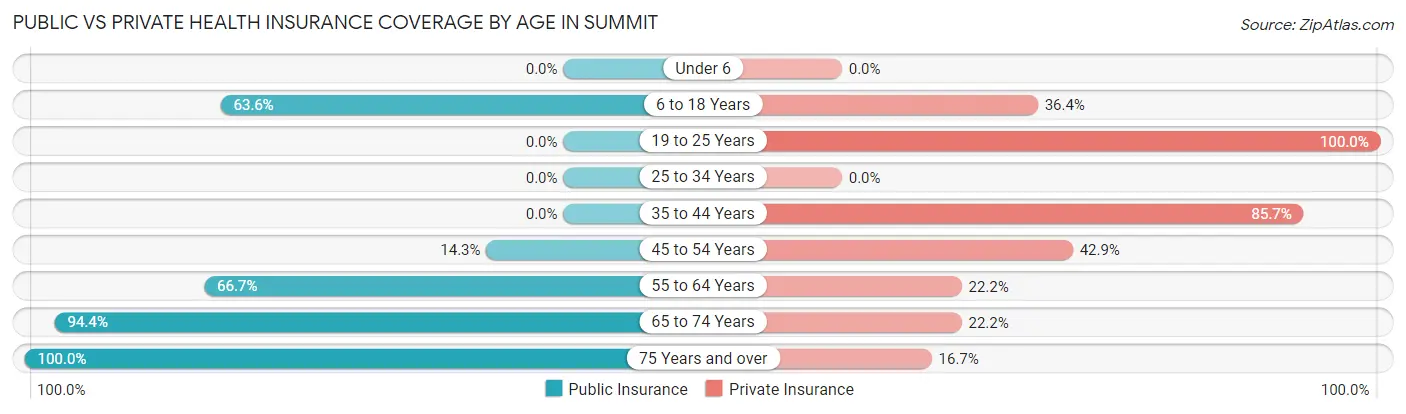
| Age Bracket | Public Insurance | Private Insurance |
| Under 6 | 0 (0.0%) | 0 (0.0%) |
| 6 to 18 Years | 14 (63.6%) | 8 (36.4%) |
| 19 to 25 Years | 0 (0.0%) | 1 (100.0%) |
| 25 to 34 Years | 0 (0.0%) | 0 (0.0%) |
| 35 to 44 Years | 0 (0.0%) | 6 (85.7%) |
| 45 to 54 Years | 1 (14.3%) | 3 (42.9%) |
| 55 to 64 Years | 6 (66.7%) | 2 (22.2%) |
| 65 to 74 Years | 17 (94.4%) | 4 (22.2%) |
| 75 Years and over | 18 (100.0%) | 3 (16.7%) |
| Total | 56 (67.5%) | 27 (32.5%) |
Disability Status by Sex by Age in Summit
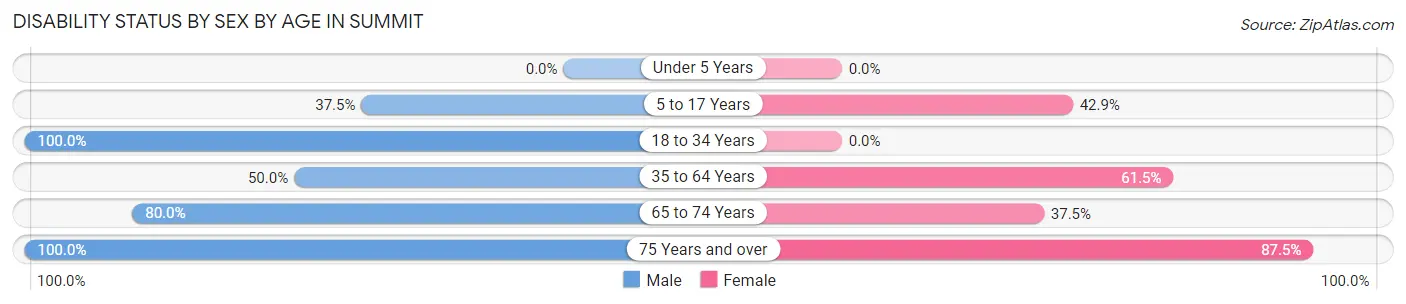
| Age Bracket | Male | Female |
| Under 5 Years | 0 (0.0%) | 0 (0.0%) |
| 5 to 17 Years | 3 (37.5%) | 6 (42.9%) |
| 18 to 34 Years | 1 (100.0%) | 0 (0.0%) |
| 35 to 64 Years | 5 (50.0%) | 8 (61.5%) |
| 65 to 74 Years | 8 (80.0%) | 3 (37.5%) |
| 75 Years and over | 2 (100.0%) | 14 (87.5%) |
Disability Class by Sex by Age in Summit
Disability Class: Hearing Difficulty
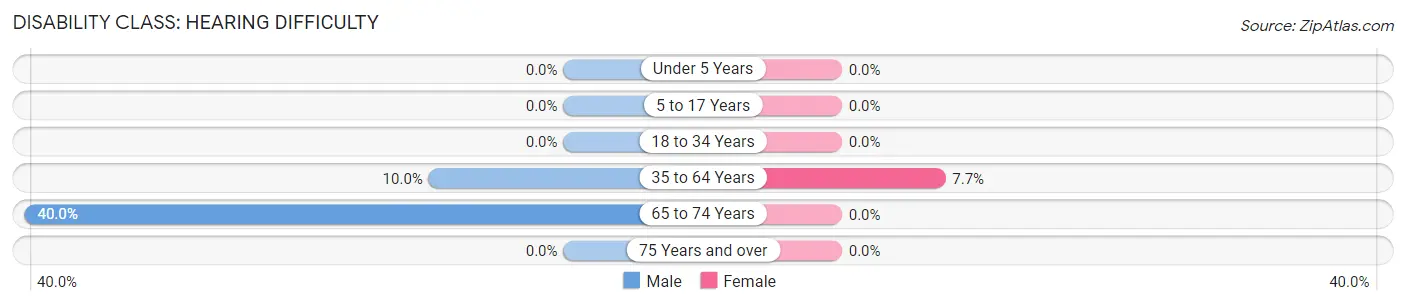
| Age Bracket | Male | Female |
| Under 5 Years | 0 (0.0%) | 0 (0.0%) |
| 5 to 17 Years | 0 (0.0%) | 0 (0.0%) |
| 18 to 34 Years | 0 (0.0%) | 0 (0.0%) |
| 35 to 64 Years | 1 (10.0%) | 1 (7.7%) |
| 65 to 74 Years | 4 (40.0%) | 0 (0.0%) |
| 75 Years and over | 0 (0.0%) | 0 (0.0%) |
Disability Class: Vision Difficulty
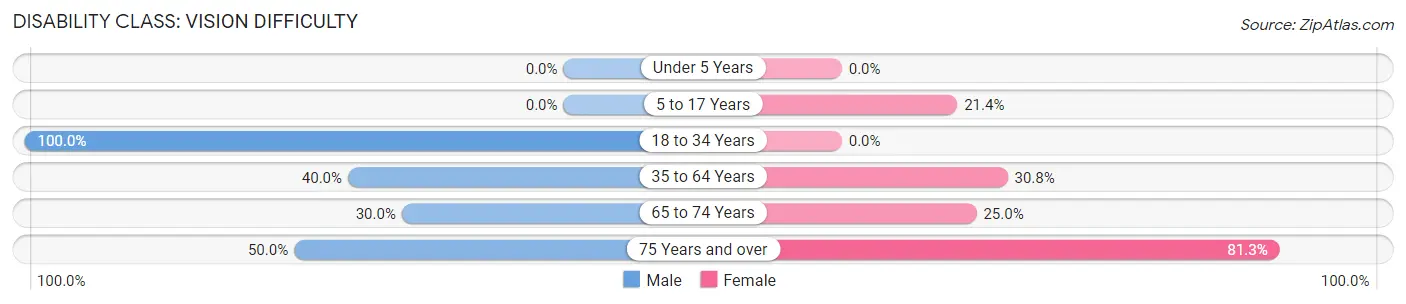
| Age Bracket | Male | Female |
| Under 5 Years | 0 (0.0%) | 0 (0.0%) |
| 5 to 17 Years | 0 (0.0%) | 3 (21.4%) |
| 18 to 34 Years | 1 (100.0%) | 0 (0.0%) |
| 35 to 64 Years | 4 (40.0%) | 4 (30.8%) |
| 65 to 74 Years | 3 (30.0%) | 2 (25.0%) |
| 75 Years and over | 1 (50.0%) | 13 (81.2%) |
Disability Class: Cognitive Difficulty
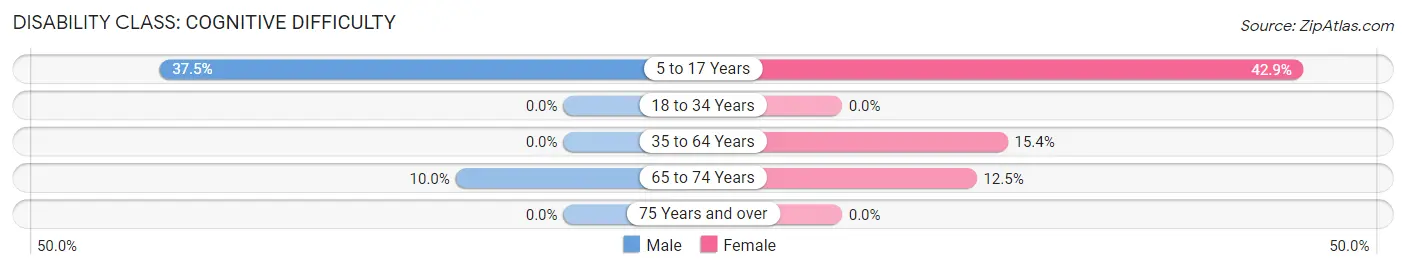
| Age Bracket | Male | Female |
| 5 to 17 Years | 3 (37.5%) | 6 (42.9%) |
| 18 to 34 Years | 0 (0.0%) | 0 (0.0%) |
| 35 to 64 Years | 0 (0.0%) | 2 (15.4%) |
| 65 to 74 Years | 1 (10.0%) | 1 (12.5%) |
| 75 Years and over | 0 (0.0%) | 0 (0.0%) |
Disability Class: Ambulatory Difficulty
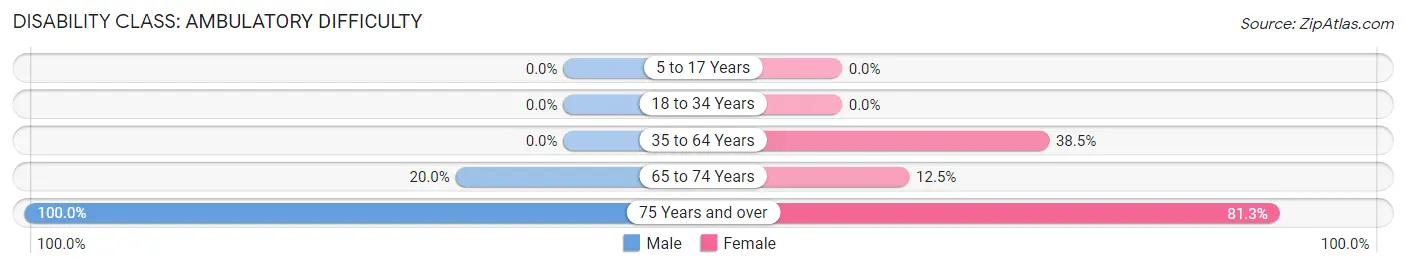
| Age Bracket | Male | Female |
| 5 to 17 Years | 0 (0.0%) | 0 (0.0%) |
| 18 to 34 Years | 0 (0.0%) | 0 (0.0%) |
| 35 to 64 Years | 0 (0.0%) | 5 (38.5%) |
| 65 to 74 Years | 2 (20.0%) | 1 (12.5%) |
| 75 Years and over | 2 (100.0%) | 13 (81.2%) |
Disability Class: Self-Care Difficulty
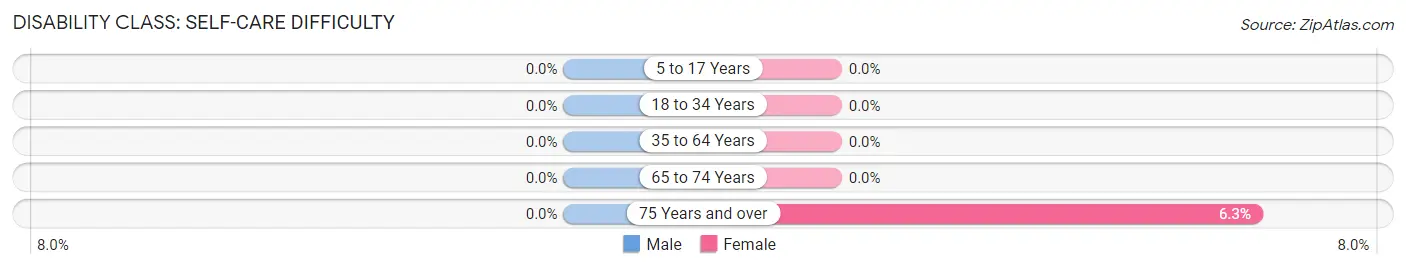
| Age Bracket | Male | Female |
| 5 to 17 Years | 0 (0.0%) | 0 (0.0%) |
| 18 to 34 Years | 0 (0.0%) | 0 (0.0%) |
| 35 to 64 Years | 0 (0.0%) | 0 (0.0%) |
| 65 to 74 Years | 0 (0.0%) | 0 (0.0%) |
| 75 Years and over | 0 (0.0%) | 1 (6.2%) |
Technology Access in Summit
Computing Device Access in Summit
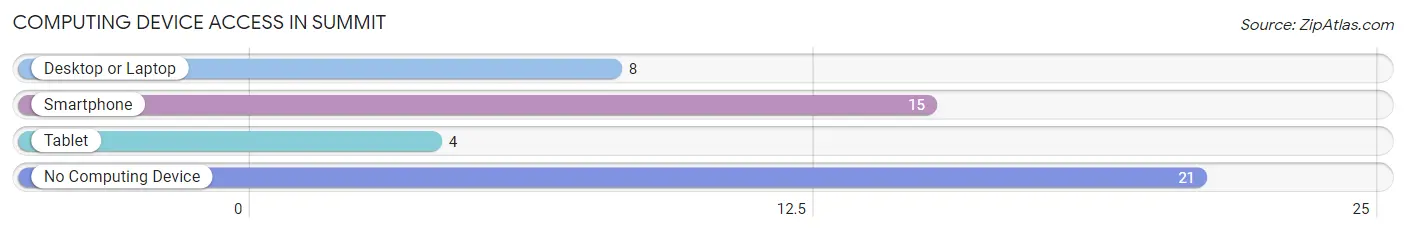
| Device Type | # Households | % Households |
| Desktop or Laptop | 8 | 21.6% |
| Smartphone | 15 | 40.5% |
| Tablet | 4 | 10.8% |
| No Computing Device | 21 | 56.8% |
| Total | 37 | 100.0% |
Internet Access in Summit
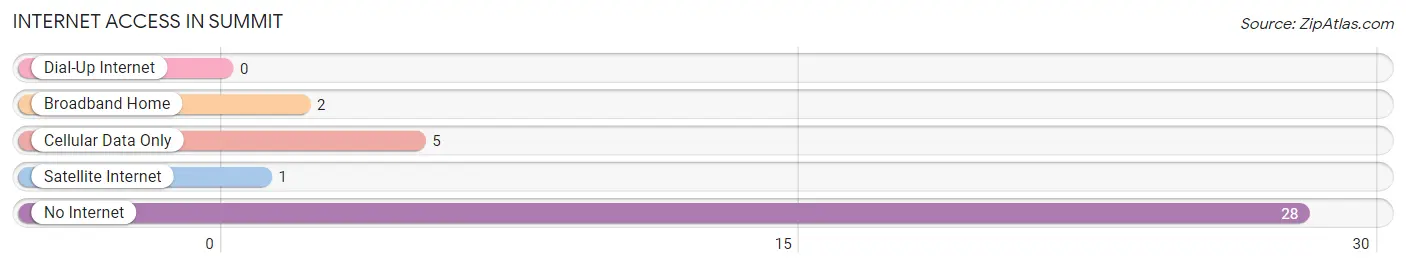
| Internet Type | # Households | % Households |
| Dial-Up Internet | 0 | 0.0% |
| Broadband Home | 2 | 5.4% |
| Cellular Data Only | 5 | 13.5% |
| Satellite Internet | 1 | 2.7% |
| No Internet | 28 | 75.7% |
| Total | 37 | 100.0% |
Summit Summary
Summit is a small town located in the southeastern corner of Oklahoma, in the Choctaw Nation. It is situated in the foothills of the Ouachita Mountains, and is part of the Kiamichi Country region. The town was founded in 1891 and was originally known as “Summit Station” due to its location at the summit of the Kiamichi Mountains. The town was officially incorporated in 1909.
Geography
Summit is located in southeastern Oklahoma, in the Choctaw Nation. It is situated in the foothills of the Ouachita Mountains, and is part of the Kiamichi Country region. The town is located at the intersection of US Highway 271 and State Highway 3. The town is approximately 20 miles south of Hugo, Oklahoma, and 40 miles north of Paris, Texas. The town is situated at an elevation of 890 feet above sea level.
The town is surrounded by rolling hills and wooded areas. The area is known for its abundance of wildlife, including deer, turkey, and other small game. The town is also home to several small lakes and ponds, which provide excellent fishing opportunities.
Economy
The economy of Summit is largely based on agriculture and tourism. The town is home to several small farms, which produce a variety of crops, including corn, soybeans, and wheat. The town is also home to several small businesses, including a grocery store, a hardware store, and a few restaurants.
The town is also a popular tourist destination, due to its proximity to the Ouachita Mountains and its abundance of outdoor activities. The town is home to several campgrounds, as well as several hiking trails. The town is also home to several hunting lodges, which attract hunters from all over the country.
Demographics
As of the 2010 census, the population of Summit was 1,093. The town is predominantly white, with a small minority population. The median household income in Summit is $31,250, and the median age is 41. The town has a low unemployment rate, and the majority of the population is employed in the agricultural and tourism industries.
Conclusion
Summit is a small town located in the southeastern corner of Oklahoma, in the Choctaw Nation. It is situated in the foothills of the Ouachita Mountains, and is part of the Kiamichi Country region. The town was founded in 1891 and was originally known as “Summit Station” due to its location at the summit of the Kiamichi Mountains. The town is surrounded by rolling hills and wooded areas, and is home to several small farms, businesses, and tourist attractions. The town has a population of 1,093, and the median household income is $31,250. The town is predominantly white, with a small minority population. The town is a popular tourist destination, due to its proximity to the Ouachita Mountains and its abundance of outdoor activities.
Common Questions
What is Per Capita Income in Summit?
Per Capita income in Summit is $15,105.
What is the Median Family Income in Summit?
Median Family Income in Summit is $38,750.
What is Income or Wage Gap in Summit?
Income or Wage Gap in Summit is 26.0%.
Women in Summit earn 74.0 cents for every dollar earned by a man.
What is Inequality or Gini Index in Summit?
Inequality or Gini Index in Summit is 0.47.
What is the Total Population of Summit?
Total Population of Summit is 83.
What is the Total Male Population of Summit?
Total Male Population of Summit is 32.
What is the Total Female Population of Summit?
Total Female Population of Summit is 51.
What is the Ratio of Males per 100 Females in Summit?
There are 62.75 Males per 100 Females in Summit.
What is the Ratio of Females per 100 Males in Summit?
There are 159.38 Females per 100 Males in Summit.
What is the Median Population Age in Summit?
Median Population Age in Summit is 60.8 Years.
What is the Average Family Size in Summit
Average Family Size in Summit is 3.2 People.
What is the Average Household Size in Summit
Average Household Size in Summit is 2.2 People.
How Large is the Labor Force in Summit?
There are 16 People in the Labor Forcein in Summit.
What is the Percentage of People in the Labor Force in Summit?
26.7% of People are in the Labor Force in Summit.
What is the Unemployment Rate in Summit?
Unemployment Rate in Summit is 6.3%.